Grayscale Q3 Crypto Market Report: $3.5 Trillion Market Cap New High, Bitcoin Gives Way to "Alt Season"
TechFlow Selected TechFlow Selected
Grayscale Q3 Crypto Market Report: $3.5 Trillion Market Cap New High, Bitcoin Gives Way to "Alt Season"
Bitcoin underperforms, "alt season" returns, and the macro environment may continue to evolve.
Author: Grayscale
Translation: TechFlow
-
In Q3 2025, all six major sectors of the crypto market posted positive price returns, though fundamental developments varied. Crypto Sectors is our proprietary framework developed in partnership with index provider FTSE/Russell to organize the digital asset market and measure returns.
-
Bitcoin underperformed relative to other crypto market sectors, with its return pattern resembling an "alt season," but one distinct from prior alt seasons.
-
Based on volatility-adjusted price returns, the top 20 tokens in Q3 highlighted the importance of stablecoin legislation and adoption, rising centralized exchange trading volumes, and the trend toward digital asset treasuries (DATs).
Every crypto asset relates to blockchain technology and shares basic market structures, but similarities end there. The crypto asset class encompasses a broad range of software technologies applied across consumer finance, artificial intelligence (AI), media, entertainment, and more. To bring order to this data, Grayscale Research uses a proprietary taxonomy and index series developed with FTSE/Russell—"Crypto Sectors". The Crypto Sectors framework spans six distinct sub-markets (Chart 1). Together, they include 261 tokens with a total market capitalization of $3.5 trillion.[1]
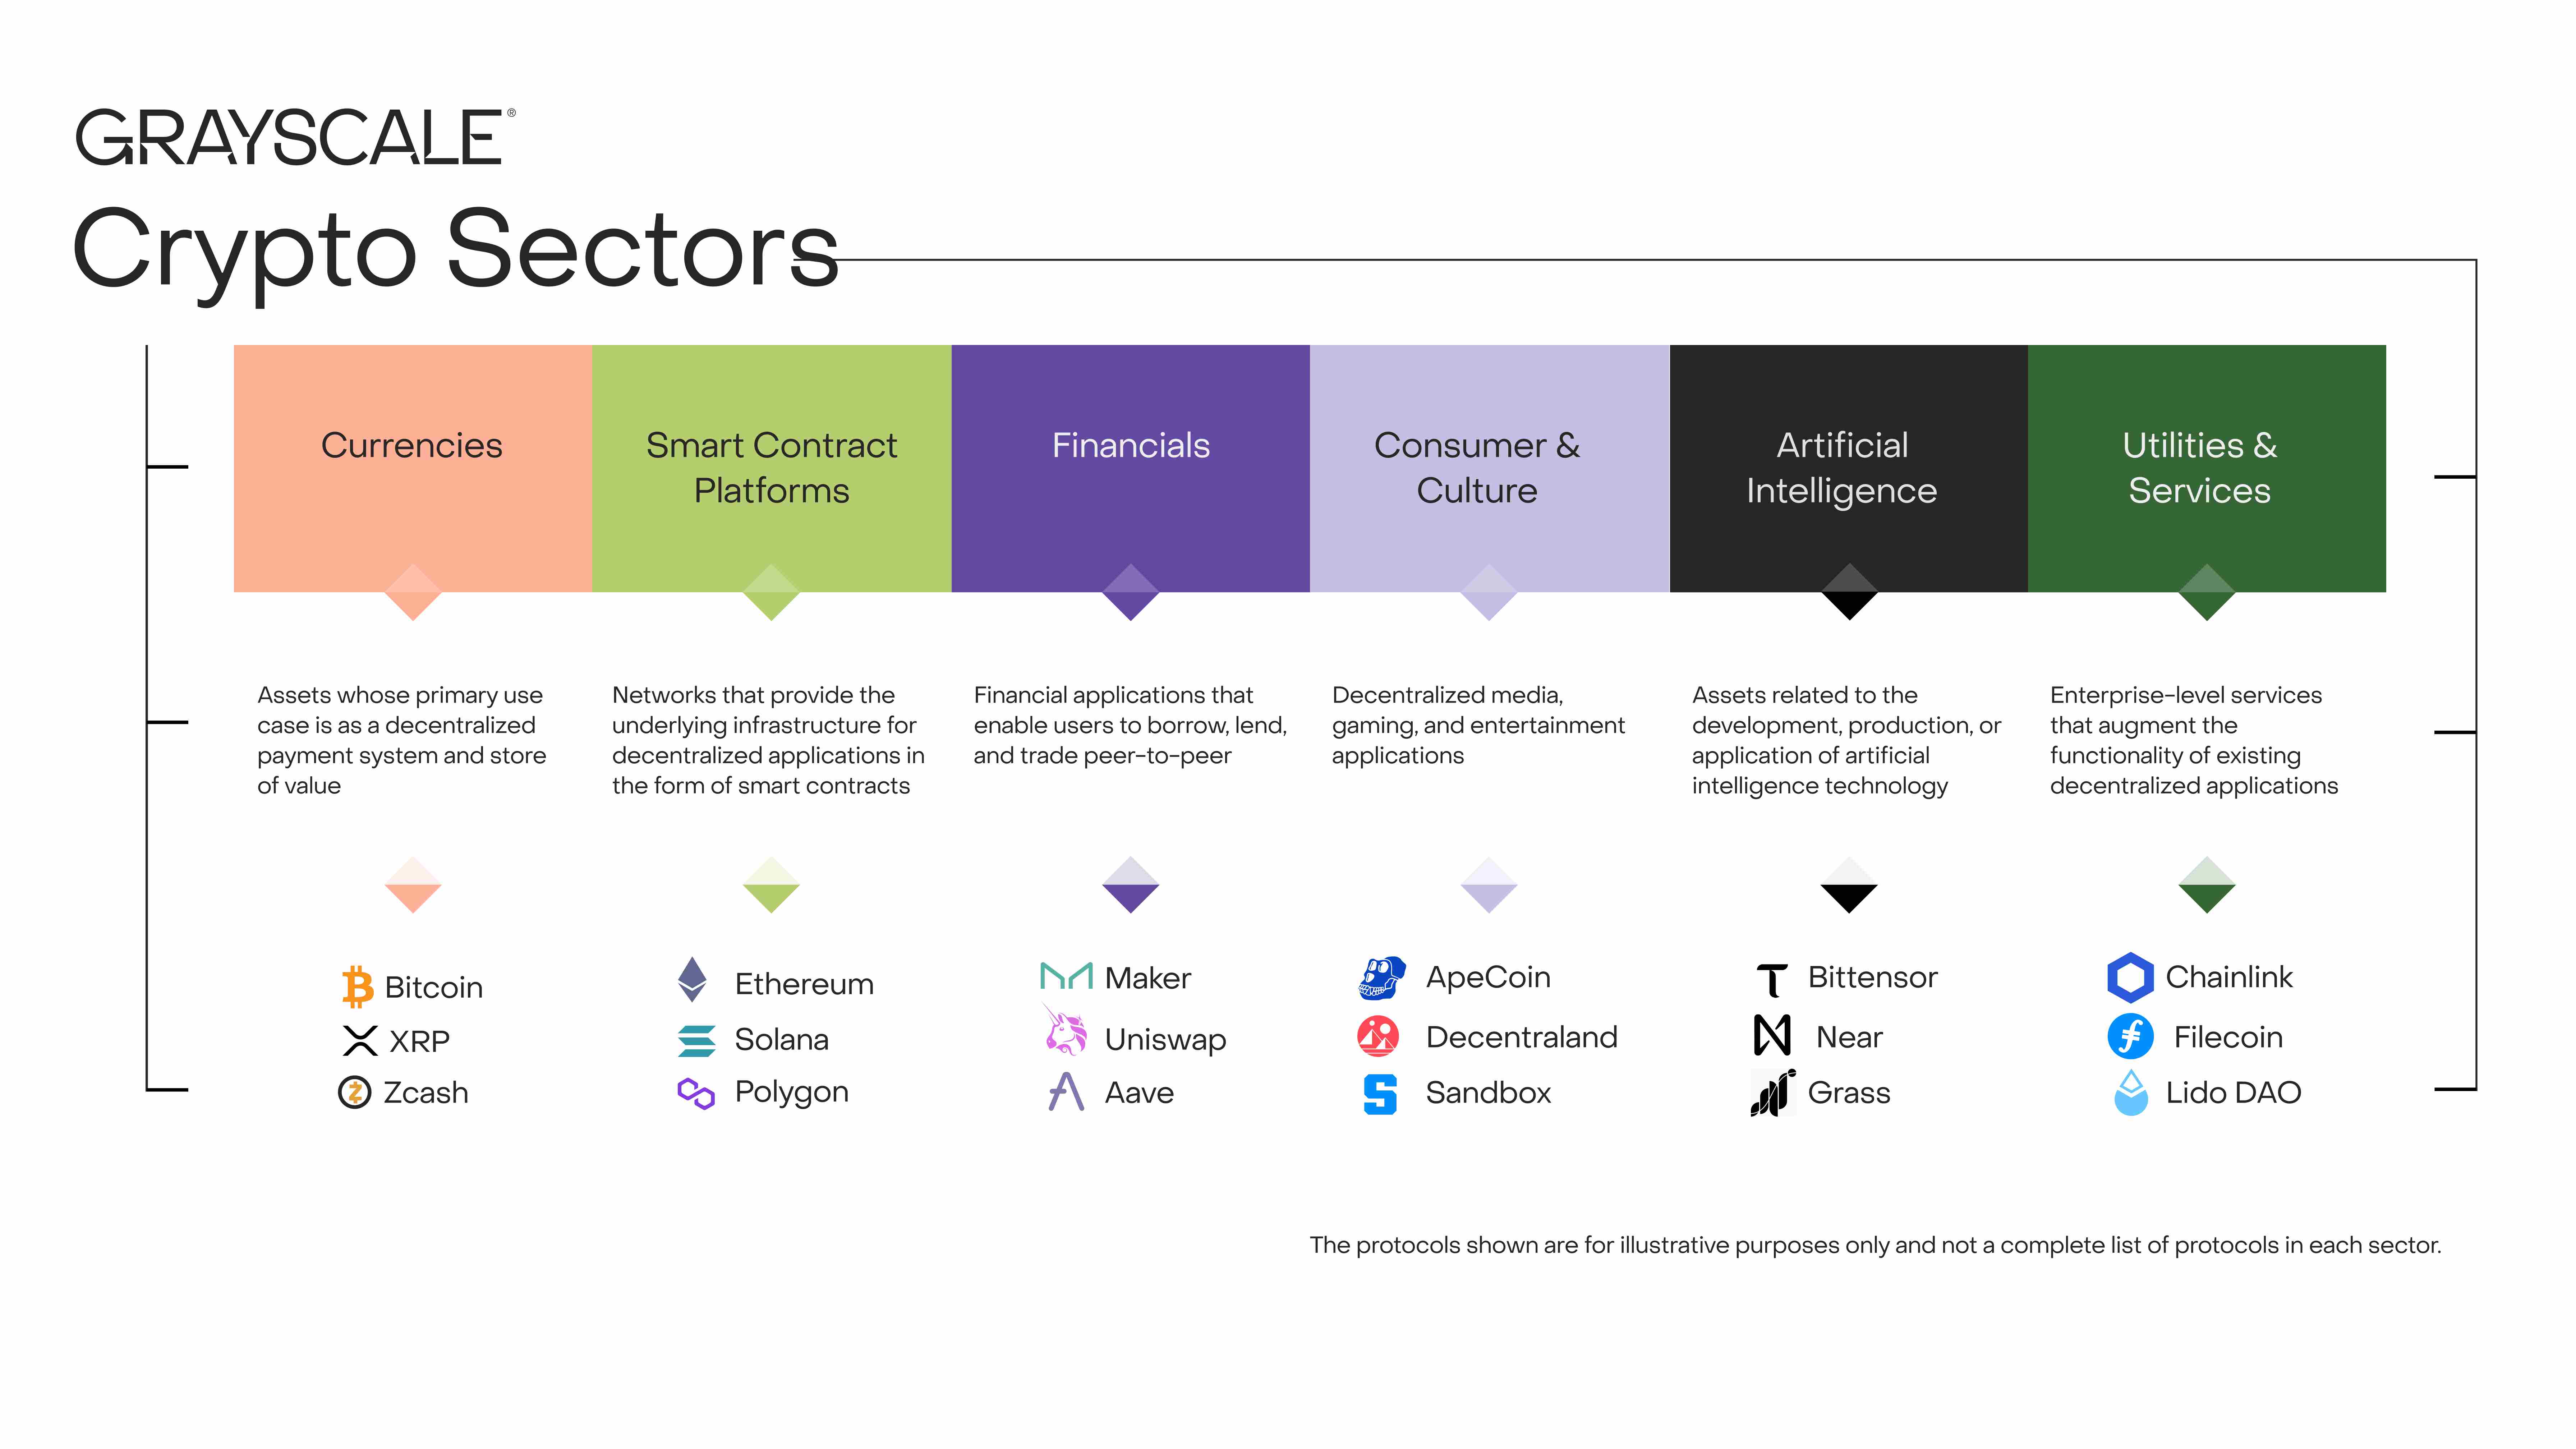
Chart 1: The Crypto Sectors framework helps organize the digital asset market
Measuring Blockchain Fundamentals
While blockchains are not companies, their economic activity and financial health can be measured in similar ways. Three key metrics for on-chain activity are users, transaction volume, and fees. Because blockchains are anonymous, analysts often use "active addresses" (blockchain addresses that have conducted at least one transaction) as an imperfect proxy for user count.
In Q3, fundamental indicators of blockchain health were mixed (Chart 2). On the downside, user counts, transaction volumes, and fees declined quarter-over-quarter in both the Currency and Smart Contract Platforms crypto sectors. Overall, speculative activity linked to Memecoins has decreased since Q1 2025, contributing to lower transaction volumes and activity.
Encouragingly, application-level fees on blockchains rose 28% quarter-over-quarter. This growth was driven by fee revenues from a few leading applications: (i) Jupiter, a Solana-based decentralized exchange; (ii) Aave, a leading lending protocol in crypto; and (iii) Hyperliquid, a leading perpetual futures exchange. On an annualized basis, application-layer fee revenue now exceeds $10 billion. Blockchains serve both as networks for digital transactions and as platforms for applications. Thus, higher application fees can be seen as a sign of increasing adoption of blockchain technology.
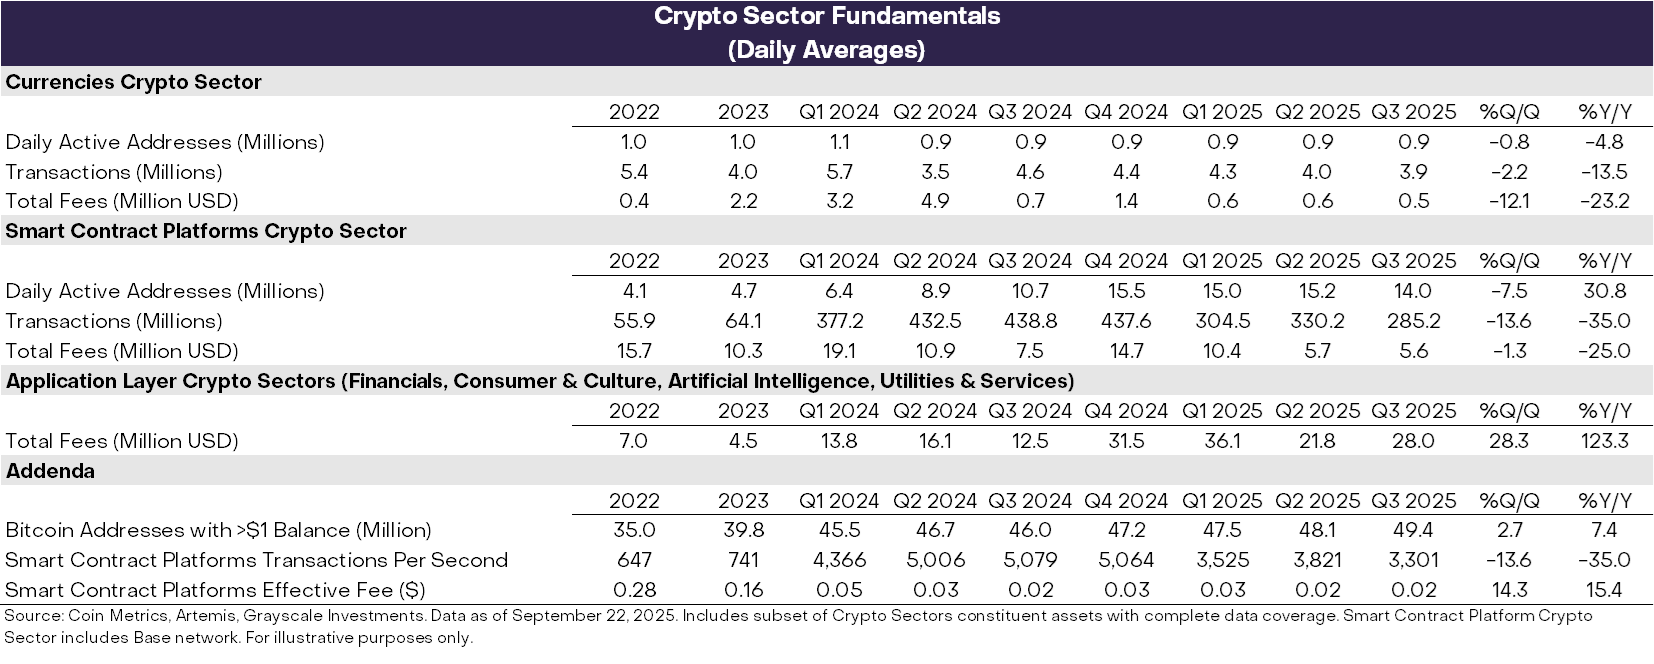
Chart 2: Fundamental performance varied across crypto sectors in Q3 2025
Tracking Price Performance
In Q2 2025, all six crypto sectors delivered positive returns (Chart 3). Bitcoin underperformed relative to other segments—a return pattern that could be viewed as a crypto "alt season"—though different from previous periods when Bitcoin's dominance declined.[2] The Financials crypto sector led gains, driven by rising centralized exchange (CEX) trading volumes, while the Smart Contract Platforms crypto sector may have benefited from stablecoin legislation and adoption (smart contract platforms are the networks where users transact with stablecoins for peer-to-peer payments). While all crypto sectors posted positive returns, the AI crypto sector lagged behind others, reflecting a period of weak returns in AI equities. The Currencies crypto sector also underperformed, reflecting Bitcoin’s relatively modest price appreciation.
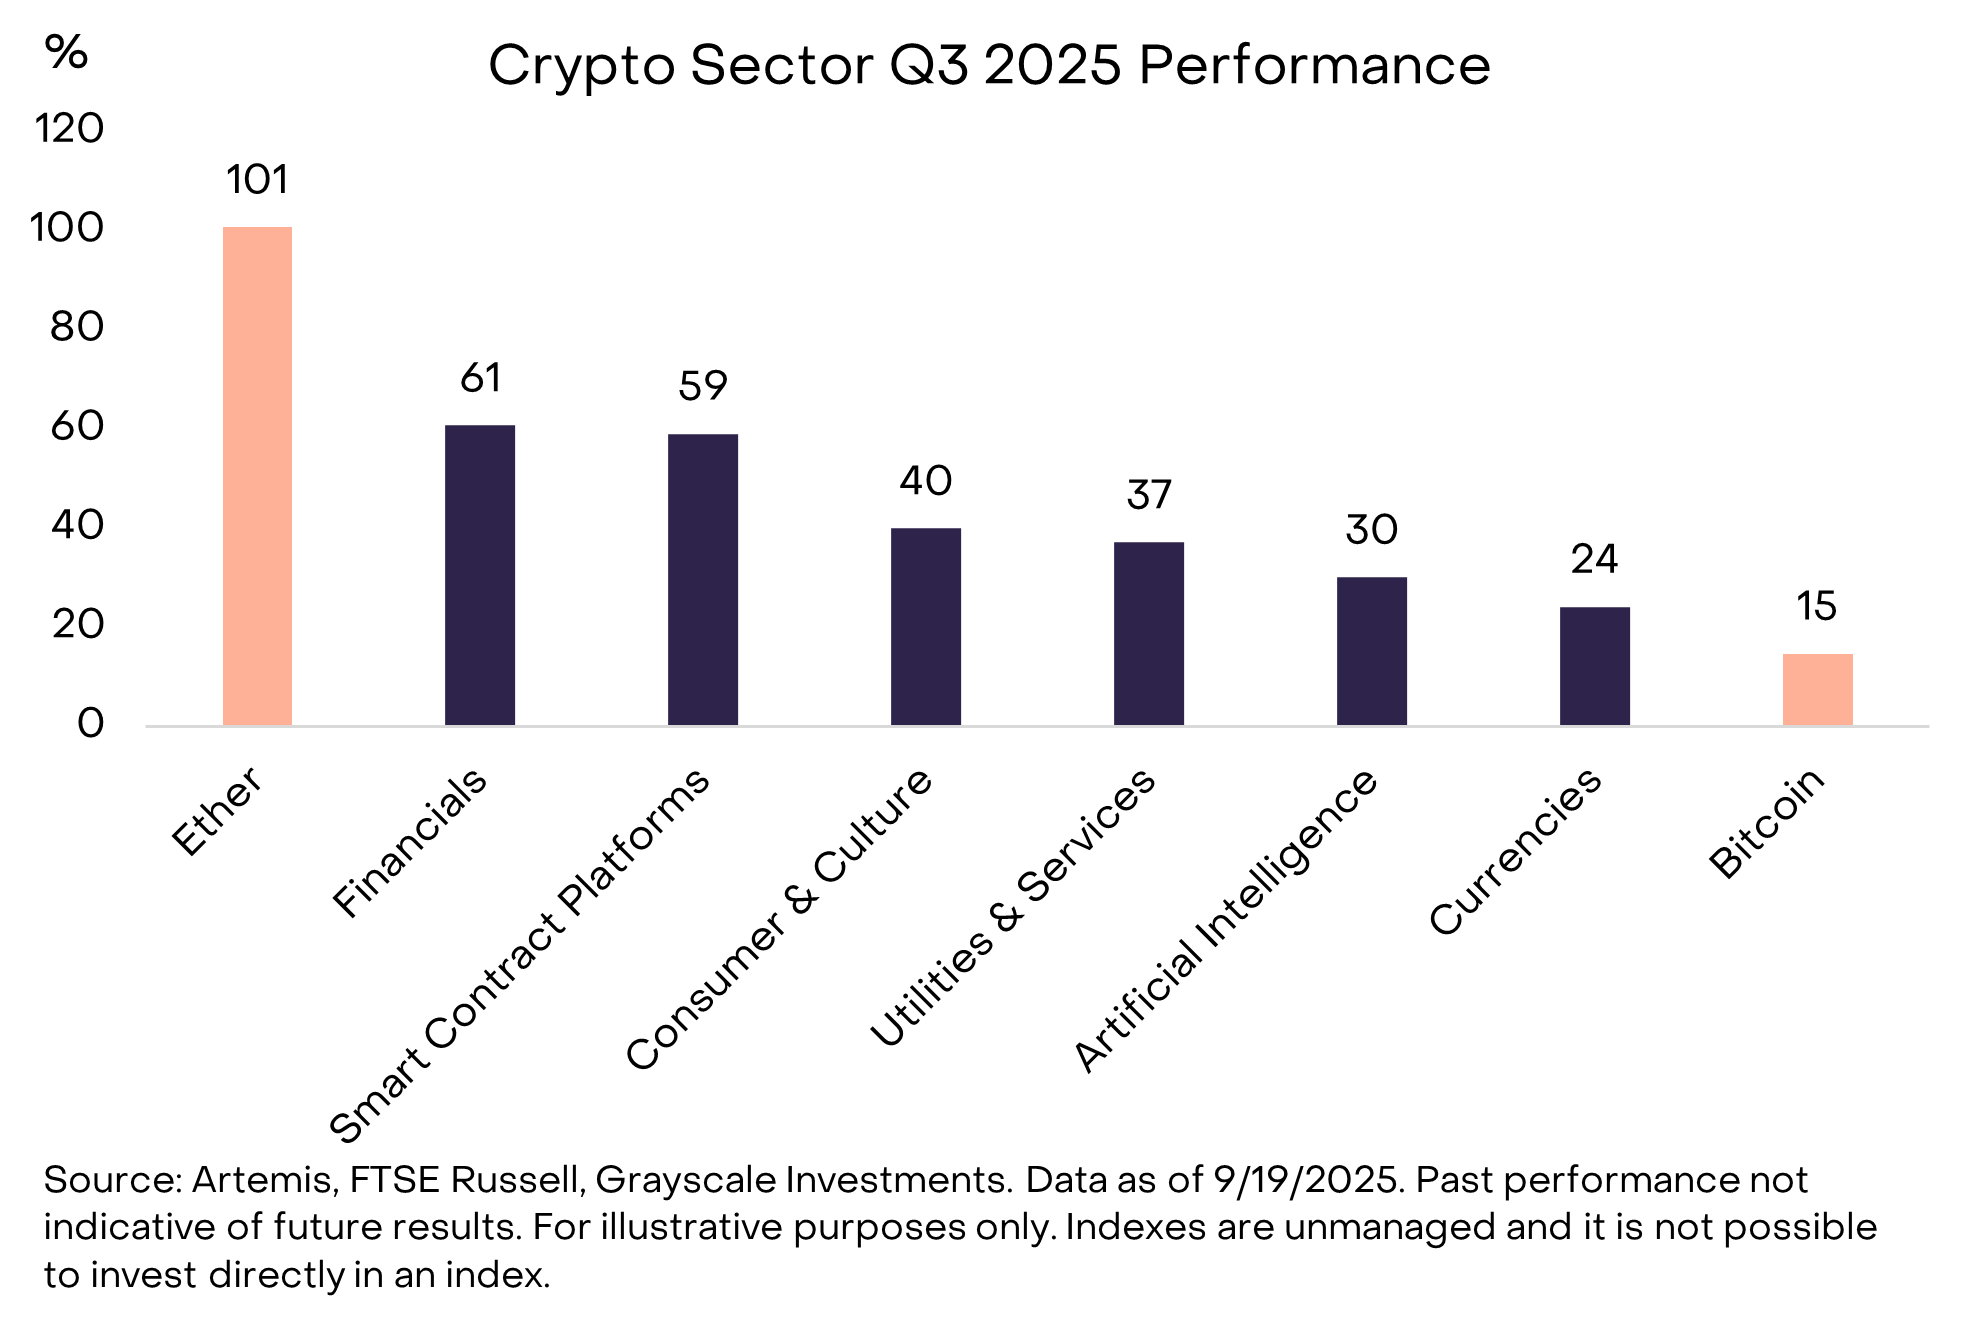
Chart 3: Bitcoin underperformed other crypto markets
The diversity within the crypto asset class means dominant themes and market leadership frequently shift. Chart 3 shows the top 20 index-eligible tokens ranked by volatility-adjusted price returns in Q3 2025.[3] The list includes several large-cap tokens with market caps exceeding $10 billion—ETH, BNB, SOL, LINK, and AVAX—as well as tokens with market caps below $500 million. Financials crypto assets (seven tokens) and Smart Contract Platforms crypto assets (five tokens) had the largest representation among the top 20 this quarter.
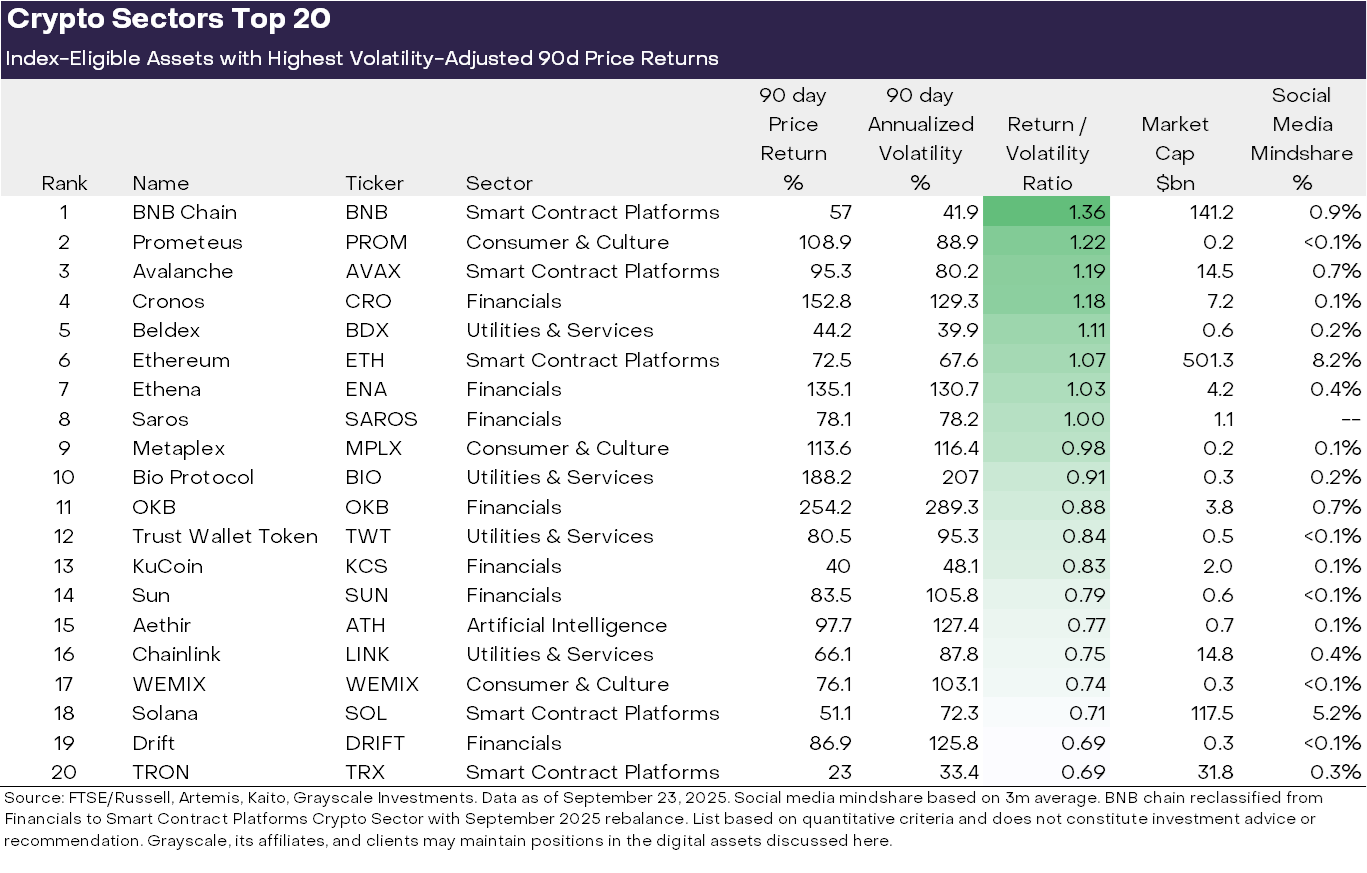
Chart 4: Top-performing crypto assets based on risk-adjusted returns
We identify three key themes behind recent market performance:
(1) Digital Asset Treasuries (DATs): Last quarter saw a surge in DATs—public companies holding crypto on their balance sheets as investment vehicles for equity investors. Several tokens in the top 20 may have benefited from new DAT formations, including ETH, SOL, BNB, ENA, and CRO.
(2) Stablecoin Adoption: Another major theme last quarter was stablecoin legislation and adoption. On July 18, President Trump signed the GENIUS Act, a new bill providing a comprehensive regulatory framework for stablecoins in the U.S. (see our report Stablecoins and the Future of Payments). Following its passage, stablecoin adoption accelerated, with circulating supply growing 16% to over $290 billion (Chart 4).[4] Primary beneficiaries were smart contract platforms hosting custodial stablecoins, including ETH, TRX, and AVAX—where AVAX saw particularly strong growth in stablecoin transaction volume. Stablecoin issuer Ethena (ENA) also achieved strong price returns, despite its USDe stablecoin not meeting GENIUS Act requirements (USDe remains widely used in decentralized finance, though Ethena has launched a new GENIUS-compliant stablecoin).[5]
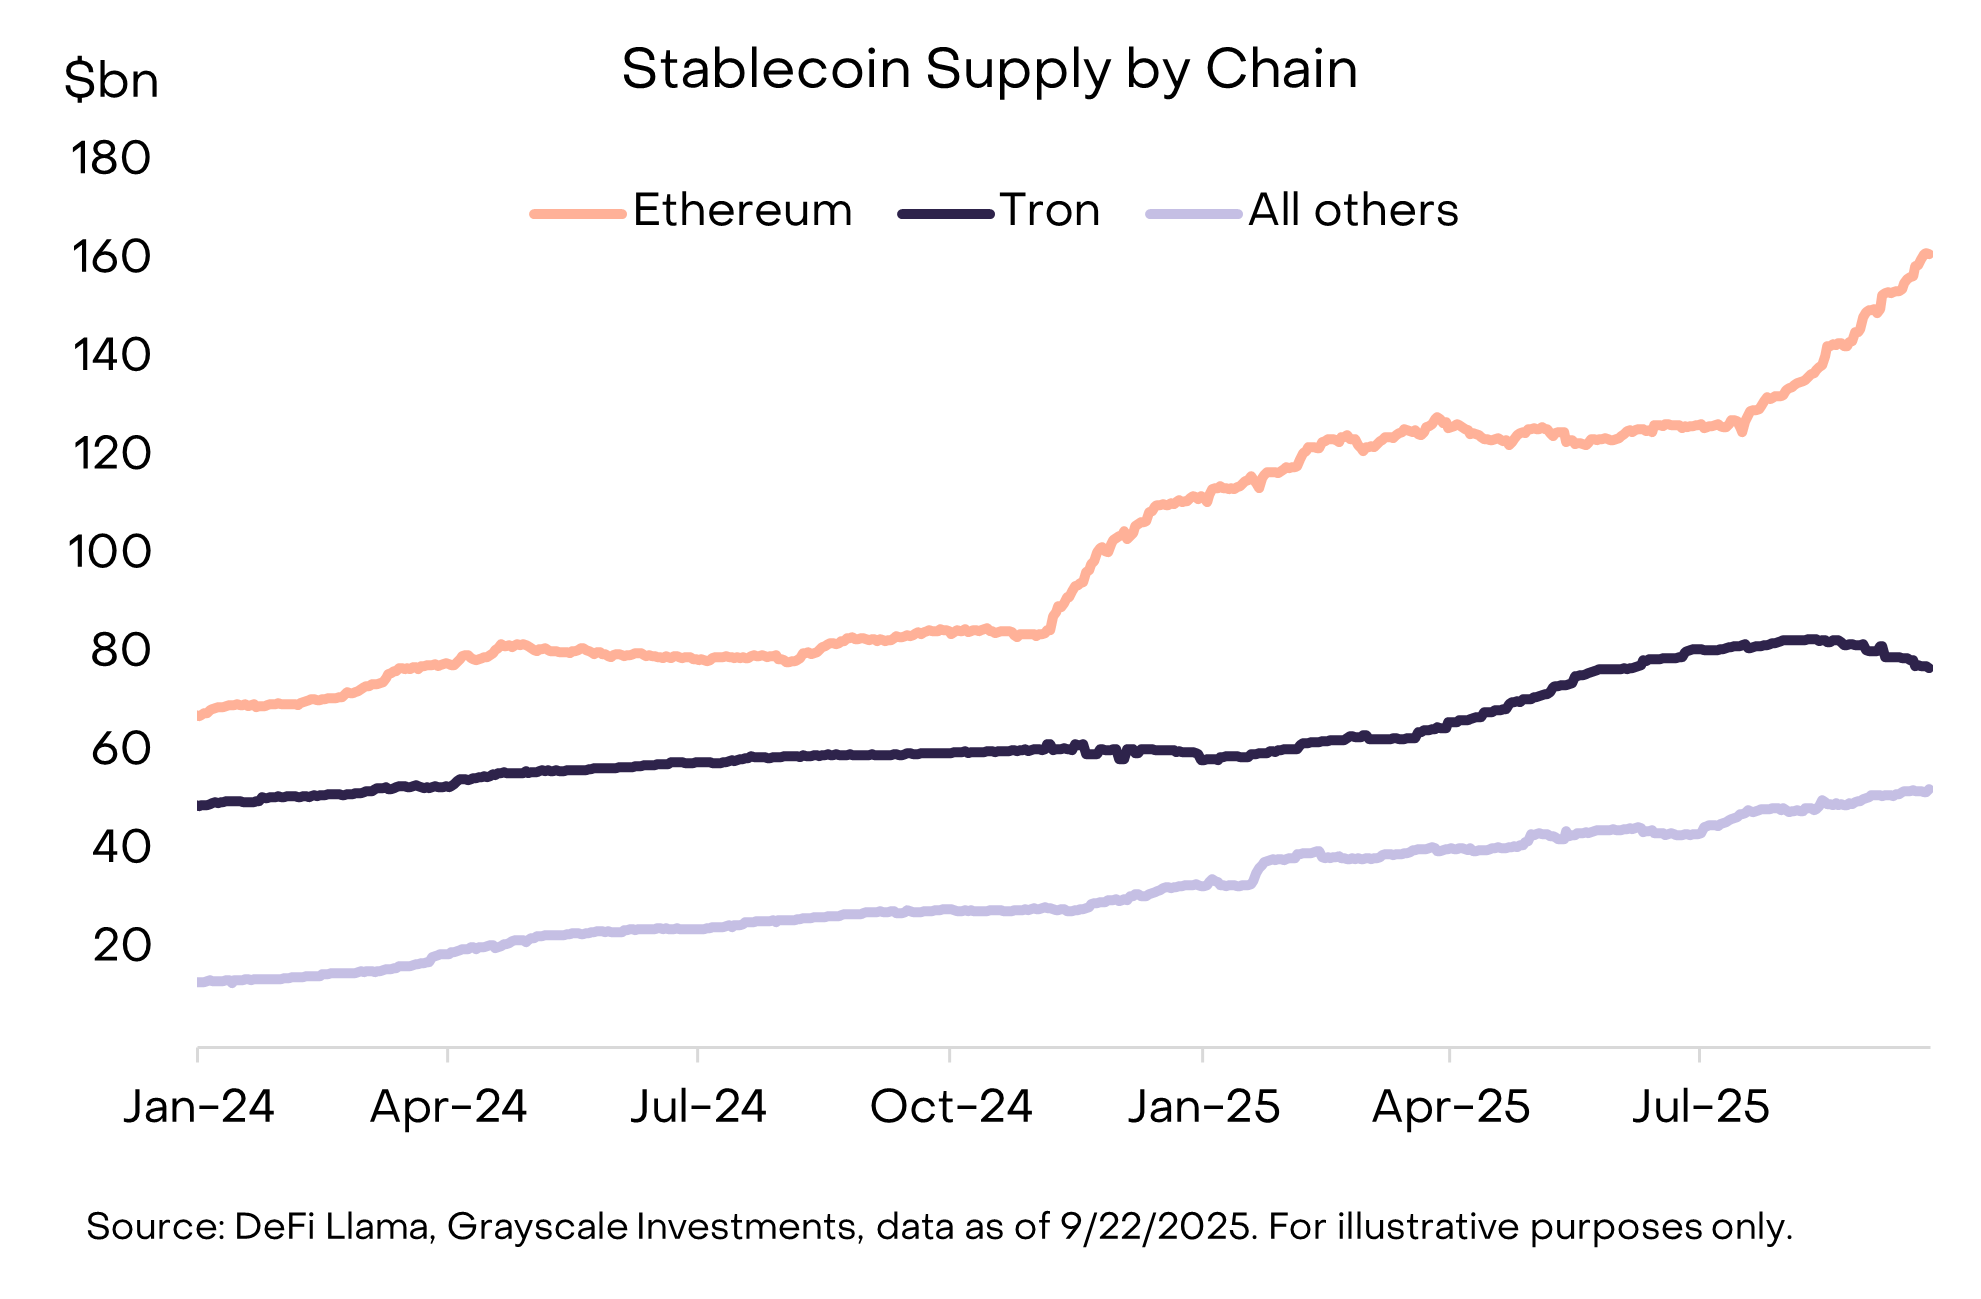
Chart 5: Stablecoin supply grew this quarter, led by Ethereum
(3) Rising Exchange Volumes: Exchanges were another major theme, with August seeing centralized exchange (CEX) trading volumes hit their highest level since January (Chart 5).[6] Increased volumes appear to have benefited several assets tied to centralized exchanges, including BNB, CRO, OKB, and KCS—all of which made the top 20 list (in some cases, these assets are also linked to smart contract platforms).[7]
Meanwhile, decentralized perpetual contracts continued strong momentum (for background, see DEX Appeal: The Rise of Decentralized Exchanges). Leading perpetual exchange Hyperliquid grew rapidly, ranking among the top three in fee revenue this quarter.[8] Smaller competitor DRIFT entered the top 20 after a sharp rise in trading volume.[9] Another decentralized perpetual protocol, ASTER, launched in mid-September and grew from a $145 million market cap to $3.4 billion in just one week.[10]
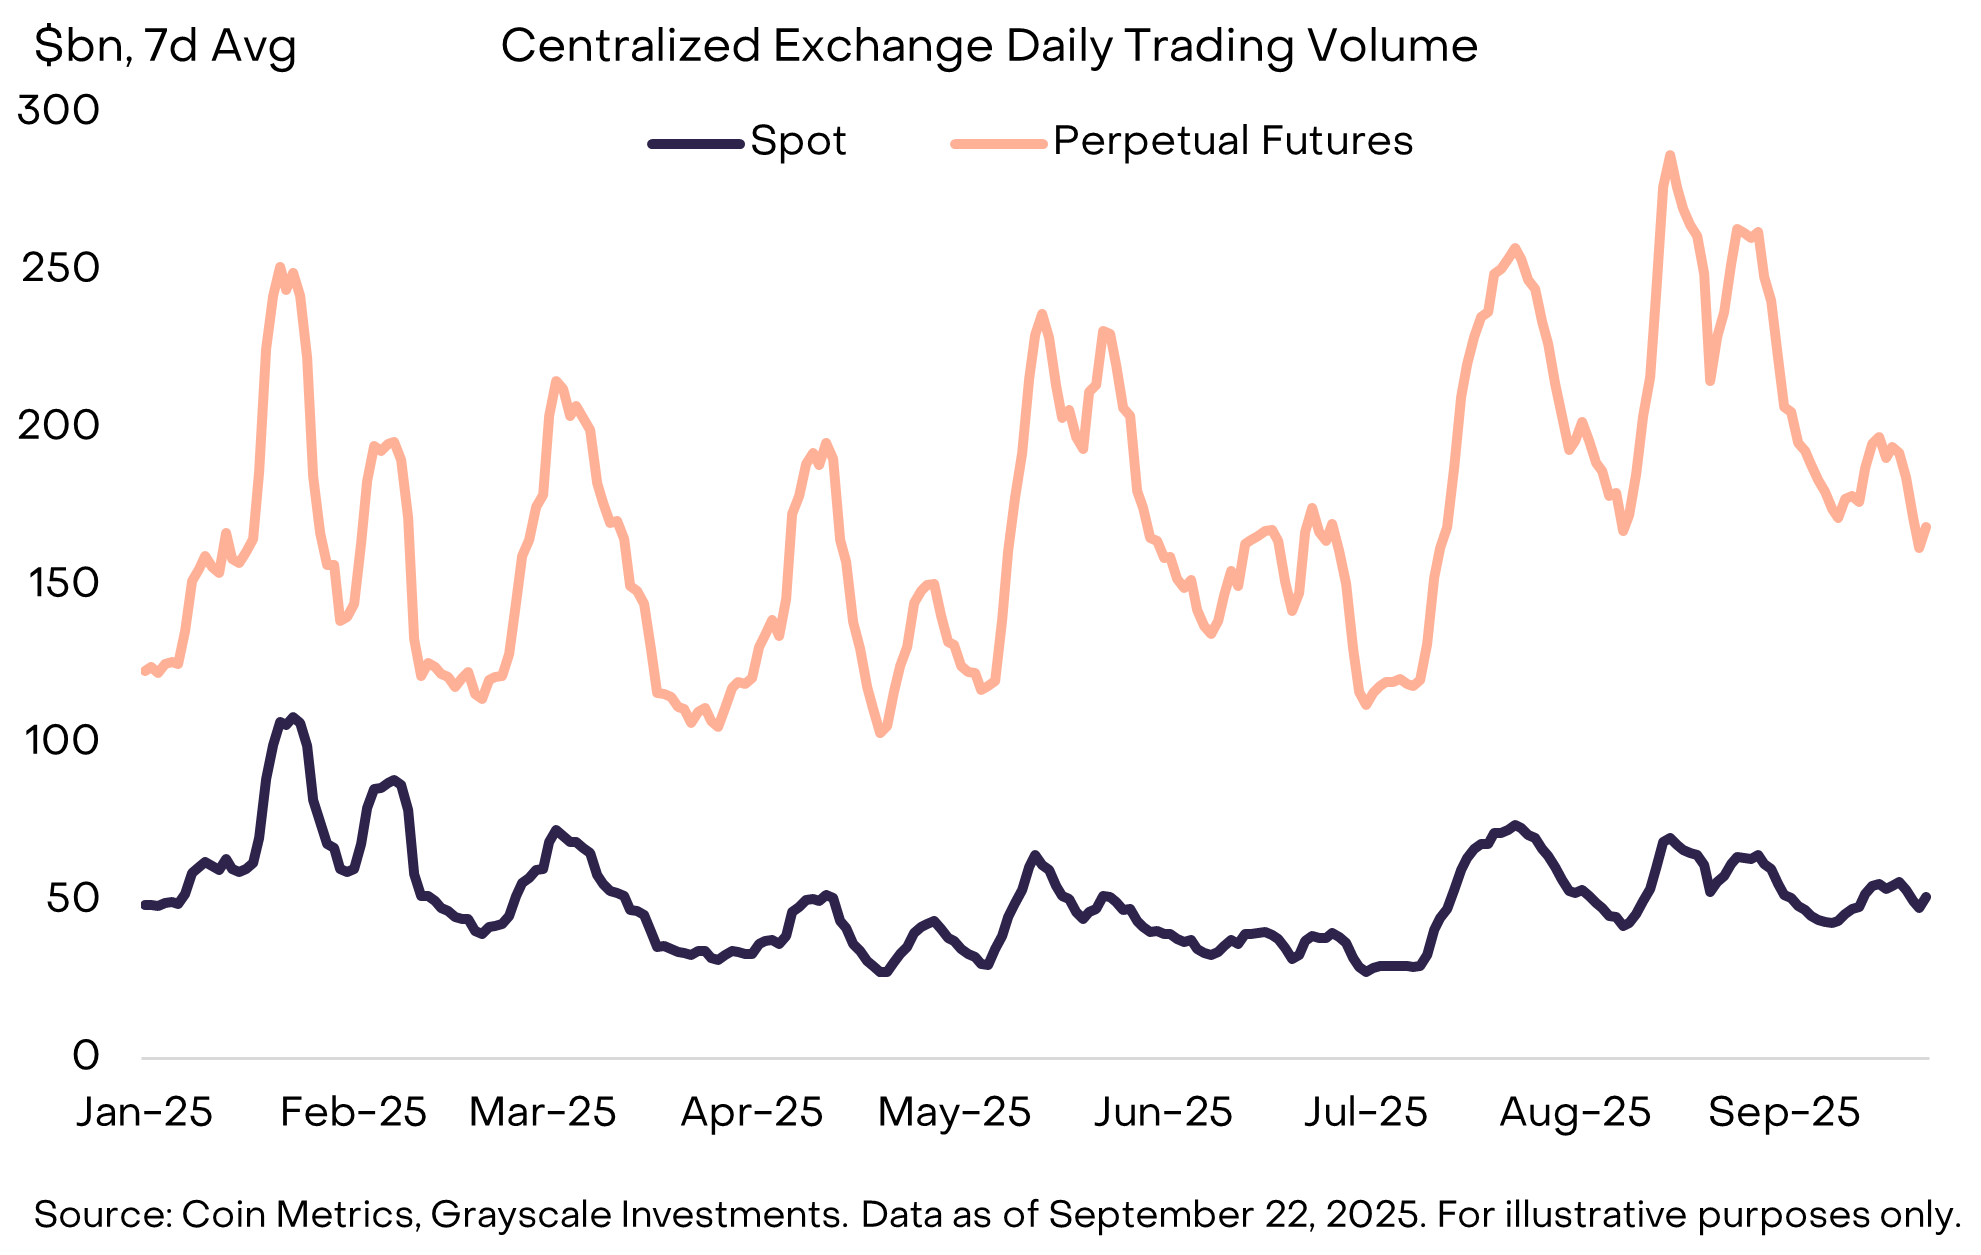
Chart 6: CEX perpetual contract volumes reached annual highs in August
In Q4, returns across crypto sectors may be driven by a new set of themes. First, following bipartisan House approval of related legislation in July, Senate committees have begun drafting cryptocurrency market structure legislation. This represents comprehensive financial services legislation targeting the crypto industry and could catalyze deeper integration with traditional financial services. Second, the U.S. Securities and Exchange Commission (SEC) has approved generic listing standards for commodity-based exchange-traded products (ETPs).[11] This could increase the number of crypto assets available to U.S. investors via ETP structures.
Finally, the macro environment may continue evolving. Last week, the Federal Reserve approved a 25-basis-point rate cut and signaled two additional cuts later this year. All else equal, crypto assets are expected to benefit from Fed rate cuts (as lower rates reduce the opportunity cost of holding non-yielding currencies and support investor risk appetite). At the same time, a weakening U.S. labor market, elevated stock valuations, and geopolitical uncertainty could pose downside risks in Q4.
Index Definitions:
-
FTSE/Grayscale Crypto Sectors Total Market Index: Measures price return performance of digital assets listed on major global exchanges, providing a benchmark for overall crypto market trends.
-
FTSE Grayscale Smart Contract Platforms Crypto Sector Index: Designed to evaluate the performance of crypto assets that support the development and deployment of smart contracts, serving as foundational platforms for self-executing agreements.
-
FTSE Grayscale Utilities and Services Crypto Sector Index: Focuses on measuring the performance of crypto assets aimed at delivering practical applications and enterprise-grade functionalities.
-
FTSE Grayscale Consumer and Culture Crypto Sector Index: Assesses the performance of crypto assets supporting consumer-centric activities across various goods and services.
-
FTSE Grayscale Currencies Crypto Sector Index: Measures the performance of crypto assets fulfilling one of three core functions: store of value, medium of exchange, or unit of account.
-
FTSE Grayscale Financials Crypto Sector Index: Specifically evaluates the performance of crypto assets designed to provide financial transactions and services.
[1] Source: Artemis, Grayscale Investments. Data as of September 23, 2025.
[2] Altcoins are crypto assets with market capitalizations smaller than Bitcoin.
[3] To qualify for inclusion in Crypto Sectors, a token must be listed on a minimum number of qualified exchanges and meet minimum market cap and liquidity thresholds.
[4] DeFiLlama, data as of September 22, 2025.
[6] The Block, data as of September 22, 2025.
[7] Some exchange tokens also benefited from unique factors. For example, OKX announced a token buyback and burn program, destroying $2.6 billion worth of tokens. Source: The Block.
[8] Artemis, data as of September 22, 2025.
[10] CoinMarketCap, data as of September 23, 2025. ASTER launched too late to be included in the Crypto Sectors indices.
Join TechFlow official community to stay tuned
Telegram:https://t.me/TechFlowDaily
X (Twitter):https://x.com/TechFlowPost
X (Twitter) EN:https://x.com/BlockFlow_News