Bitcoin key support at $115,200, historic highest options expiry approaching
TechFlow Selected TechFlow Selected
Bitcoin key support at $115,200, historic highest options expiry approaching
Open interest in options reached a record 500,000 bitcoins ahead of the September 26 expiry, with holding above $115,200 key, while a break below that level could lead to a drop toward $105,500.
Writing: CryptoVizArt, Chris Beamish, Antoine Colpaert
Translation: AididiaoJP, Foresight News
Bitcoin traded above $115,200 following the Federal Open Market Committee meeting rebound, with 95% of supply in profit. Futures markets indicate a short squeeze, while options open interest reached a record 500,000 bitcoins ahead of the September 26 expiry. Holding above $115,200 is critical, while a breakdown below this level could lead to a drop toward $105,500.
Summary
-
Bitcoin showed mild upward momentum ahead of the FOMC meeting on September 17. Derivatives markets have shifted from a risk-off stance to more balanced positioning, easing downside concerns after the FOMC decision. Spot markets show mild selling pressure, while perpetual contracts harvested liquidity via a short squeeze.
-
Perpetual contract open interest peaked at 395,000 bitcoins before falling back to around 380,000 bitcoins due to leveraged trader liquidations amid volatility. The liquidation pattern confirms shorts were squeezed ahead of the FOMC meeting, followed by long liquidations during the post-rate-decision pullback.
-
Options open interest reached a record 500,000 bitcoins, making the September 26 expiry the largest settlement in history. Expiry flows centered around the $110,000 max pain level could strongly impact spot prices.
-
Volatility repricing ahead of the FOMC meeting widened the spread between 1-month implied volatility (IV) and realized volatility (RV). Market makers' positioning suggests hedging flows can sustain upside momentum and cushion downside moves.
-
On-chain, Bitcoin trades above the cost basis of 95% of supply ($115,200). Defending this level is crucial to maintaining bullish momentum, while losing it may trigger a move toward $105,500.
Since early September, the Bitcoin market has shown mild upward momentum, driven by expectations of FOMC rate cuts and optimism about their potential impact.
This article examines market dynamics in the days leading up to the meeting, as well as the structure of perpetual and options markets following the rate decision. Finally, we turn to on-chain indicators to assess the broader macro cycle and determine whether the foundation for a sustained trend is forming.
Perpetual Market Analysis
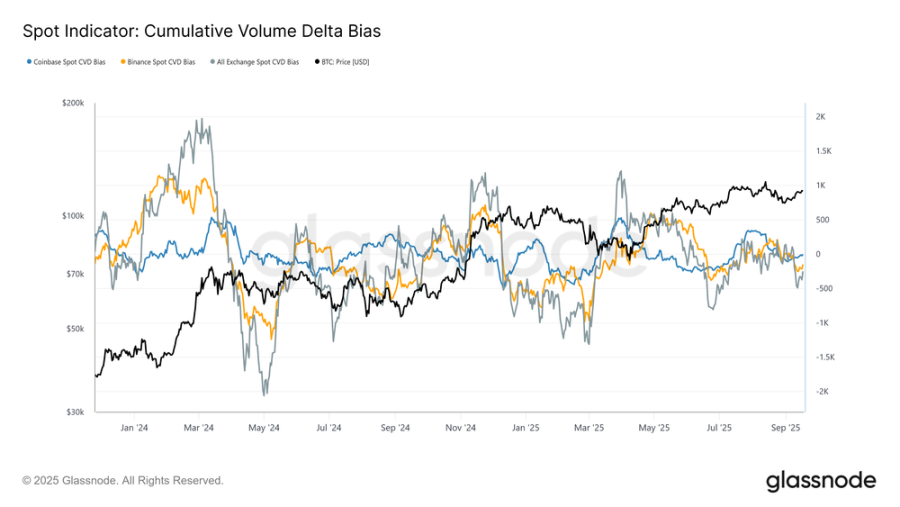
Throughout September, Bitcoin stabilized near $107,800, aligning with the short-term holder cost basis. From this level, market structure shifted from balanced to slightly seller-driven. This bias is captured by the deviation of Cumulative Volume Delta (CVD) from its 90-day median baseline.
In the days preceding the FOMC meeting, CVD across Coinbase, Binance, and all major exchanges showed mild negative deviations, highlighting net selling pressure in the spot market and participant caution.
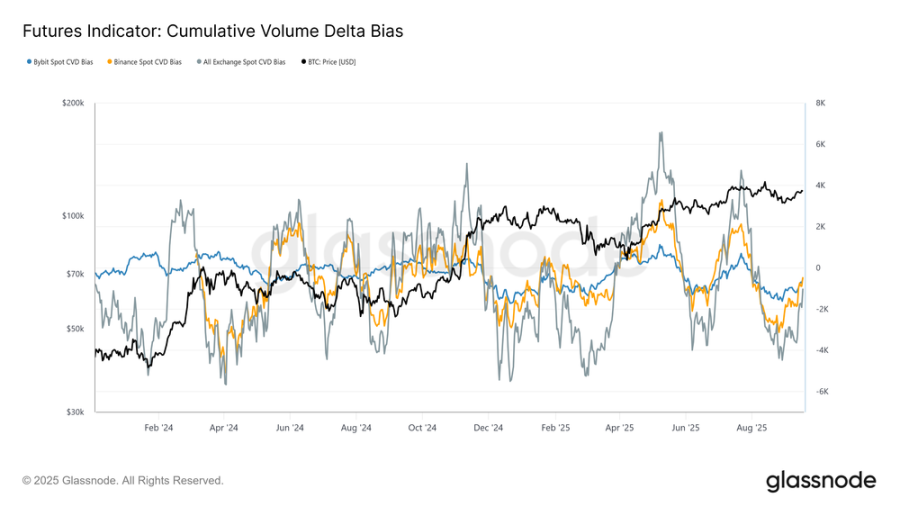
Extending this view to perpetual markets, CVD bias shows a notable shift from extreme selling to nearly balanced conditions. This reflects a significant return of liquidity, as buy-side flows offset persistent selling pressure from late August through the FOMC period.
This stability underscores the central role of futures in supporting the rebound, with speculators positioning ahead of rate cuts and anticipating favorable policy outcomes.
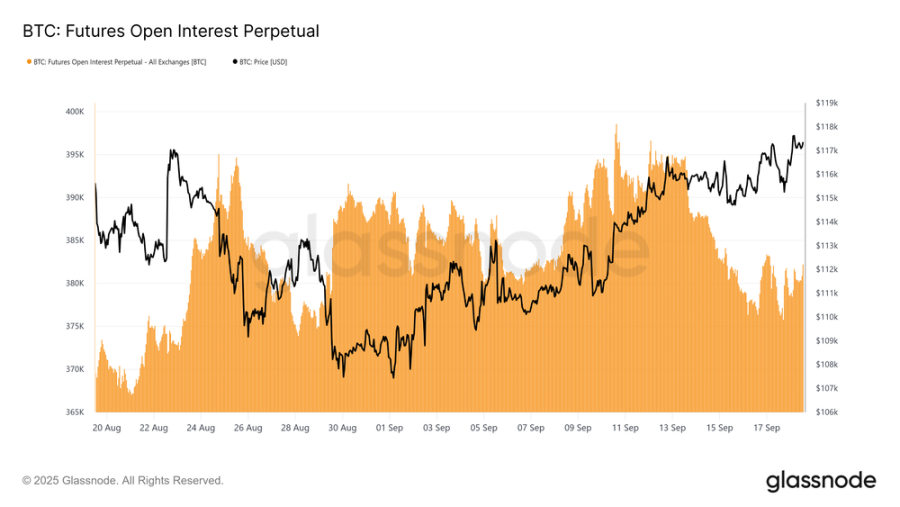
Perpetual Contract Open Interest
Given the significant role of futures in current market dynamics, perpetual contract metrics offer a clearer lens into short-term sentiment.
Perpetual contract open interest (OI) climbed to a cycle high of approximately 395,000 bitcoins on September 13. However, by Monday, September 16, choppy price action pushed OI down to 378,000 bitcoins, a decline of about 4.3%.
Since the FOMC meeting, OI has stabilized between 378,000 and 384,000 bitcoins. This pattern aligns with increased intraday volatility and leveraged traders being liquidated around key macro events, highlighting heightened sensitivity of futures markets to policy-driven catalysts.
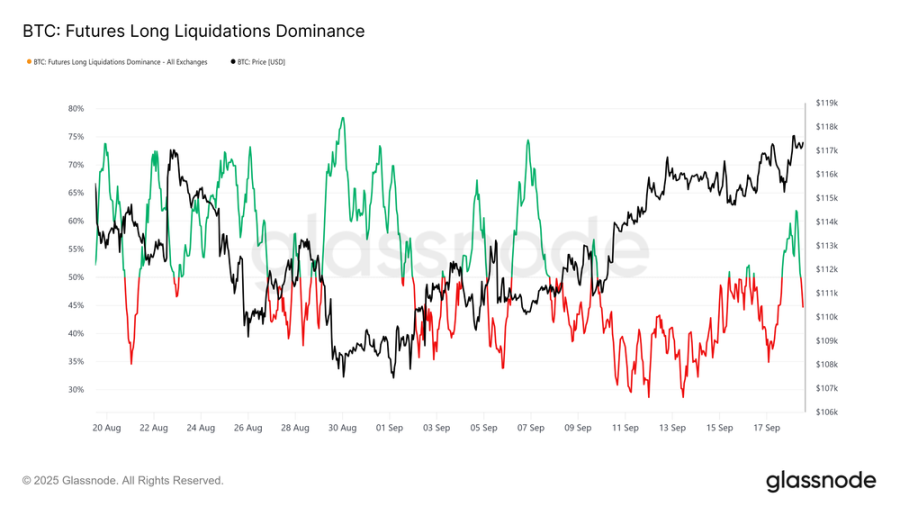
Short Squeeze and Long Liquidation
Examining dominant liquidations over the past 30 days reveals that the decline in open interest between September 13 and 17 was primarily driven by short liquidations. This translated into a series of short squeezes ahead of the FOMC announcement, fueling momentum in perpetual long positions.
However, this state was abruptly interrupted when prices sharply pulled back to $115,000 following the rate cut, triggering a wave of high-leverage long liquidations and pushing the long-liquidation dominance ratio to 62%.
We can simultaneously highlight recent long liquidations and short-term max pain levels. The dashboard metrics serve as proxies for liquidation prices, precisely identifying levels where traders face forced liquidation risk and helping predict potential cascading liquidations. These metrics are built from the 1,000 largest Bitcoin positions on Hyperliquid, providing a highly relevant proxy for broader market positioning.
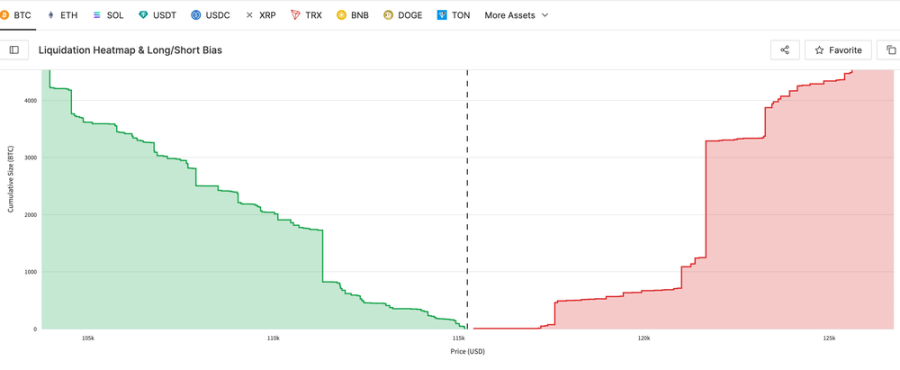
Max Pain
We begin with the liquidation wall to measure the most immediate max pain levels for long and short positions. The latest hourly snapshot highlights potential liquidation "walls": prices below spot indicate long liquidations, while prices above spot indicate short liquidations.
Currently, the long side’s max pain sits at $112,700, while the short side’s max pain is at $121,600, with spot trading at $117,200. This indicates a fragile equilibrium—downward movement could trigger long liquidations, while an upside breakout could spark a short squeeze pushing prices toward recent highs.
Options Market
Turning focus to the options market, we use positioning and expiry data to evaluate short-term volatility expectations.
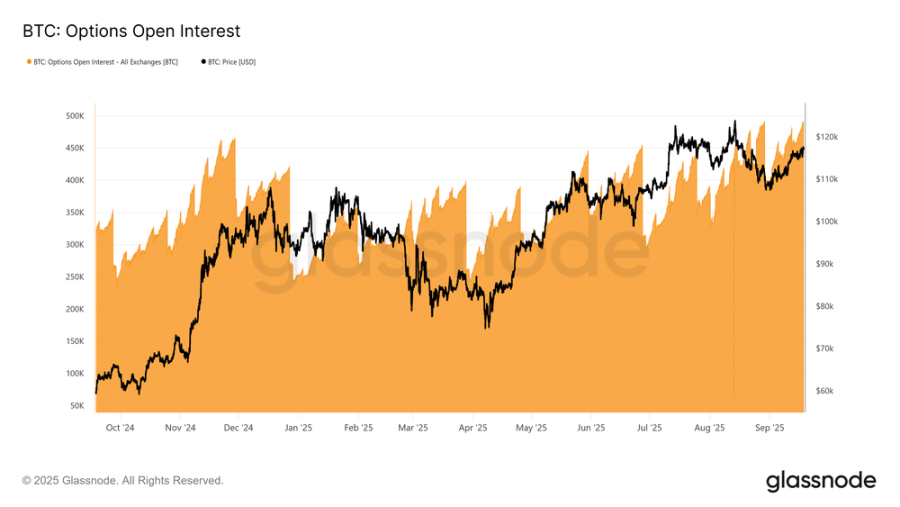
Rising Options OI and Expiry Dynamics
Bitcoin options open interest (OI) has surged to nearly 500,000 bitcoins—a historical high—highlighting growing adoption for hedging and speculation. OI typically declines at month-end, with sharper drops at quarter-end before rebuilding. This reflects the dominance of monthly expiries, while weekly options are listed only 2–3 weeks in advance. Quarterly expiries, often called "quadruple witching," combine weekly, monthly, and quarterly expiries, concentrating flows and liquidity.
While rising OI does not reveal directional bias, it signals greater market maturity as participants deploy complex structures to manage risk. Crucially, as OI peaks near expiry, gamma effects may amplify spot volatility, as market makers hedge more aggressively—increasing the influence of expiry dates on Bitcoin's price trajectory.
Record-Breaking Setup
With rising open interest, the September 26 expiry becomes a pivotal event for the options market.
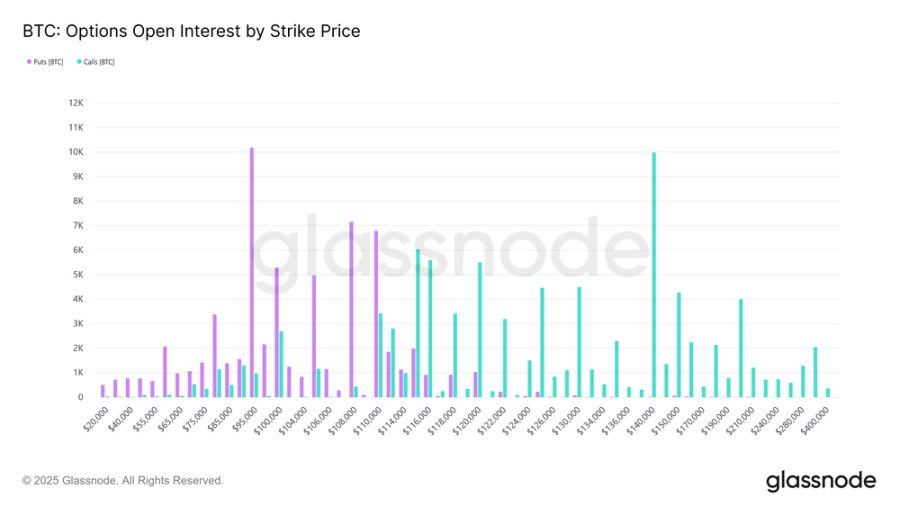
This expiry marks the largest in Bitcoin’s history, reflecting nine months of accumulation since inception. Its strike distribution is unusually broad, with OI concentrated in $95,000 puts on the downside and $140,000 calls on the upside. While these levels are likely to expire out-of-the-money, they highlight speculative or hedging zones traders have targeted throughout the year.
The max pain level is near $110,000—the price at which most options expire worthless—typically exerting gravitational pull ahead of expiry. Given the size of this contract, hedging flows could significantly impact spot prices until the rolling settlement at 8:00 AM UTC on Friday, September 26. Once expired, the market may unleash more volatile price action.
FOMC Repricing
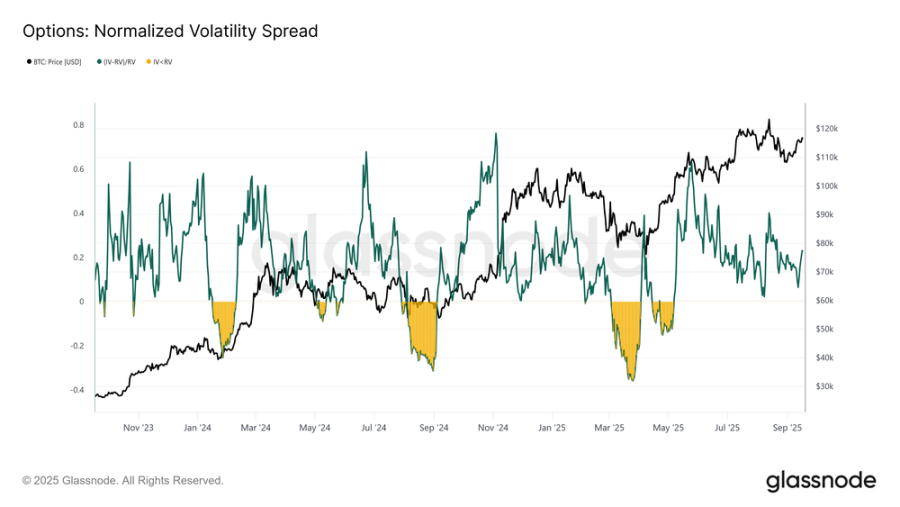
Turning to volatility, normalized 1-month spreads illustrate how options traders positioned ahead of the FOMC meeting.
For much of September, implied volatility (IV) closely tracked realized volatility (RV), but spiked before the event as market makers repriced risk and traders rushed to buy calls. The current spread stands at 0.228—still within normal range but slightly elevated. This reflects additional premium demanded by sellers to absorb risk, offering income opportunities in an otherwise subdued volatility environment.
Monitoring Market Maker Flows
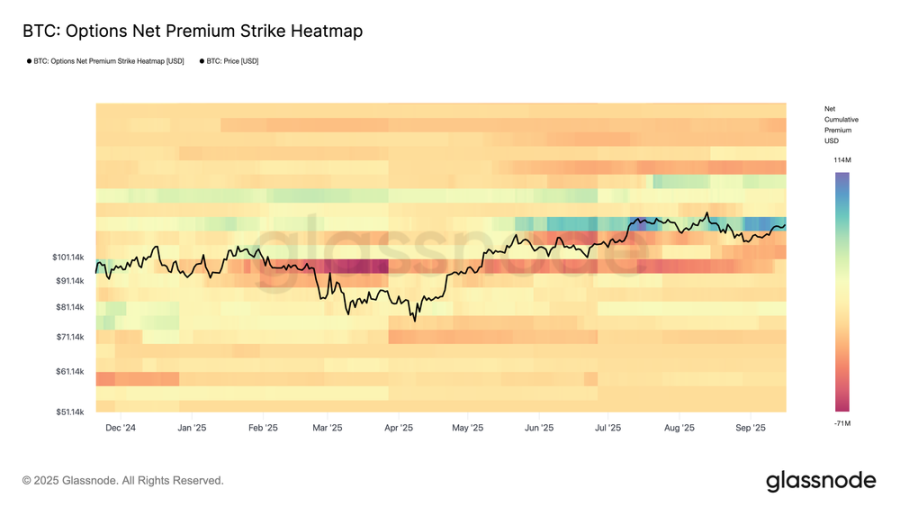
Complementing the volatility spread, the options net premium strike heatmap reveals how traders are positioning across different strikes.
Recent months show persistent put selling below spot and call buying above spot, with recent days seeing intensified demand on the upside. This structure leaves market makers short in the upside and long in the downside, forcing them to buy as prices rise and buy again as prices fall. The resulting flow provides fuel for extended upside moves while cushioning downturns, reinforcing stability around key strike zones.
Using On-Chain Data for Macro Navigation
Having reviewed perpetual and options indicators, we now turn to on-chain metrics to assess the market from a macro and investor behavior perspective.
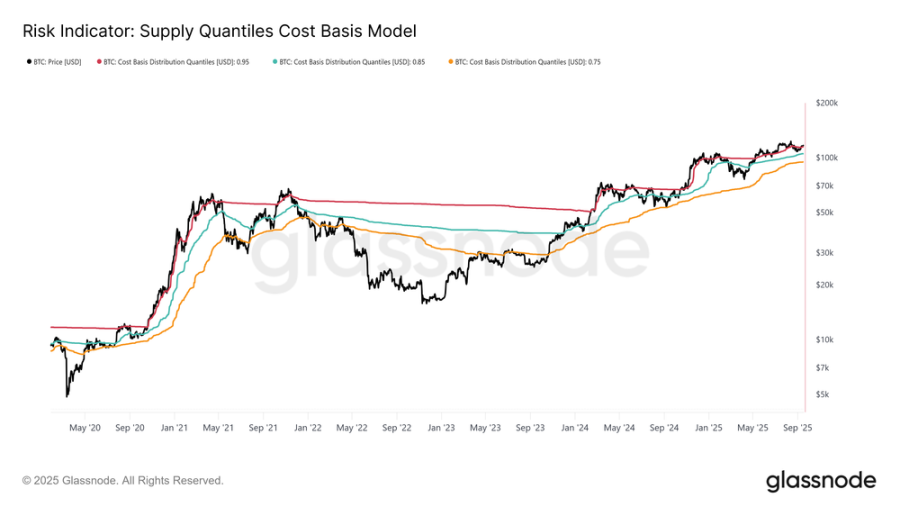
Following the FOMC meeting, Bitcoin rose to $117,200, pushing the majority of supply back into profit. The Supply Quantile Cost Basis model shows the current price is now above the cost basis of 95% of supply ($115,200). Maintaining above this level is critical to sustaining demand-side momentum. Conversely, failure to hold could increase the likelihood of price contraction back into the 85%-95% quantile range of $105,500–$115,200, where weakening conviction and new selling pressure may emerge.
Conclusion
Following the FOMC-driven rebound, the Bitcoin market remains in a delicate balance. In futures markets, net selling pressure in spot is offset by fresh liquidity in perpetuals, with short squeezes and liquidations playing a key role.
The options market highlights record open interest and a historic quarterly expiry, pointing to amplified volatility potential, with market maker flows providing both downside support and upside momentum.
On-chain, Bitcoin trades above the cost basis of 95% of supply, which now serves as a critical dividing line. Holding above $115,200 will sustain demand-driven momentum, while breaking below could lead to a move toward the $105,500–$115,200 range. Altogether, these signals suggest the market awaits confirmation—stability above key cost basis levels could expand upside potential, while fragility in flows keeps downside risks alive.
Join TechFlow official community to stay tuned
Telegram:https://t.me/TechFlowDaily
X (Twitter):https://x.com/TechFlowPost
X (Twitter) EN:https://x.com/BlockFlow_News