Reviewing the Fed's rate cut cycle: where are Bitcoin, stocks, and gold headed?
TechFlow Selected TechFlow Selected
Reviewing the Fed's rate cut cycle: where are Bitcoin, stocks, and gold headed?
If history rhymes, the next 6-12 months could be a critical window.
By David, TechFlow
"Take a break and wait for the Fed's decision before making moves" – these days, such a wait-and-see sentiment is common in investment communities.
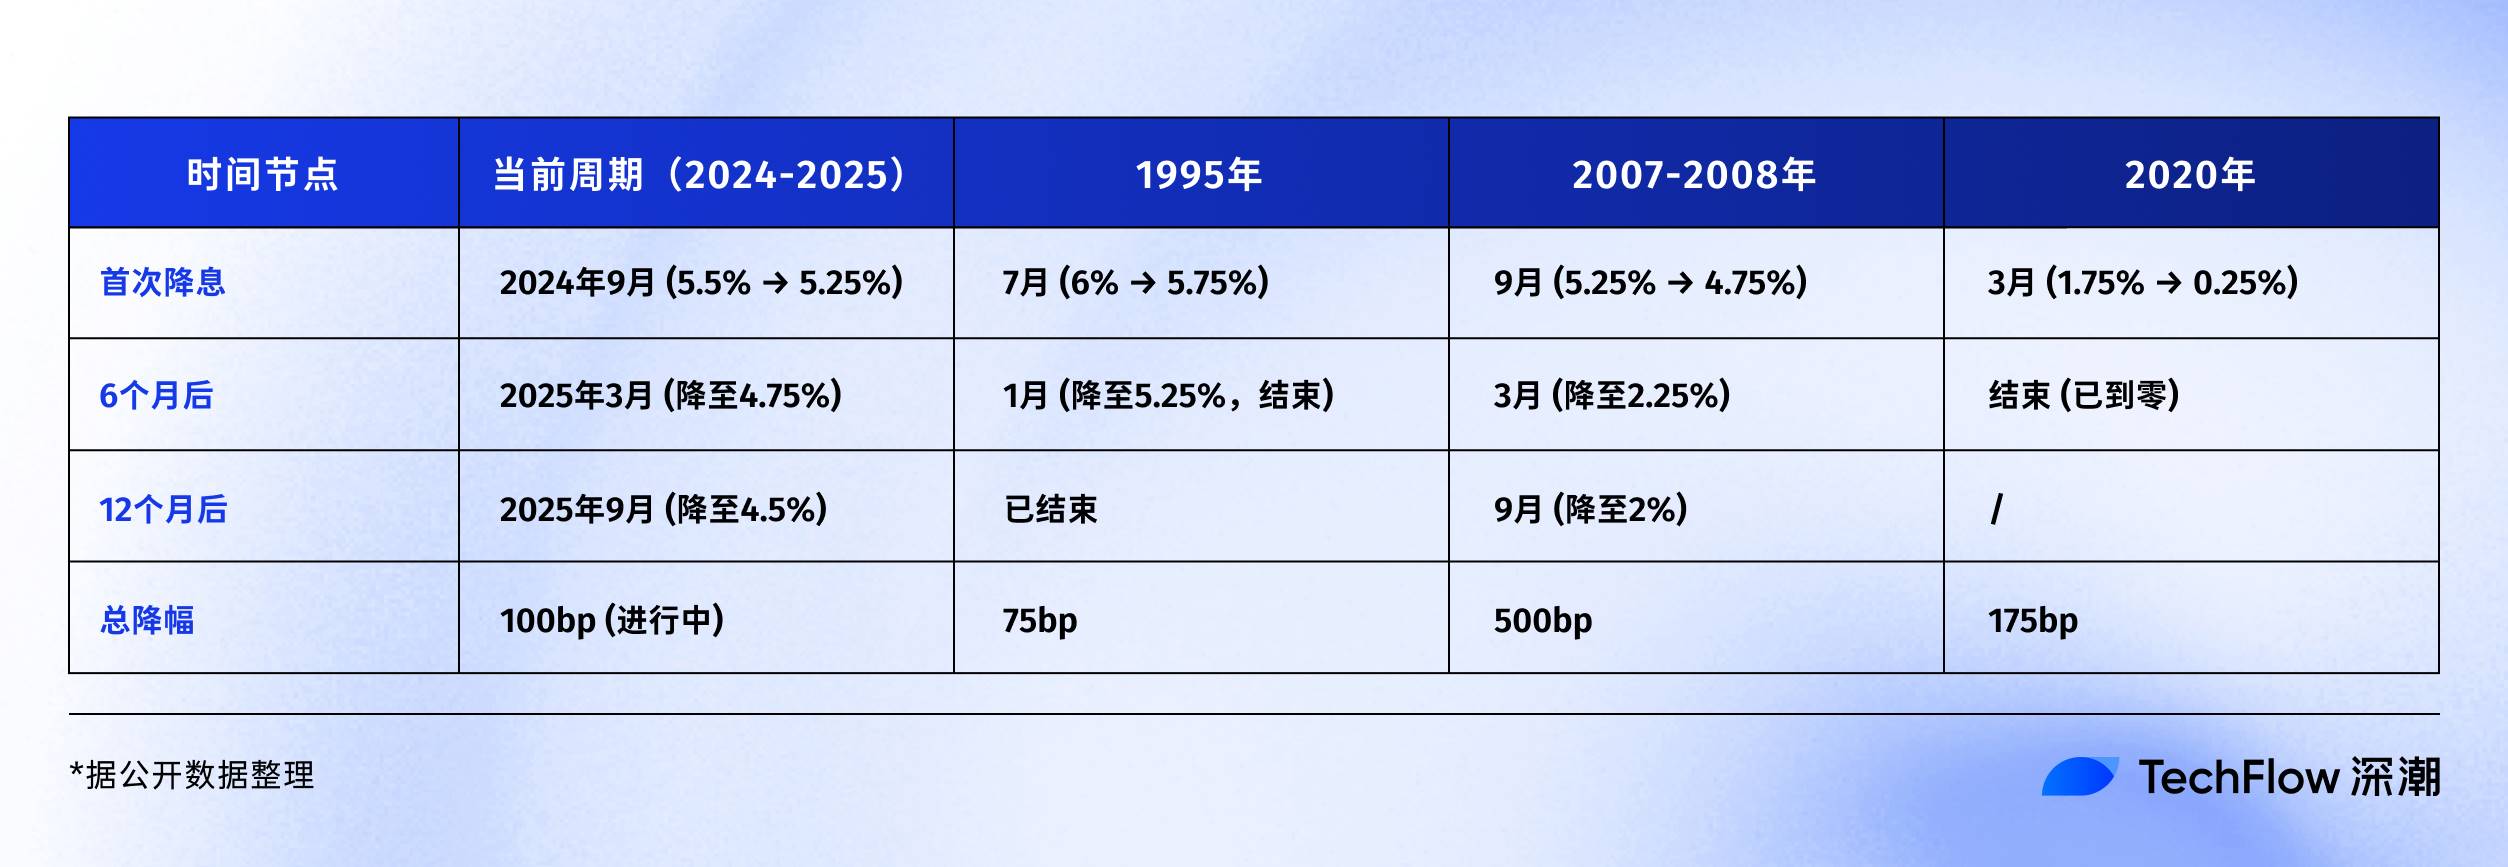
At 2:00 AM Beijing time on September 18, the Federal Reserve will announce its latest interest rate decision. Since last September's rate cut, this marks the fifth monetary policy meeting. The market expects another 25 basis point reduction, bringing rates down from the current 4.5% to 4.25%.
A year ago, everyone was waiting for the start of a rate-cutting cycle. Now, we are already halfway through it.
Why is everyone waiting for this shoe to drop? Because history tells us that once the Fed enters a rate-cutting phase, various assets often experience a rising trend.
So where will Bitcoin go this time? How will stocks and gold perform?
Reviewing the Fed’s rate-cutting cycles over the past 30 years may help us find answers in historical data.
Which type of rate-cutting cycle are we starting?
Historically, the Fed's rate cuts have never been a simple action.
Sometimes, rate cuts act as an economic stimulant, triggering immediate market rallies; but other times, they signal approaching storms, indicating bigger crises ahead, and asset prices don’t necessarily rise.
1995: Preventive rate cuts.
At the time, Fed Chair Alan Greenspan faced a "happy dilemma": solid economic growth with signs of overheating. He opted for "preventive rate cuts," lowering rates from 6% to 5.25%, a total reduction of just 75 basis points.
The result? The U.S. stock market launched the most glorious five-year bull run of the internet era. The Nasdaq index rose fivefold over the next five years—a textbook example of a soft landing.
2007: Rescue-style rate cuts.
As depicted in the movie *The Big Short*, subprime mortgage crisis trends were emerging, but few realized the scale of the coming storm. In September that year, when the Fed began cutting rates from 5.25%, markets were still celebrating—the S&P 500 had just hit a record high.
But then came the familiar script: Lehman Brothers collapsed, triggering a global financial tsunami. The Fed slashed rates from 5.25% to 0.25% within 15 months, a 500-basis-point drop. This belated rescue failed to prevent the worst economic downturn since the Great Depression.
2020: Panic-driven rate cuts.
An unforeseen "black swan"—the COVID-19 pandemic—hit. On March 3 and March 15, the Fed made two emergency rate cuts, dropping rates from 1.75% to 0.25% in just ten days. It also launched "unlimited quantitative easing," ballooning its balance sheet from $4 trillion to $9 trillion.
This unprecedented monetary expansion created one of the most surreal scenes in financial history: while the real economy stalled, financial assets partied. Bitcoin surged from $3,800 in March 2020 to $69,000 in November 2021—an increase of over 17-fold.
Looking back at these three rate-cut models, we see three different paths leading to similar outcomes:
-
Preventive rate cuts: Small reductions, soft economic landing, steady asset appreciation
-
Rescue-style rate cuts: Large cuts, hard economic landing, assets fall first, then rise
-
Panic-driven rate cuts: Emergency cuts, extreme volatility, V-shaped asset recovery
So in 2025, which script are we beginning?
Data-wise, the current situation resembles the preventive cuts of 1995. Unemployment is at 4.1%, not high; GDP is still growing, with no recession; inflation has dropped from a peak of 9% in 2022 to around 3%.
But several worrying details stand out:
First, equities are already at historic highs—S&P 500 has risen over 20% this year.
Historically, in 1995, stocks were recovering from lows when rate cuts began; in 2007, stocks were at peaks before crashing. Second, U.S. government debt stands at 123% of GDP—far above 64% in 2007—limiting fiscal stimulus capacity.
Regardless of the model, one thing is certain: the liquidity gate is about to open.
The crypto market’s rate-cut playbook
When the Fed turns on the tap again, what happens to crypto markets?
To answer, we must first understand what happened during the last easing cycle.
From 2019 to 2020, when a market worth just $200 billion suddenly received trillions in liquidity, asset gains didn't happen overnight.
-
2019 easing cycle: More thunder than rain
On July 31, the Fed cut rates for the first time in a decade—an expected major boost for crypto.
Interestingly, Bitcoin seemed to anticipate the news. From late June, BTC rose from $9,000 to $13,000 by mid-July, as markets bet on a new bull run.
But after the actual cut, the movement surprised many. On July 31, Bitcoin fluctuated around $12,000, then fell. By August, it dropped below $10,000 and by December had fallen to around $7,000.
Why? Looking back, several reasons emerge.
First, a 75-basis-point cut was relatively mild, releasing limited liquidity. Second, the crypto market had just emerged from the 2018 bear market, so investor confidence was weak.
Most importantly, traditional institutions remained cautious. Liquidity from this round flowed mainly into equities—S&P 500 rose nearly 10% during the same period.
-
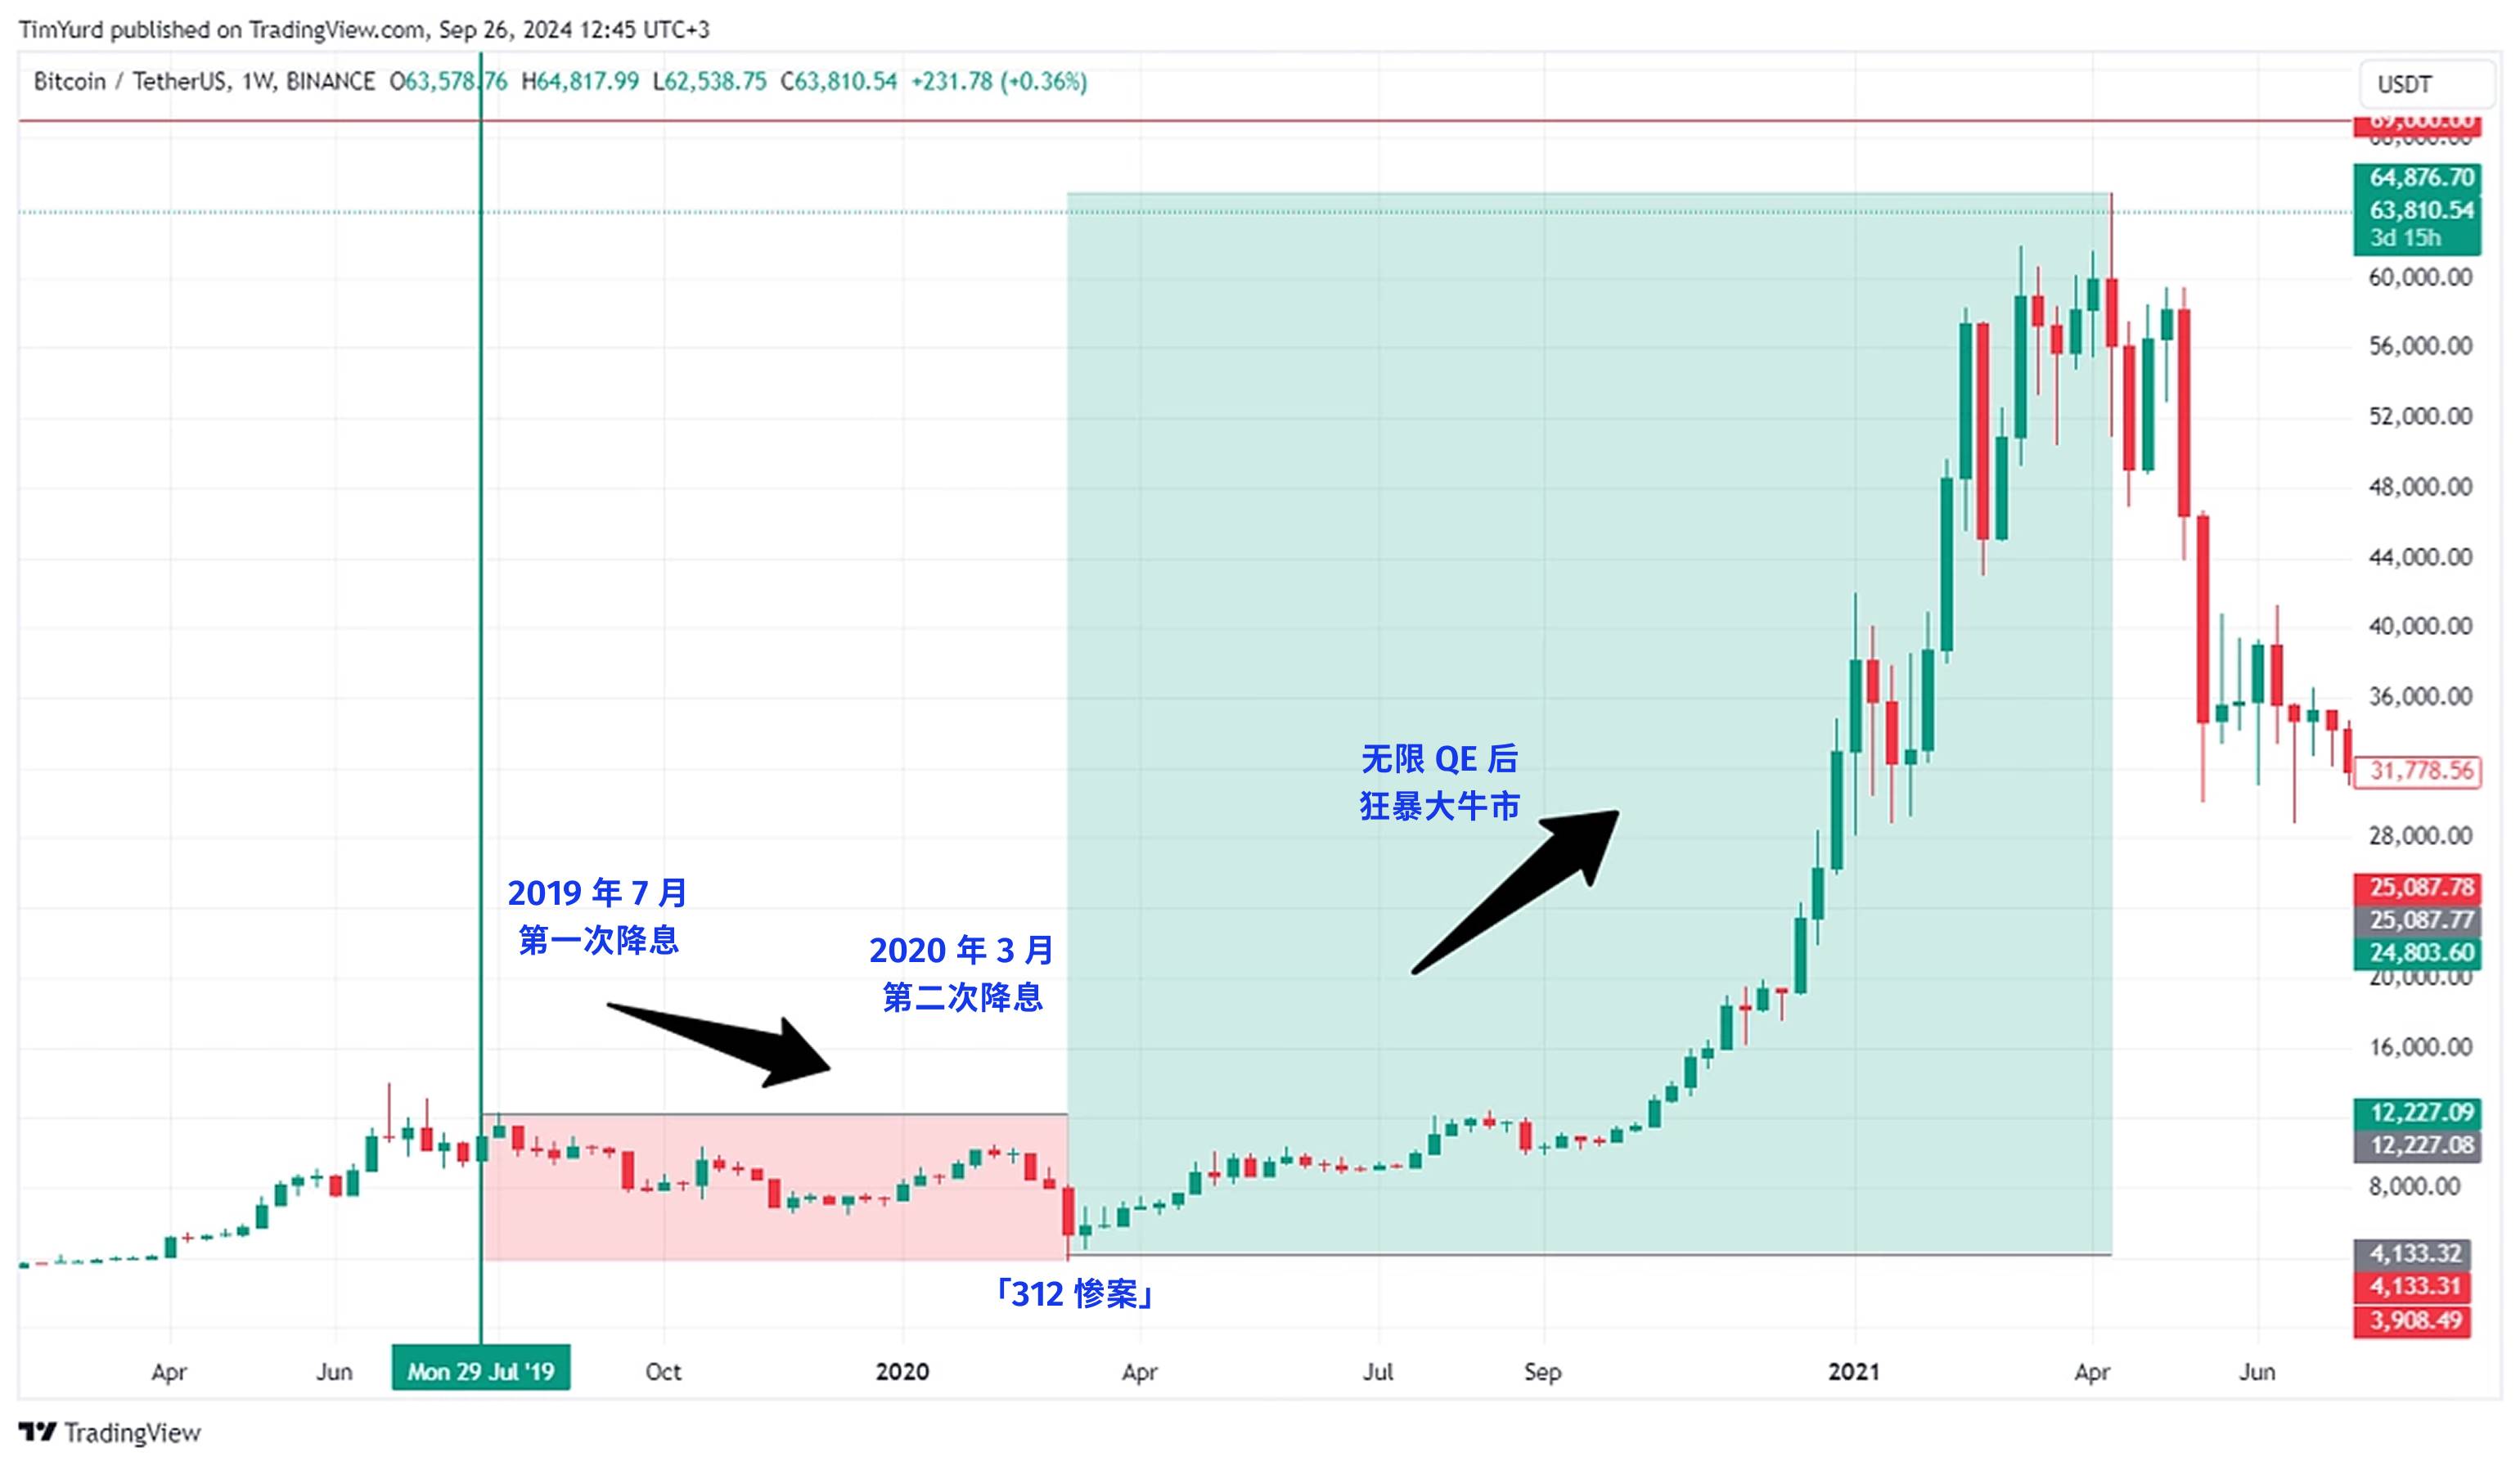
2020 easing cycle: A super rollercoaster after the '312 crash'
In early March, warning signs appeared. On March 3, the Fed made an emergency 50-basis-point cut, but Bitcoin didn’t rally—it fell from $8,800 to $8,400. The market logic: emergency cuts mean serious economic trouble—time to flee.
The following week marked crypto’s darkest hour. On March 12, Bitcoin plunged from $8,000 to $3,800 in a day, losing over 50%. Ethereum fared worse, dropping from $240 to $90.
The infamous "312" crash became a collective trauma for the crypto community.
This crash was part of a global liquidity crisis. Amid pandemic panic, all assets were sold off—equities halted, gold and Treasuries declined. Investors dumped everything for cash—even Bitcoin, the “digital gold,” couldn’t escape.
Worse, high leverage in crypto amplified losses. On derivative exchanges like BitMEX, massive 100x long positions were liquidated, triggering cascading margin calls like an avalanche. Within hours, over $3 billion in positions were wiped out.
But just when everyone thought it would go to zero, the turnaround came.
On March 15, the Fed cut rates to 0–0.25% and launched $700 billion in QE. On March 23, it unveiled "infinite QE." After bottoming at $3,800, Bitcoin began an epic rebound:
-
March 13, 2020: $3,800 (low)
-
May 2020: $10,000 (up 160% in 2 months)
-
October 2020: $13,000 (up 240% in 7 months)
-
December 2020: $29,000 (up 660% in 9 months)
-
April 2021: $64,000 (up 1,580% in 13 months)
-
November 2021: $69,000 (up 1,715% in 20 months)
It wasn't just Bitcoin—entire crypto markets rallied. Ethereum rose from $90 to a high of $4,800—up 53-fold. Many DeFi tokens surged hundreds of times. Total crypto market cap exploded from $150 billion in March 2020 to $3 trillion by November 2021.
Same rate cuts in 2019 and 2020—why such different reactions?
In hindsight, the answer is simple: the scale of rate cuts determined the amount of capital inflow.
Cutting rates to zero plus infinite QE was like opening the floodgates. The Fed’s balance sheet expanded from $4 trillion to $9 trillion—$5 trillion in new liquidity flooded markets.
Even if just 1% went into crypto, that’s $50 billion—equivalent to one-third of the entire crypto market’s value at the start of 2020.
Beyond capital, market psychology shifted dramatically—from extreme fear to extreme greed. In March, everyone sold assets for cash; by year-end, everyone borrowed to buy assets. This emotional swing amplified price swings.
Crucially, institutions entered the market.
MicroStrategy began buying Bitcoin in August 2020, accumulating over 100,000 BTC. Tesla announced a $1.5 billion Bitcoin purchase in February 2021. Grayscale Bitcoin Trust (GBTC) holdings grew from 200,000 BTC at the start of 2020 to 650,000 by year-end.
These institutional buys brought not only capital but credibility.
-
2025: History repeating?
In terms of cut size, September 17’s expected 25-basis-point reduction is just the beginning. Based on current economic data, the full easing cycle (over the next 12–18 months) could see cumulative cuts of 100–150 basis points, potentially bringing rates down to around 3.0–3.5%. This scale sits between 2019 (75 bps) and 2020 (to zero).
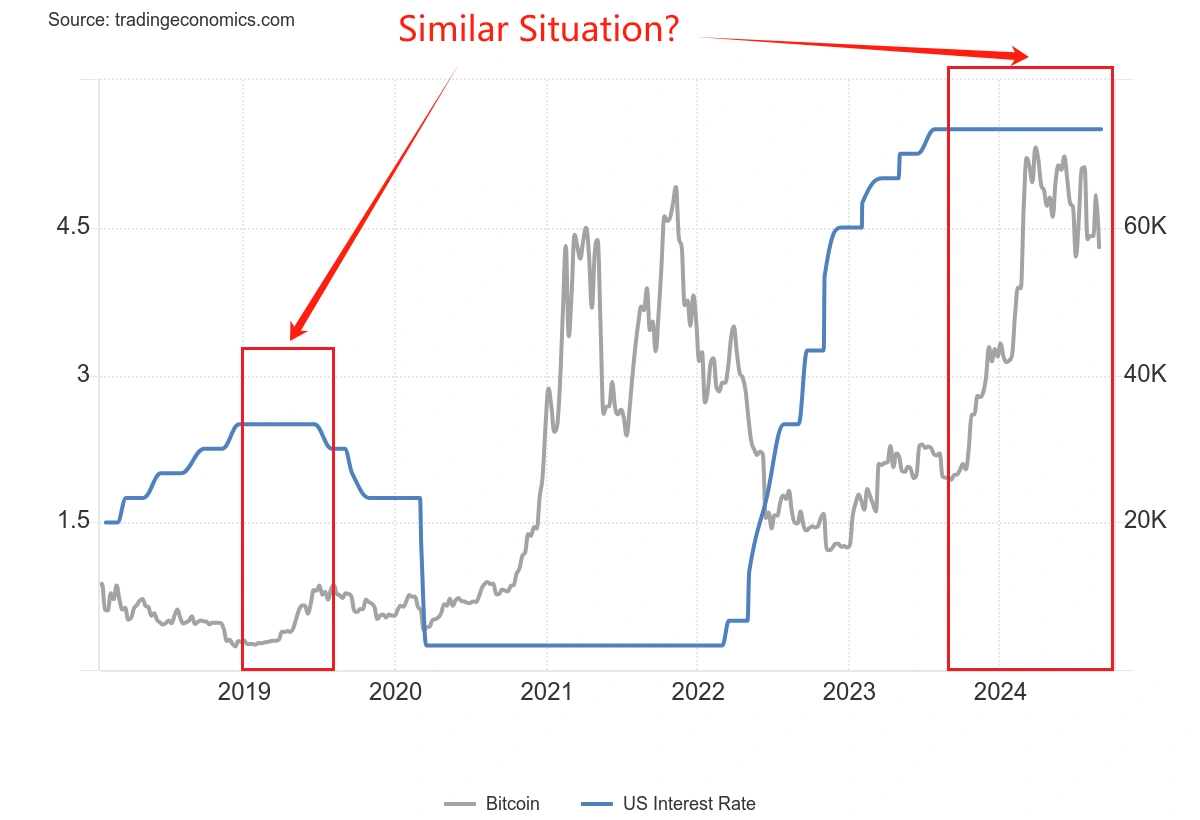
Bitcoin is already near its historical high of $115,000—not offering the same upside potential as in March 2020. But unlike 2019, it isn’t emerging from a bear market, so market confidence is relatively strong.
Institutional participation has changed significantly. The approval of Bitcoin ETFs is a turning point. In 2020, institutions cautiously dipped their toes; now, standardized investment tools exist. But institutions have also grown wiser—they won’t FOMO-buy at peaks as they did in 2020–2021.
Perhaps 2024–2025 will bring a third script—neither the dullness of 2019 nor the frenzy of 2020, but a "rational boom." Bitcoin may not surge 17-fold again, but steady gains as liquidity flows in seem more plausible.
Performance of other assets also matters. If stocks and gold rise, capital will be分流ed.
Traditional assets in rate-cut cycles
Rate-cut cycles affect not only crypto but also traditional assets.
For crypto investors, understanding how these assets historically behave is crucial—they are both funding sources and competitors.
U.S. Stocks: Not every rate cut brings a bull market
According to researchdata from BMO, here’s how the S&P 500 performed in past rate-cut cycles over the last 40+ years:
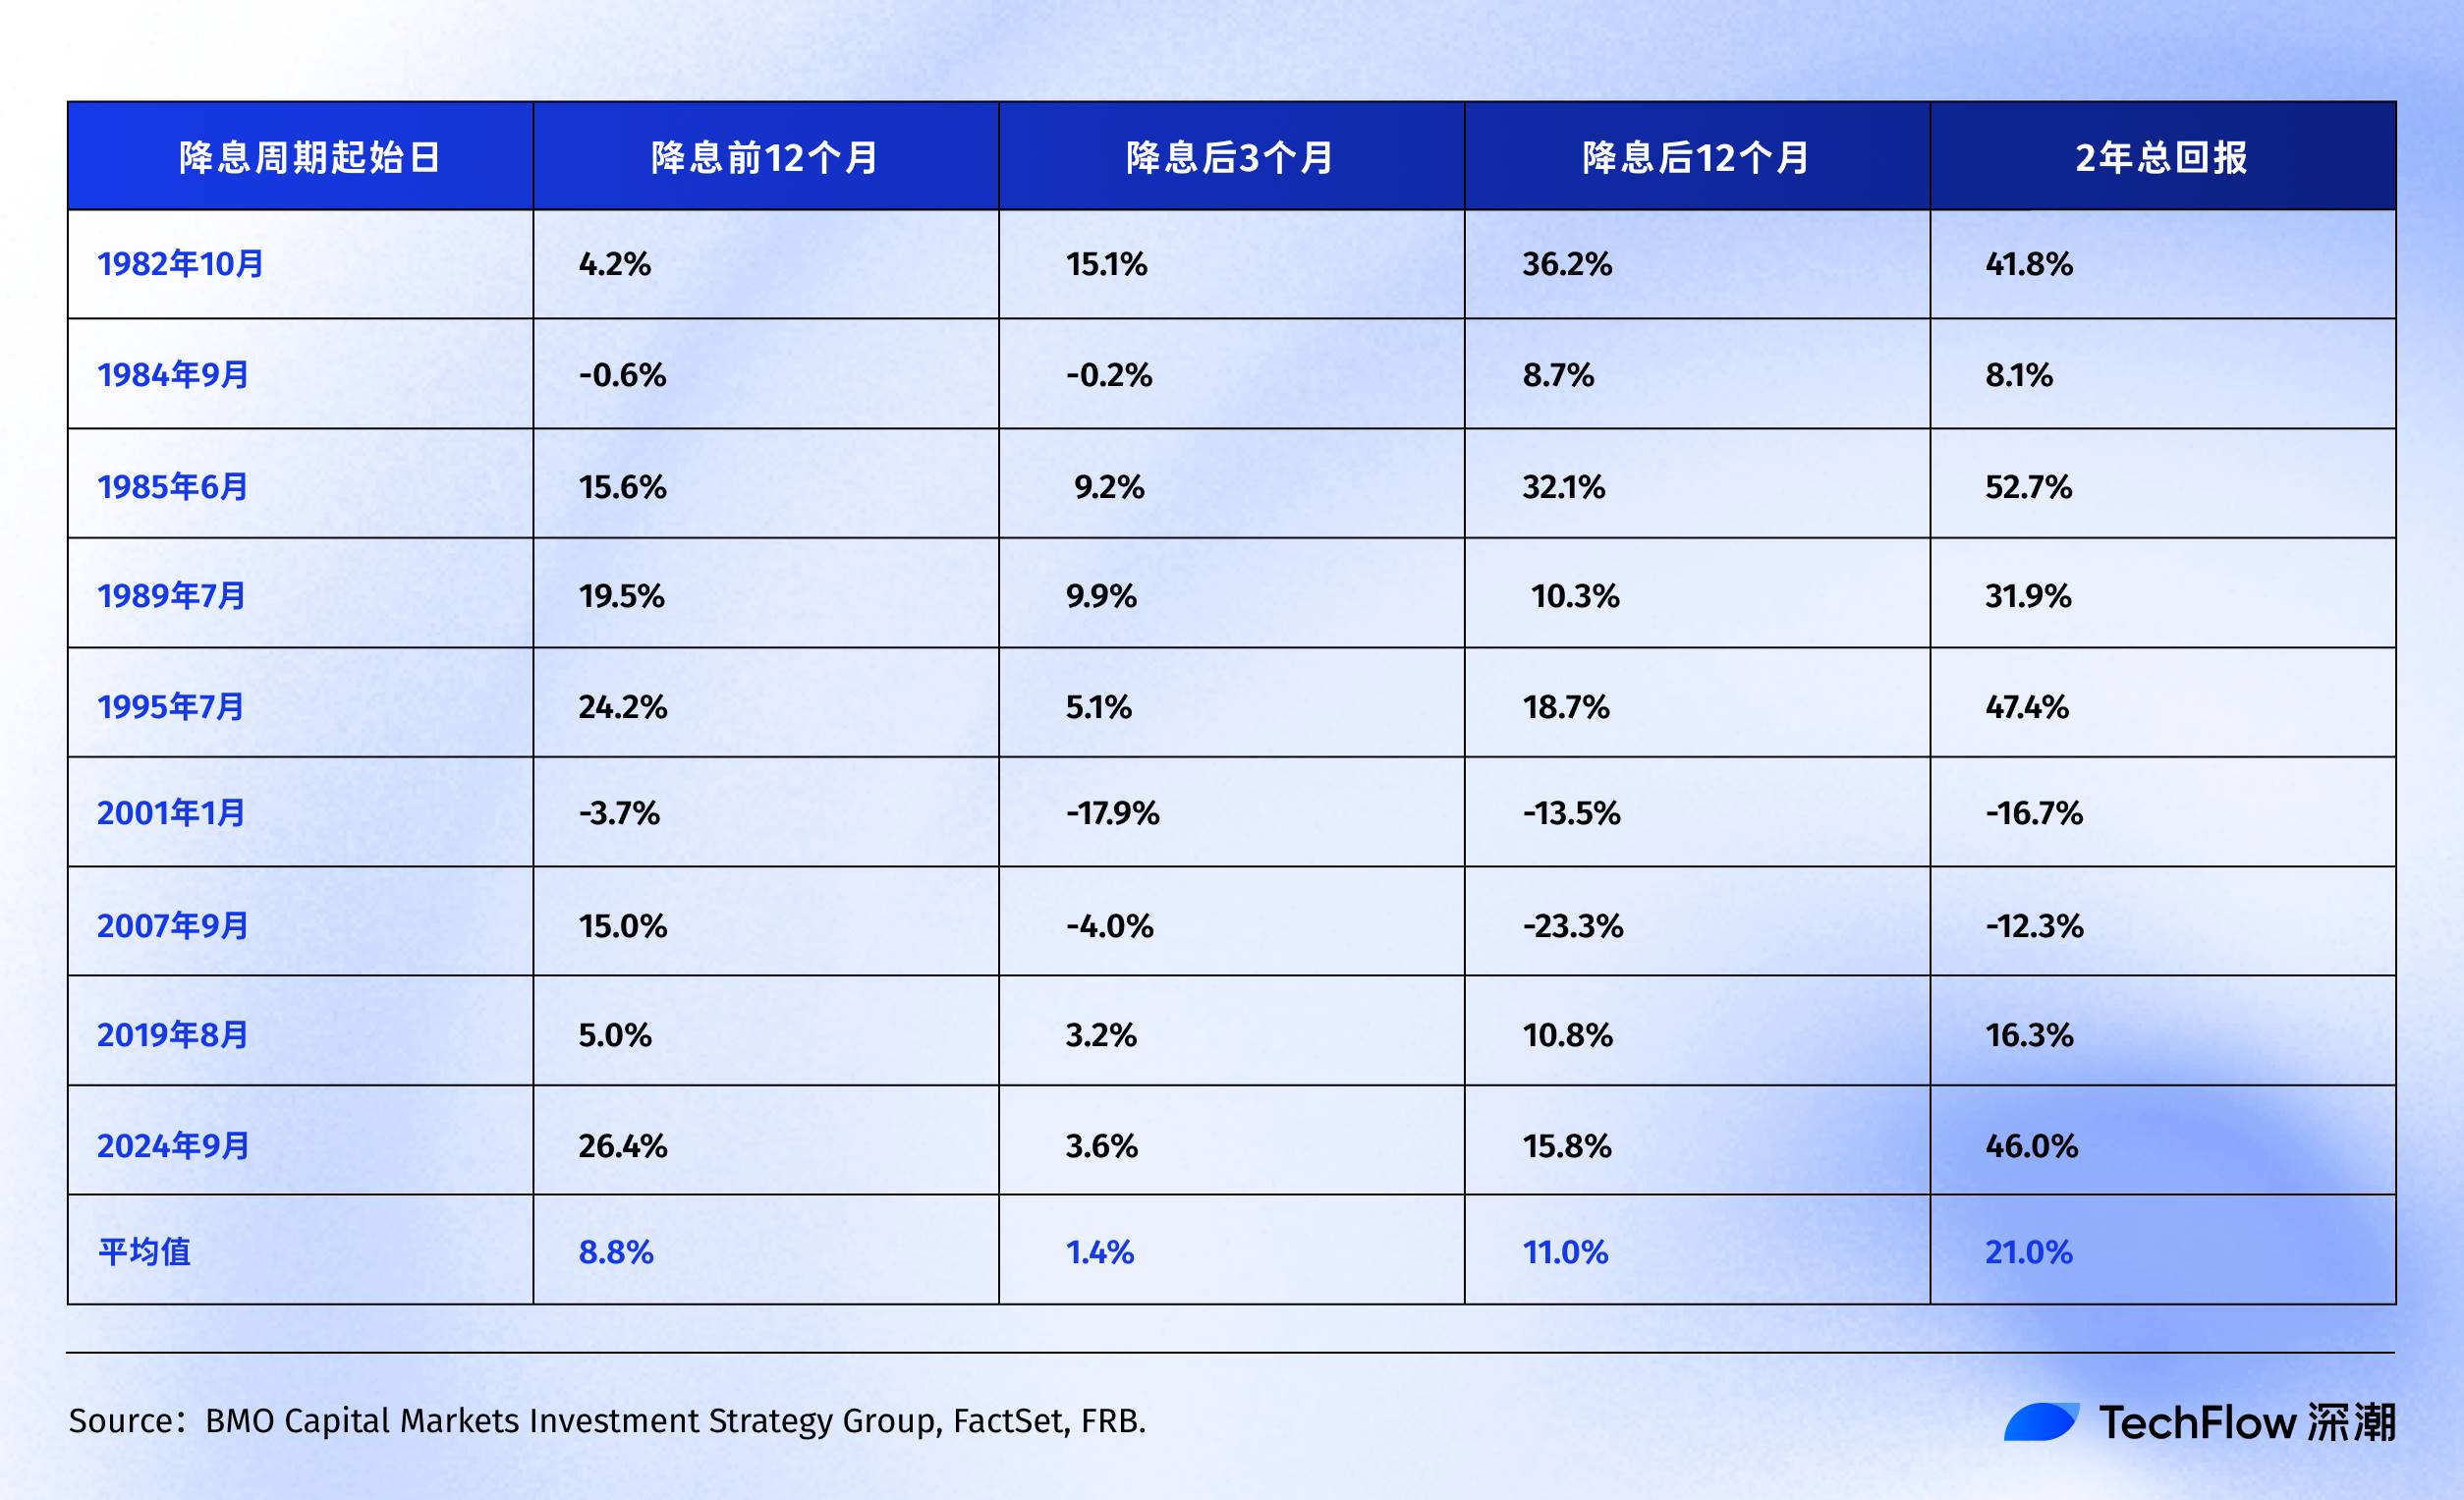
History shows that the S&P 500 typically delivers positive returns within 12 to 24 months after the Fed's first or renewed rate cut.
Interestingly, if we exclude the tech bubble (2001) and the financial crisis (2007)—two “black swans”—the average return of the S&P 500 around rate cuts becomes even higher.
This reveals the key point: the S&P 500’s average return is merely a reference. Actual post-rate-cut performance depends entirely on why the cuts are happening. If it’s a preventive move like in 1995, markets celebrate. If it’s crisis-fighting (like 2007), markets fall first, then recover—painfully.
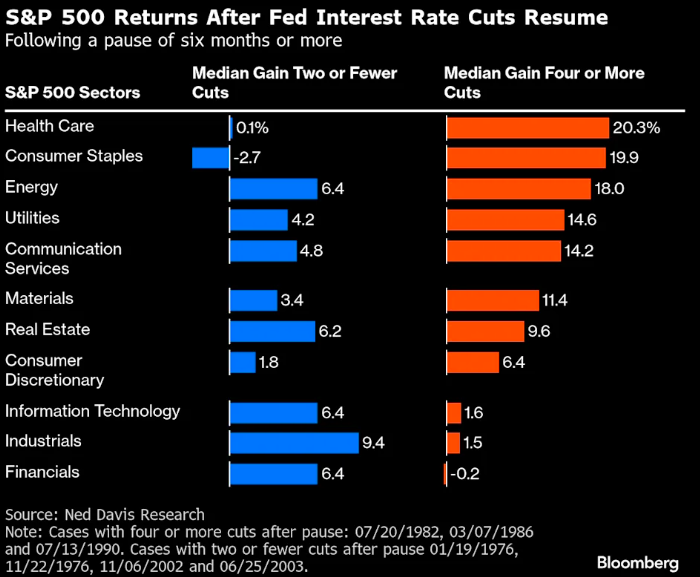
Looking deeper at sectors, Ned Davis Research shows defensive sectors tend to outperform during rate cuts:
-
In four cycles where the economy was strong and the Fed resumed cuts with only one or two moves, cyclical sectors like financials and industrials outperformed the broader market.
-
But in weaker economies requiring four or more large cuts, investors favor defensive sectors. Healthcare and consumer staples delivered median returns of 20.3% and 19.9%, respectively. Meanwhile, much-hyped tech stocks managed only a pitiful 1.6%.
Additionally, according to Nomura Securities’research, three months after a 50-basis-point rate cut, the S&P 500 sees little change, but the small-cap Russell 2000 Index averages a 5.6% gain.
This makes sense. Smaller firms are more rate-sensitive—their borrowing costs are higher, so rate cuts bring greater marginal benefit. And small caps often reflect "risk appetite"; when they outperform large caps, market sentiment is turning optimistic.
Now, since the September 2024 rate cut:
-
S&P 500: up from 5,600 to 6,500 (+16%)
-
Nasdaq: up from 17,000 to 22,000 (+30%)
Compared to history, the current 16% annualized gain exceeds the 11% average after past Fed rate cuts. More telling is that Nasdaq’s gain is nearly double that of the S&P 500. Moreover, the S&P 500 was already at historic highs before the cuts—a rare occurrence in prior easing cycles.
Bond Market: Most stable, but also most boring
Bonds are the most "well-behaved" asset in rate-cut cycles. When the Fed cuts rates, bond yields fall and prices rise—almost without exception.
According to Bondsavvy’s< a="" href="https://www.bondsavvy.com/fixed-income-investments-blog/fed-rate-cuts-impact-on-bond-yields-and-mortgage-rates">analysis, 10-year Treasury yield declines across different easing cycles have been remarkably consistent:
-
2001–2003: Down 129 basis points
-
2007–2008: Down 170 basis points
-
2019–2020: Down 261 basis points (special pandemic period)
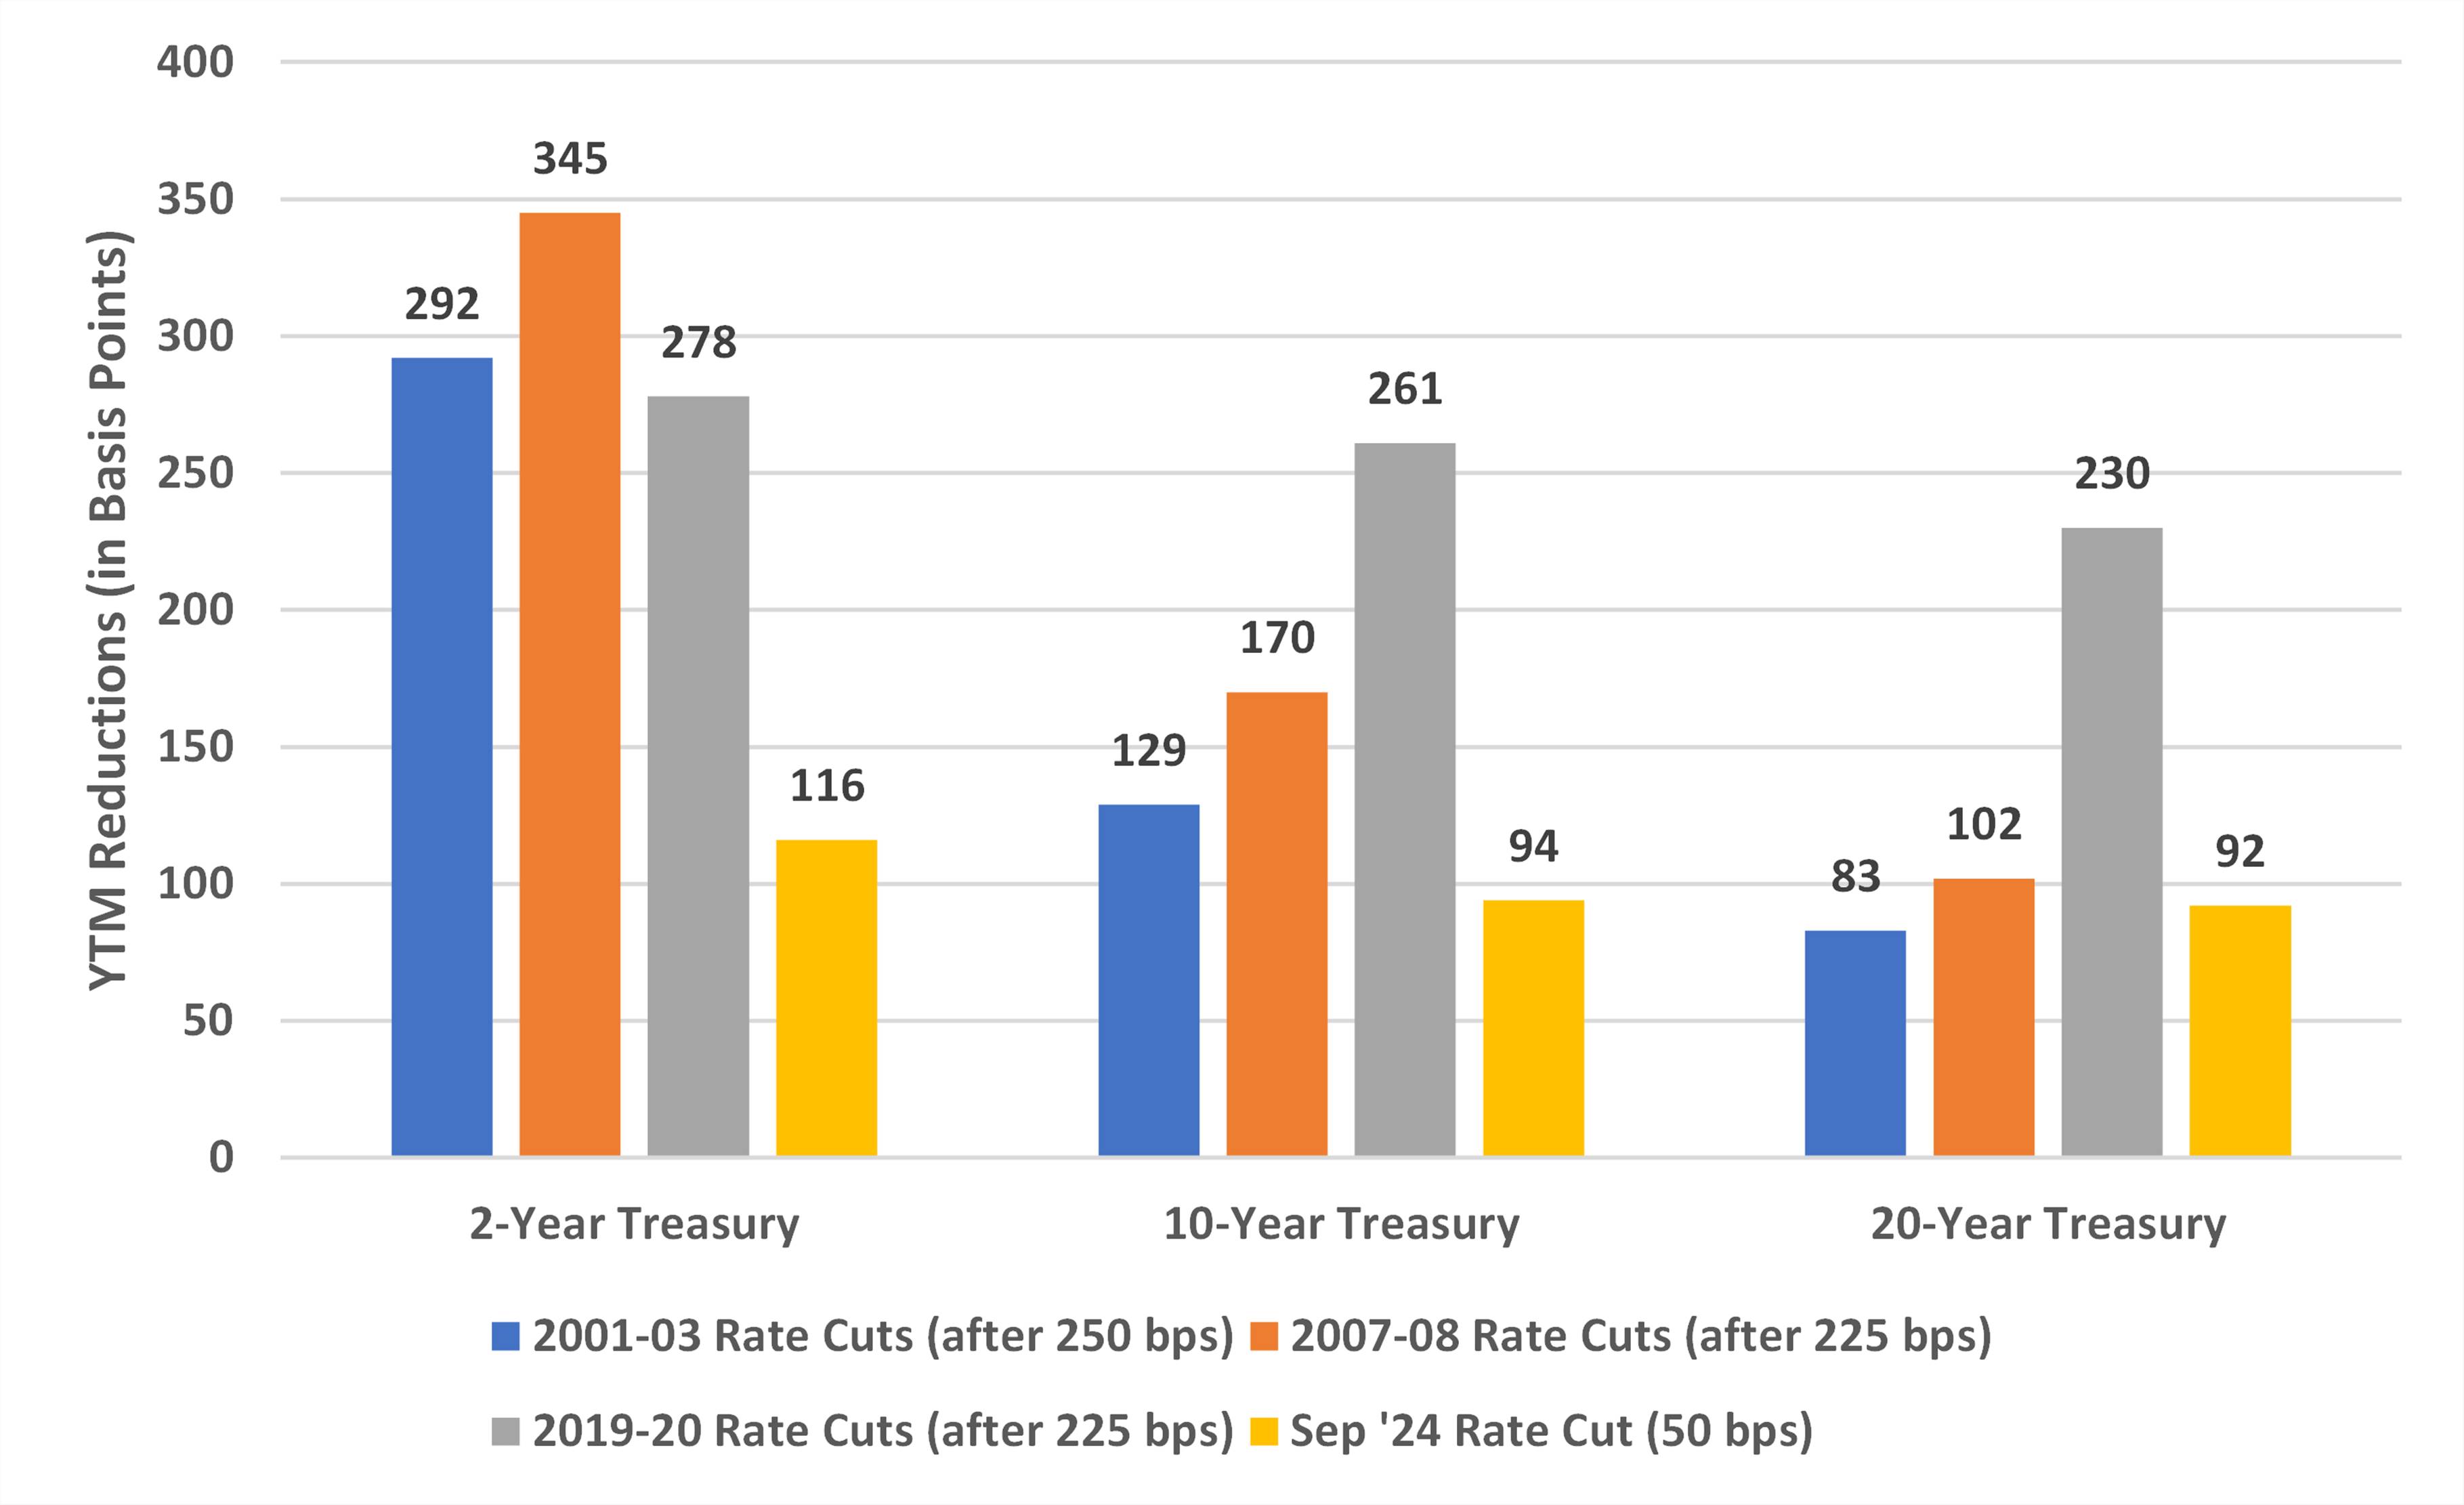
Why such a big drop in 2019–2020? Because the Fed not only cut to zero but launched "infinite QE," directly buying bonds and artificially suppressing yields. Such unconventional measures don’t occur in normal easing cycles.
-
Progress in the current cycle

Based on 2001 and 2007 experiences, the total decline in 10-year Treasury yields should be between 130–170 basis points. So far, it’s down 94 basis points, leaving room for another 35–75 basis points.
In price terms, if the 10-year yield drops another 50 basis points to ~3.5%, investors holding 10-year Treasuries could gain ~5% in capital appreciation. Solid for bond investors, but likely underwhelming for crypto players used to doubling returns.
Still, for risk asset investors, bonds serve as a crucial "anchor" for funding costs. If Treasury yields plunge while corporate bond yields rise, it signals a flight to safety—increasing the likelihood that risk assets like Bitcoin will be sold.
Gold: The consistent winner in rate-cut cycles
Gold might be the asset that best "understands" the Fed. Over recent decades, it has rarely disappointed during rate-cut cycles.
According to Auronum’s< a="" href="https://auronum.co.uk/the-feds-influence-on-gold-prices-what-happens-after-interest-rate-cuts/">research, gold’s performance in the last three easing cycles:
-
2001 cycle: Up 31% in 24 months
-
2007 cycle: Up 39% in 24 months
-
2019 cycle: Up 26% in 24 months
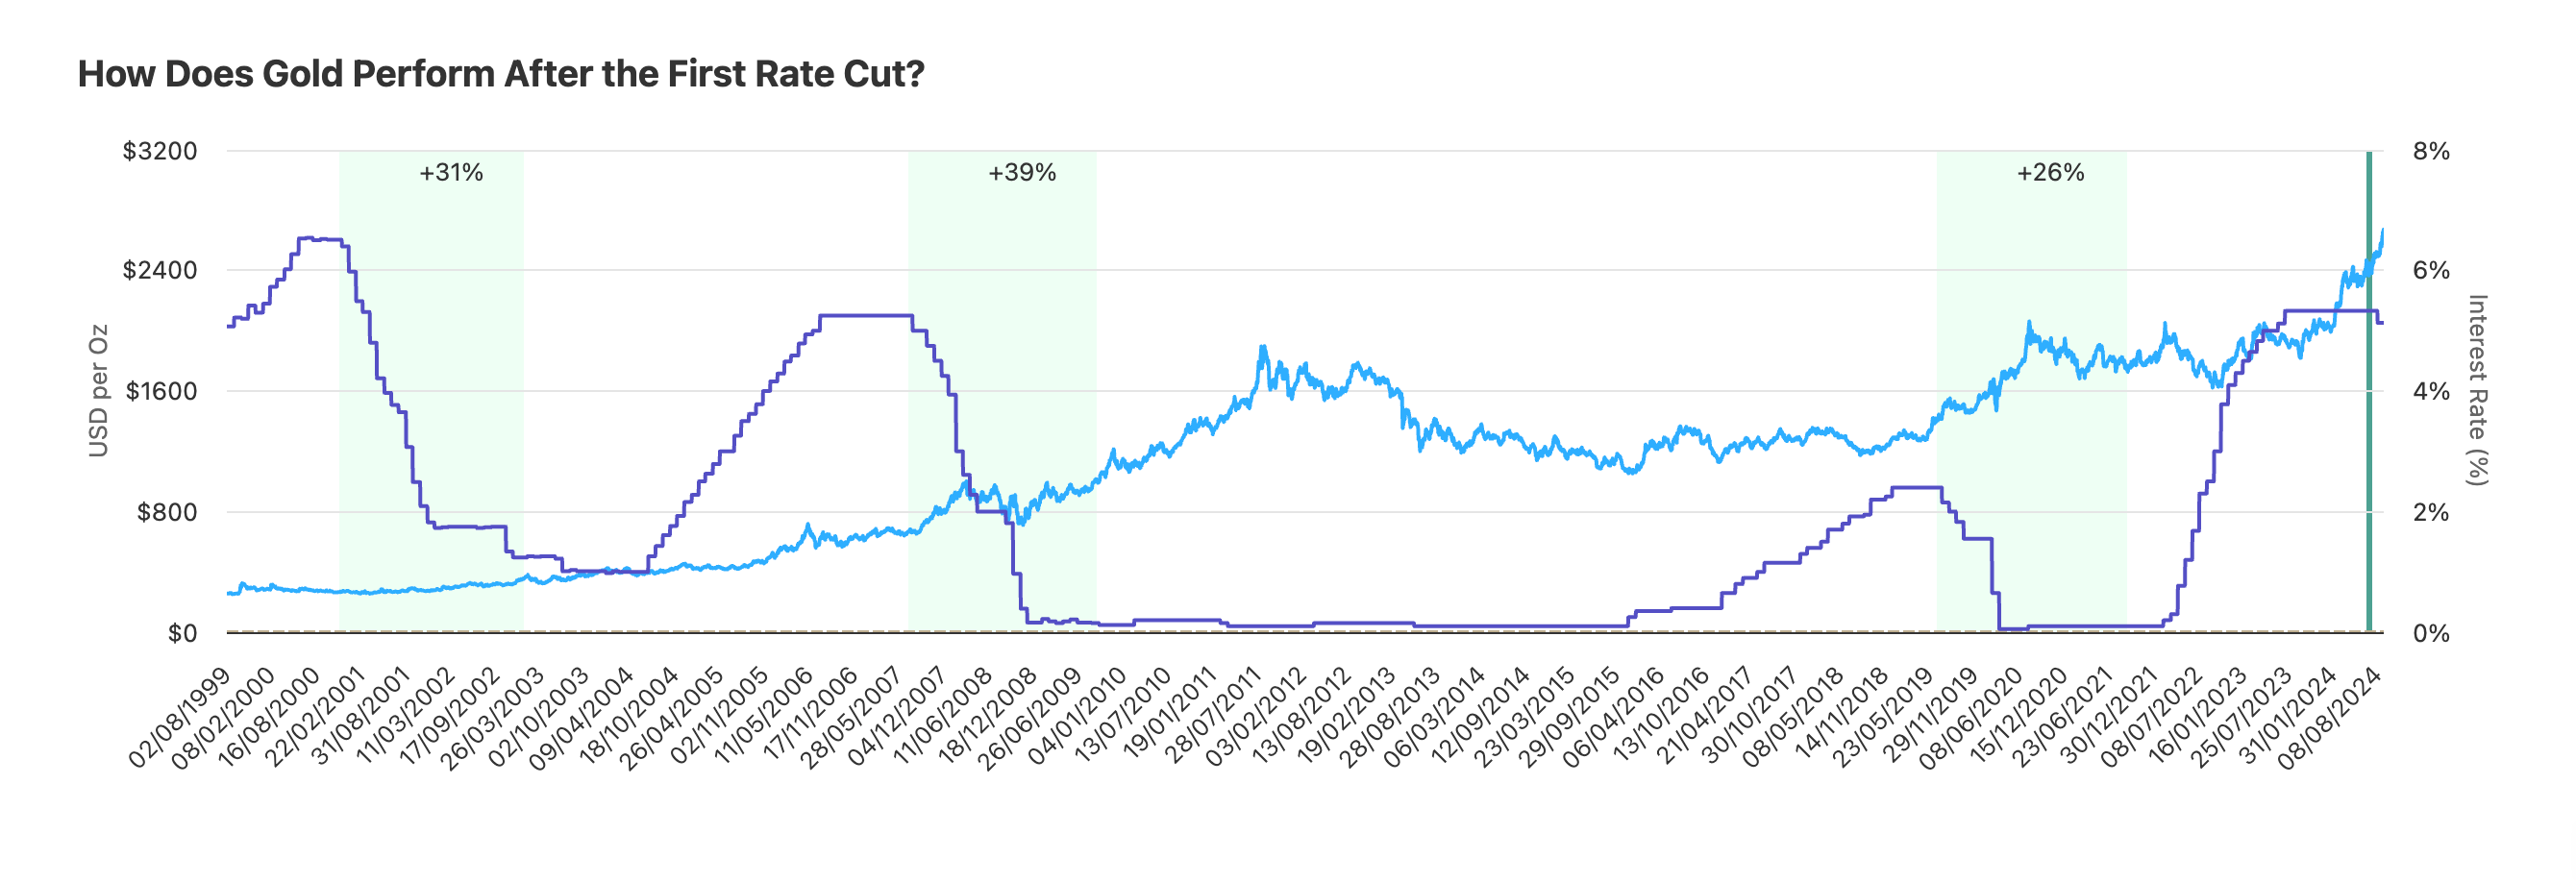
On average, gold rises ~32% over two years after rate cuts. Less exciting than Bitcoin, but consistently positive—no exceptions in three cycles.
-
Current cycle: Stronger-than-expected performance
Up 41% in a year—surpassing any previous rate-cut cycle’s同期 performance. Why so strong?
First, central bank buying. In 2024, global central banks purchased over 1,000 tons of gold—a record. China, Russia, India, and others are increasing reserves, seeking to reduce reliance on the dollar—"de-dollarization."
Second, geopolitical risks. Crises in Ukraine and the Middle East have destabilized regions, adding a "war premium" to gold prices.
Third, inflation hedging. U.S. government debt exceeds 120% of GDP, with annual deficits of $2 trillion. Where does this money come from? Printing. Gold is a traditional hedge against currency devaluation. When investors worry about the dollar’s purchasing power, gold rises. Bitcoin shares this logic, but markets still trust gold more.
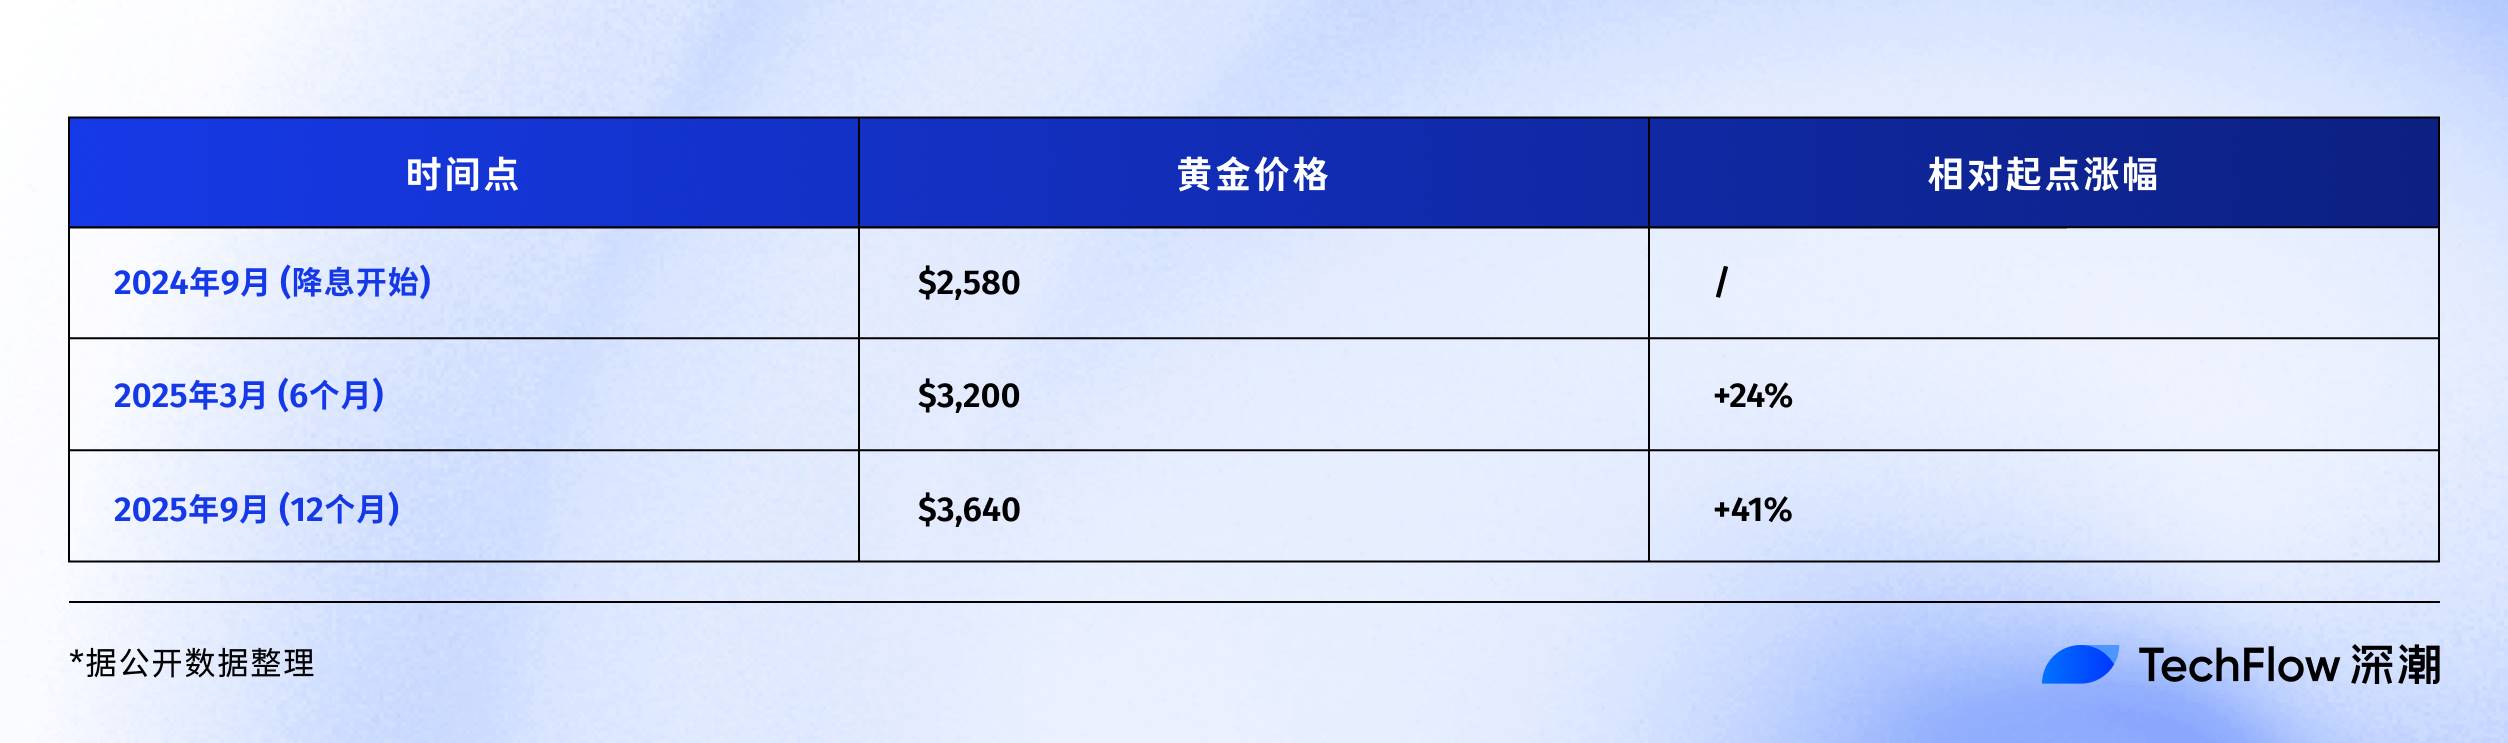
One-year performance comparison:
-
Gold: +41% ($2,580 → $3,640)
-
Bitcoin: +92% ($60,000 → $115,000)
On the surface, Bitcoin wins. But considering market cap differences—gold at $15 trillion vs. Bitcoin at $2.3 trillion—gold’s 41% gain absorbed far more capital. Historically, when gold gains over 35% in a rate-cut cycle, it tends to enter consolidation. Simple reason—profit-taking needs digestion.
Final Thoughts
In September 2025, we stand at a fascinating juncture.
The easing cycle has lasted a year—neither fast nor slow. Bitcoin at $115,000—neither too high nor too low. Market sentiment is greedy but not frenzied, cautious but not fearful. This middle ground is hardest to read and tests patience the most.
History suggests the second half of easing cycles is often more exciting. After the final two cuts in 1995, the U.S. stock market ignited the internet bull run. In 2020, Bitcoin didn’t truly take off until six months after rate cuts began.
If history rhymes, the next 6–12 months may be the critical window.
But history also reminds us that surprises happen. Maybe this time, AI-driven productivity booms eliminate inflation permanently, allowing endless rate cuts. Or perhaps geopolitical conflicts escalate, or a new financial crisis hits.
The only certainty is change itself.
The dollar-dominated monetary system is changing. Ways of storing value are changing. The speed of wealth transfer is changing.
Crypto represents not just an asset class, but a tiny reflection of this changing era. So rather than obsess over whether Bitcoin will hit $150K or $200K, ask yourself:
In this shifting landscape, am I ready?
If your answer is yes, congratulations. The rate-cut cycle is just beginning—the real show is yet to come.
Join TechFlow official community to stay tuned
Telegram:https://t.me/TechFlowDaily
X (Twitter):https://x.com/TechFlowPost
X (Twitter) EN:https://x.com/BlockFlow_News