Chainalysis 2025 Cryptocurrency Adoption Index: India and the U.S. Lead as Global Adoption Accelerates
TechFlow Selected TechFlow Selected
Chainalysis 2025 Cryptocurrency Adoption Index: India and the U.S. Lead as Global Adoption Accelerates
Compared to the previous year, nearly every region experienced accelerated growth during this cycle.
Written by: Chainalysis
Translated by: Chopper, Foresight News
We are pleased to share the 2025 Chainalysis Global Crypto Adoption Index. In each year's report, we examine on-chain and off-chain data to identify which countries are leading the world in grassroots cryptocurrency adoption. Our research highlights nations where unique crypto use cases are taking root and explores why people around the world are embracing cryptocurrencies.
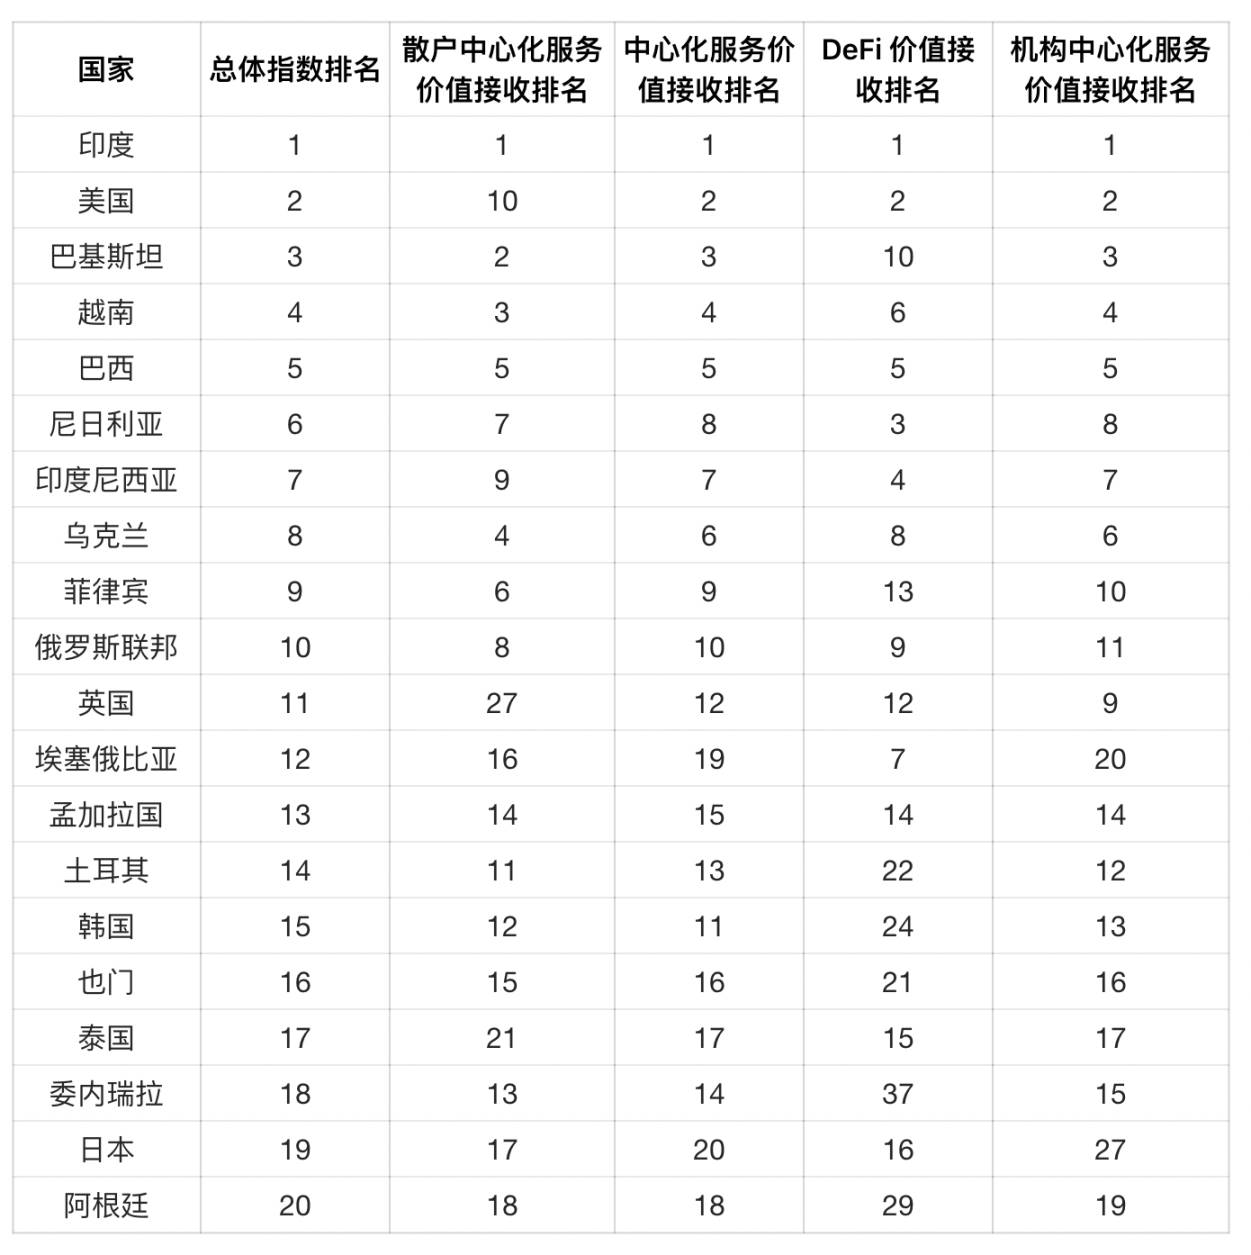
Top 20 Countries in the 2025 Global Crypto Adoption Index
In 2025, the Asia-Pacific region further solidified its position as the global hub for grassroots crypto activity, led by India, Pakistan, and Vietnam—nations whose populations are driving widespread adoption of both centralized and decentralized services. Meanwhile, North America rose to second place among regions due to regulatory momentum, including the approval of spot Bitcoin ETFs and clearer institutional frameworks, helping legitimize and accelerate crypto participation within traditional financial channels.
Asia-Pacific Emerges as the Fastest-Growing Region
Over the 12 months ending June 2025, the Asia-Pacific region became the fastest-growing region for on-chain crypto activity, with a 69% year-on-year increase in value received. Total crypto transaction volume in Asia-Pacific grew from $1.4 trillion to $2.36 trillion, driven by strong engagement in major markets such as India, Vietnam, and Pakistan.
Latin America followed closely behind, recording a 63% growth in crypto adoption, reflecting rising uptake at both retail and institutional levels. In contrast, Sub-Saharan Africa saw a 52% increase in adoption, indicating the region continues to rely on crypto for remittances and daily payments. These figures highlight a broad shift in crypto momentum toward the Global South, where real-world use cases are increasingly driving adoption.
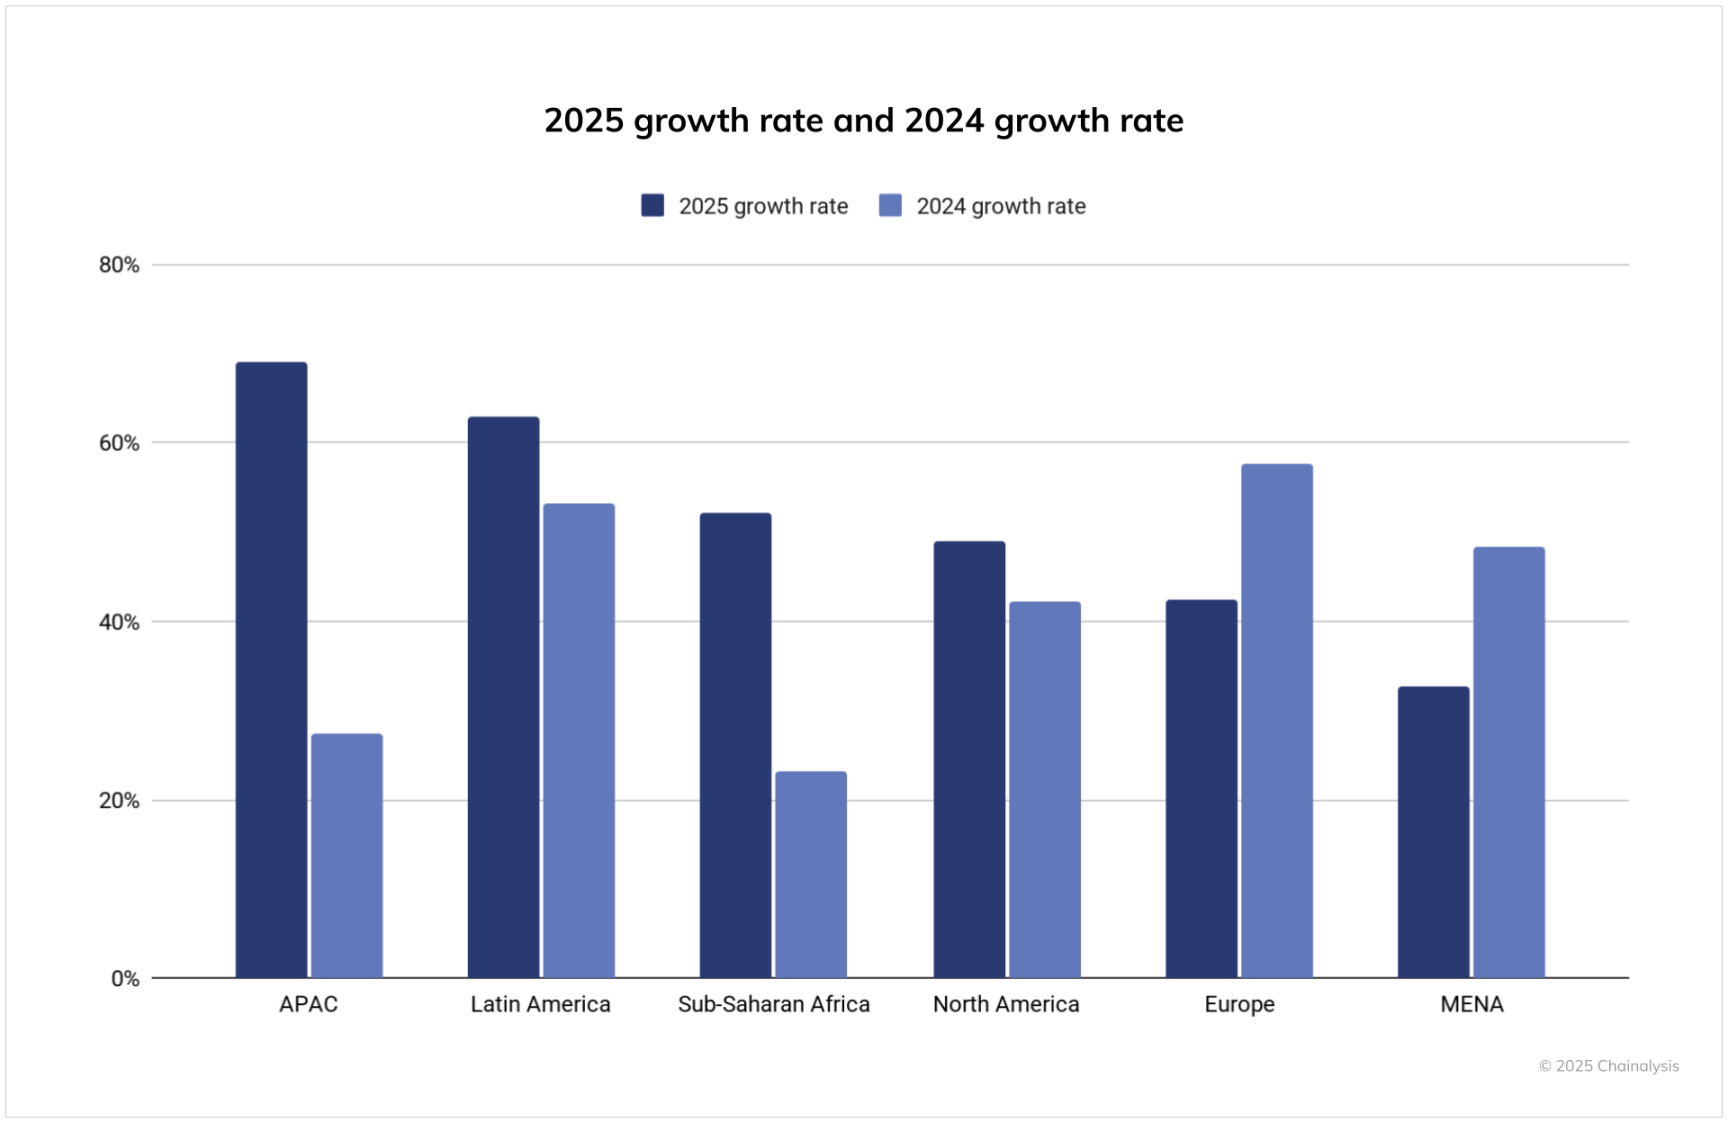
Meanwhile, in absolute terms, North America and Europe remain dominant, receiving over $2.2 trillion and $2.6 trillion respectively over the past year. North America’s 49% growth reflects a year of renewed institutional interest in crypto, fueled by the launch of spot Bitcoin ETFs and improved regulatory clarity. Europe’s 42% growth, while lower than other regions, is still substantial given its already high base, underscoring continued institutional activity and an expanding user base across the continent. The Middle East and North Africa saw more moderate growth at 33%, suggesting slower adoption compared to other emerging markets, though total transaction volume still exceeded $500 billion.
Compared to the previous year, nearly every region experienced accelerated growth in this cycle, with particularly pronounced gains in Asia-Pacific and Latin America. Last year, Asia-Pacific’s growth rate was only 27%, but in the most recent period it more than doubled to 69%. Similarly, Latin America’s year-over-year growth surged from 53% to 63%, cementing the region’s status as one of the fastest-growing centers for crypto. Rapid increases were also observed in Europe, the Middle East and North Africa, and Sub-Saharan Africa, signaling broad-based expansion worldwide. Notably, North America’s growth rate also increased from 42% to 49%, further indicating that 2025’s regulatory clarity and institutional capital inflows are beginning to manifest in transaction-level data.
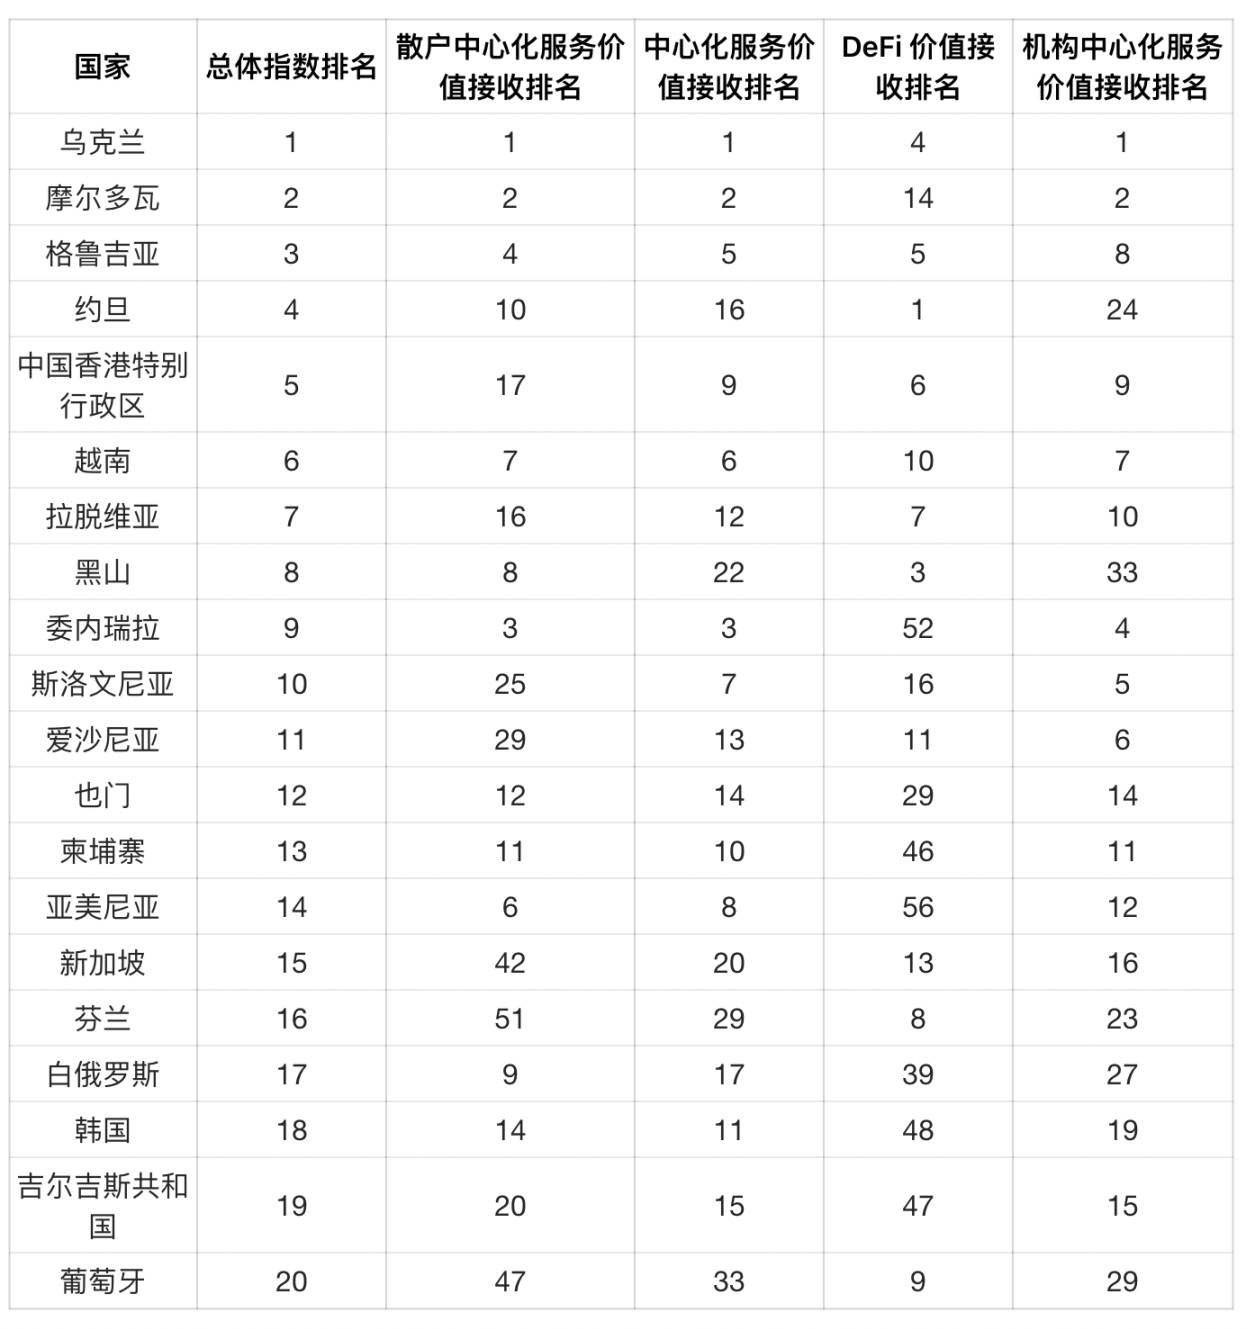
A New Picture When Adjusted for Population: Eastern Europe Dominates
Our index has traditionally focused on GDP per capita-adjusted activity, a method that worked best when crypto was niche and concentrated among high-volume users. But as adoption widens, population-adjusted metrics provide a clearer view of where crypto is gaining genuine grassroots traction.
When we adjust our index for population, we see a very different set of leading countries. Eastern European nations—including Ukraine, Moldova, and Georgia—top the rankings, reflecting high levels of crypto activity relative to their population size. Economic uncertainty, distrust in traditional financial institutions, and relatively high technical literacy in the region may be driving crypto adoption in Eastern Europe. These factors make crypto an attractive alternative for wealth preservation and cross-border transactions, especially in countries facing inflation, war, or banking restrictions.
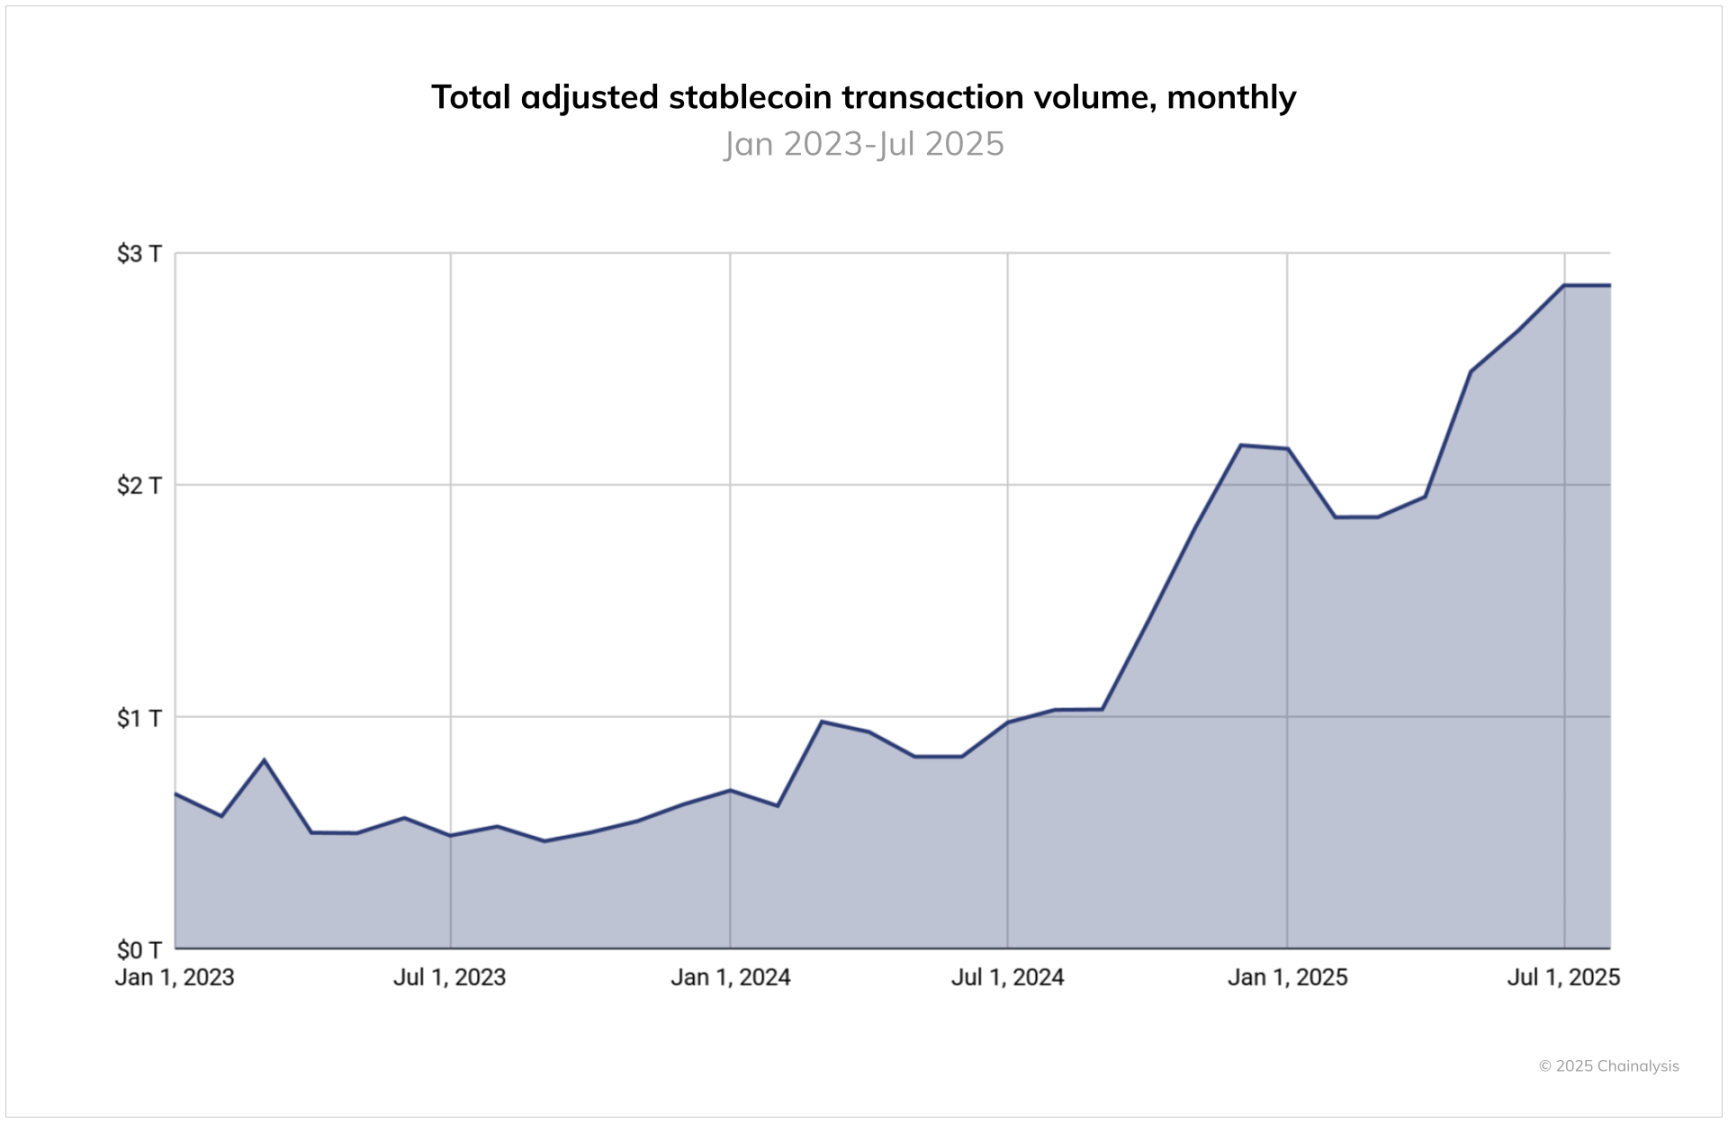
Stablecoins Surge Globally
Over the past 12 months, the regulatory landscape for stablecoins has undergone significant changes. While the U.S. GENIUS Act has not yet taken effect, its passage has sparked strong institutional interest. In the European Union, the Markets in Crypto-Assets Regulation (MiCA) has paved the way for the launch of licensed euro-backed stablecoins like EURC.
However, when examining on-chain data, trading volumes remain dominated by USDT and USDC, consistently outpacing other stablecoins in scale. From June 2024 to June 2025, USDT processed over $1 trillion in monthly transaction volume, peaking at $1.14 trillion in January 2025. Meanwhile, USDC’s monthly volume ranged between $1.24 trillion and $3.29 trillion, with particularly high activity in October 2024. These volumes underscore Tether and USDC’s continued central role in crypto market infrastructure, especially in cross-border payments and institutional activity.
Yet, examining growth trends reveals a different dynamic. While Tether and USDC have seen some fluctuations, smaller stablecoins like EURC, PYUSD, and DAI have experienced rapid growth. For example, EURC averaged nearly 89% month-over-month growth, increasing from around $47 million in June 2024 to over $7.5 billion by June 2025. PYUSD also showed sustained acceleration, growing from approximately $783 million to $3.95 billion during the same period.
These shifts align with increasing institutional activity around stablecoins. Stripe, Mastercard, and Visa have all launched products enabling users to spend stablecoins through traditional channels, while platforms like MetaMask, Kraken, and Crypto.com have introduced stablecoin payment features linked to debit cards. On the merchant side, partnerships between Circle, Paxos, and Nuvei aim to streamline stablecoin settlements. Meanwhile, traditional financial institutions like Citibank and Bank of America have announced plans to explore expanding their offerings—and even hinted at launching their own stablecoins.
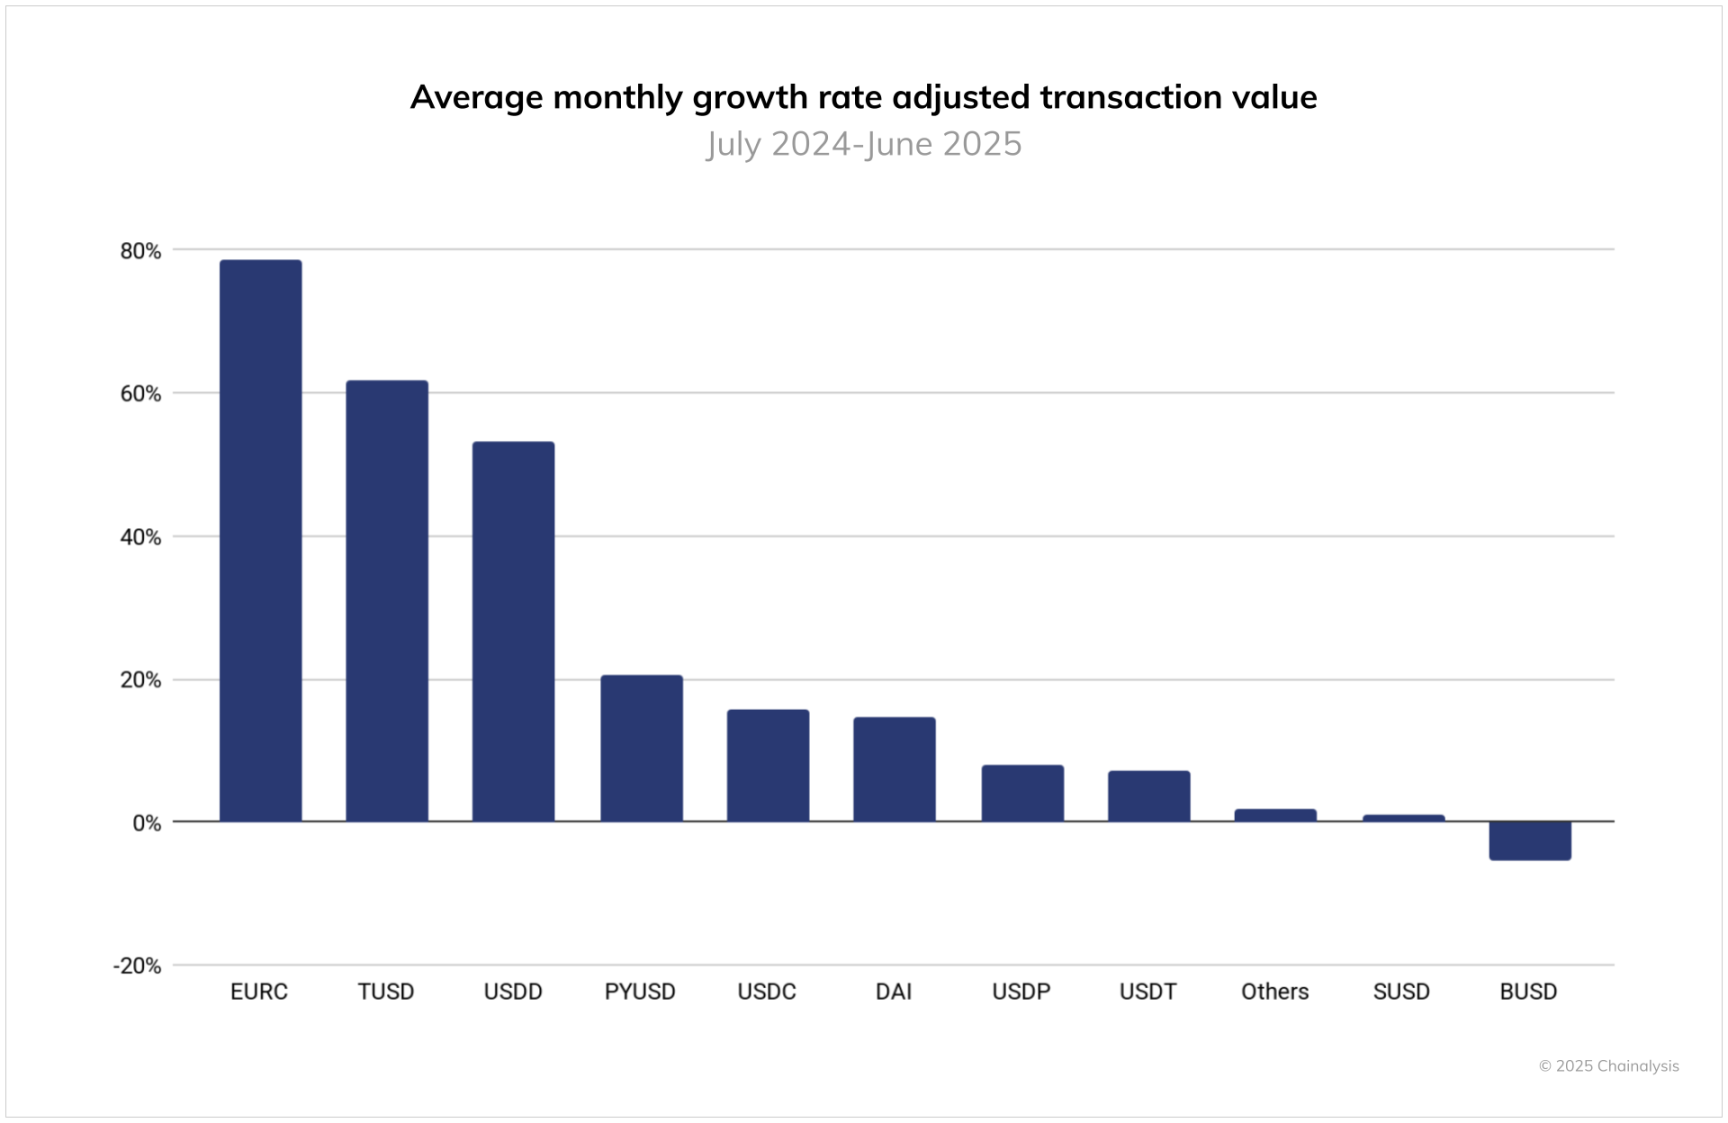
Regionally, these differences may signal evolving usage patterns for stablecoins. USDC’s growth appears closely tied to institutional channels and regulated corridors in the U.S., while EURC’s rise suggests growing interest in euro-denominated digital assets, likely driven by MiCA-compliant platforms and fintech adoption in Europe. PYUSD’s growth may indicate broader demand for other highly regulated stablecoins in retail and payment contexts. These developments suggest the stablecoin landscape is both diversifying and expanding, with local use cases increasingly shaping global transaction volumes.
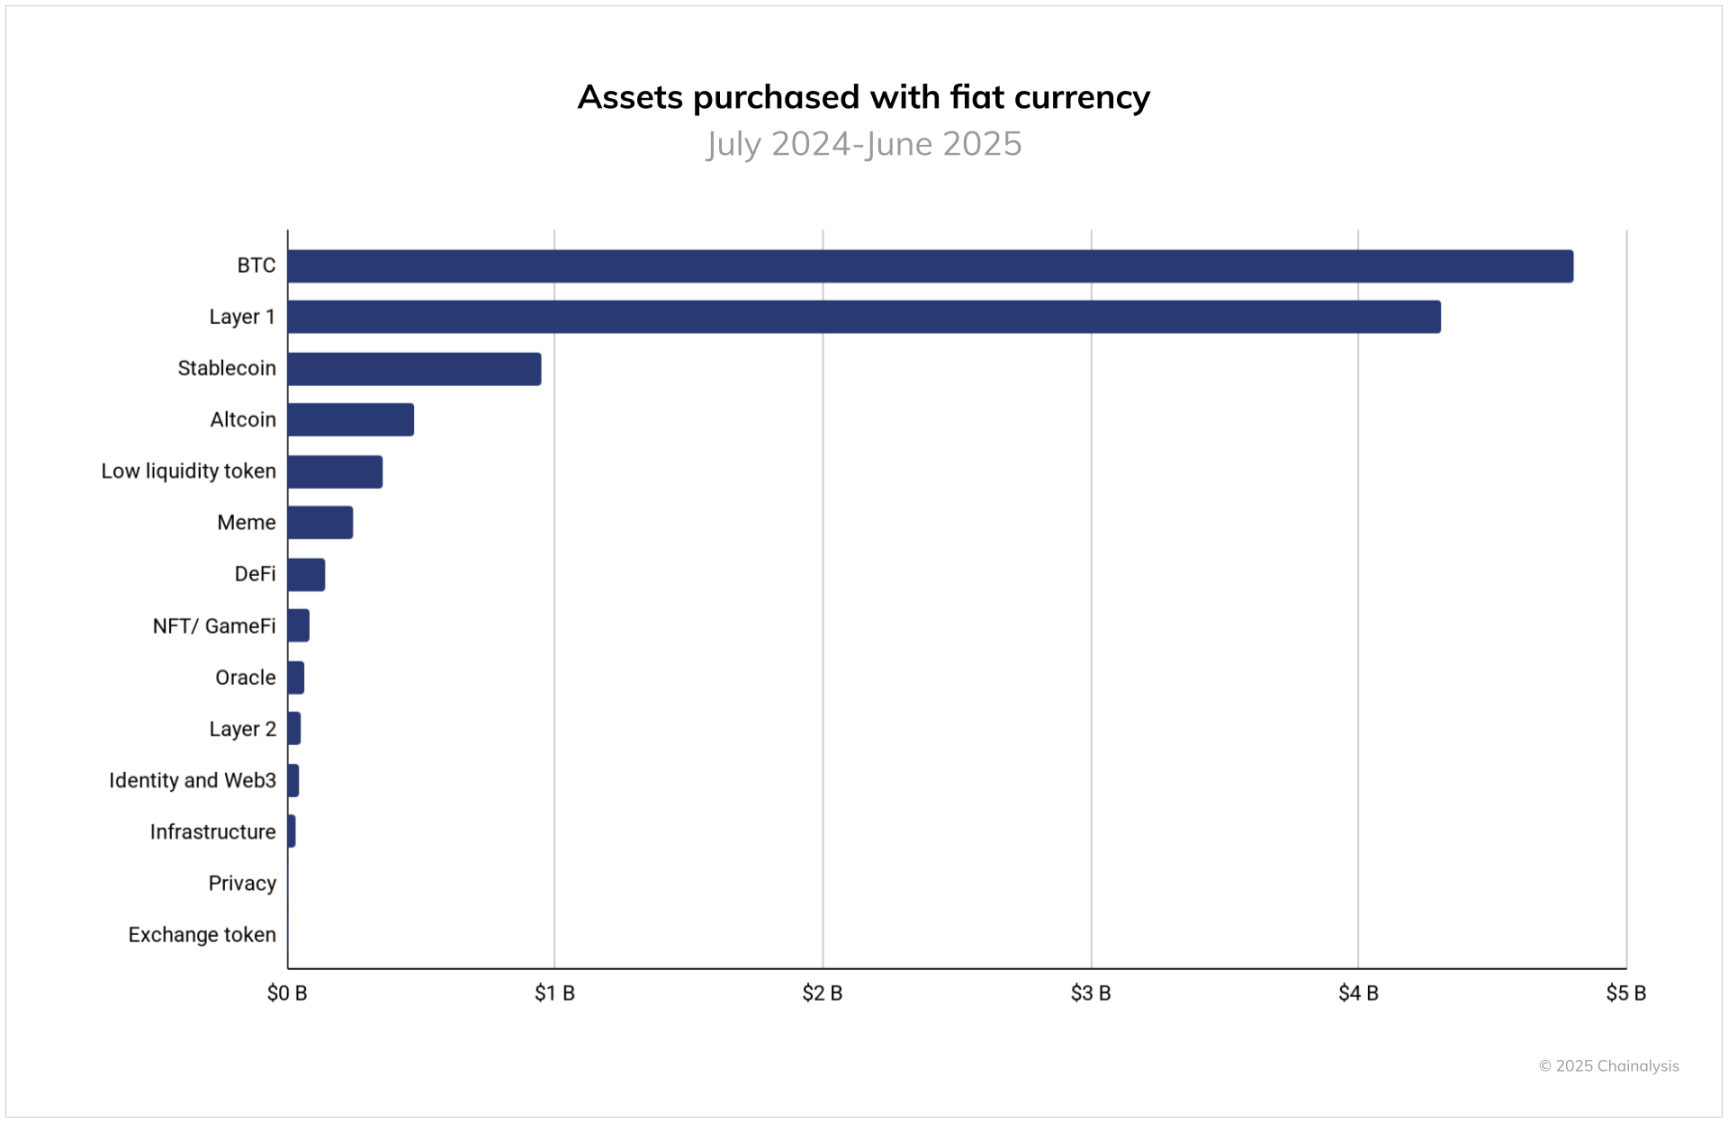
Fiat On-Ramps: Bitcoin Remains the Primary Entry Point
To assess fiat on-ramp behavior, we analyzed purchases made on centralized exchanges between July 2024 and June 2025, where users bought cryptocurrencies using fiat pairs. Each transaction was categorized based on the high-level classification of the purchased asset, allowing us to evaluate which types of tokens serve as primary entry points into crypto.
Bitcoin leads by a wide margin, accounting for over $4.6 trillion in fiat inflows during this period—more than double the second-ranked Layer 1 token (excluding BTC and ETH), which recorded approximately $3.8 trillion in inflows. Stablecoins ranked third with $1.3 trillion, followed by altcoins at around $540 billion. Other categories—including low-liquidity tokens, meme coins, and DeFi—each saw less than $300 billion in fiat inflows.
Geographically, the United States remains the world’s largest fiat on-ramp, with total transaction volume exceeding $4.2 trillion—over four times that of the second-largest country. South Korea follows with over $1 trillion in volume, while the EU records slightly under $500 billion. Bitcoin dominance—the percentage of total fiat purchases allocated to BTC—is especially high in the UK and EU, at approximately 47% and 45% respectively. In contrast, South Korea’s on-ramp activity is more diversified, with Bitcoin representing a smaller share of transaction volume.
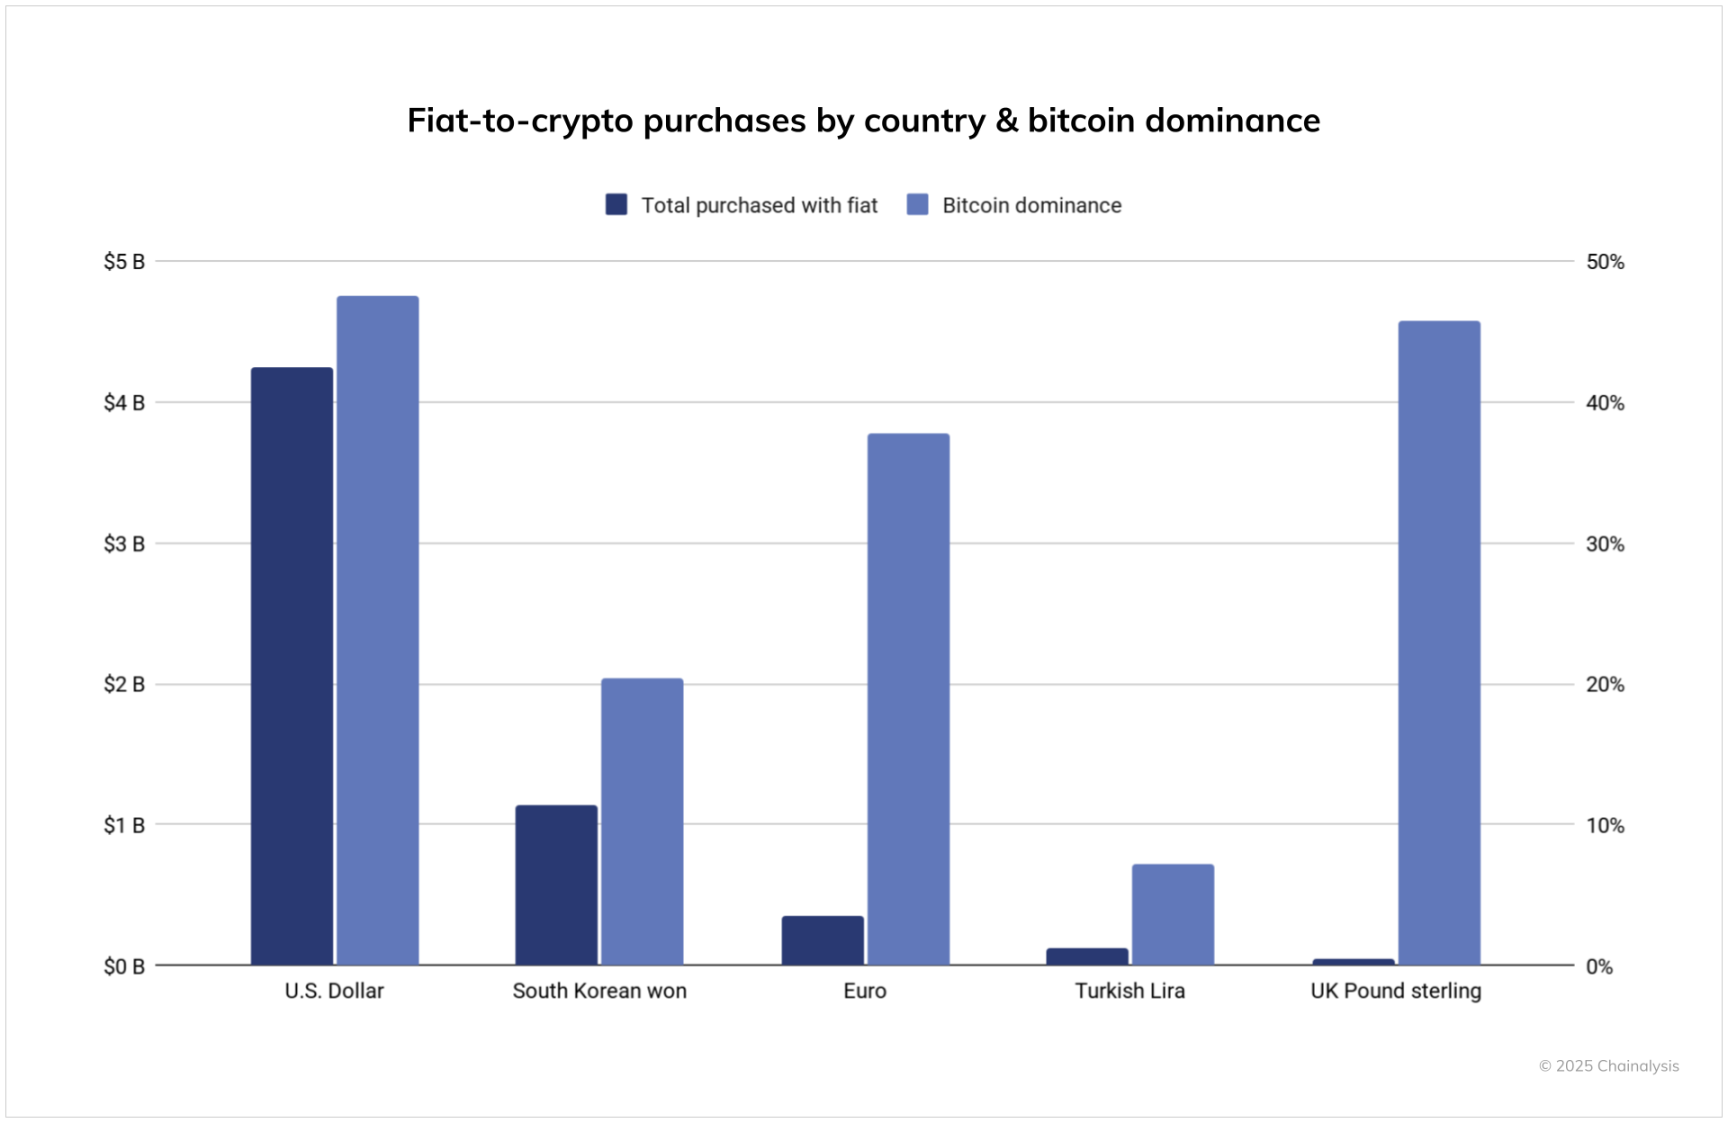
It should be noted that this analysis includes only fiat on-ramp activity on tracked centralized exchanges and does not cover over-the-counter desks, informal markets like hawala, or cash-based crypto shops.
Adoption Spans Nearly All Income Levels
If we break down the Global Adoption Index into quarterly time series and segment it by World Bank income groups, a clear picture emerges: high-income, upper-middle-income, and lower-middle-income groups all reached peaks simultaneously in this report. This synchronicity suggests the current wave of crypto adoption is broad rather than isolated—benefiting both mature markets with clearer rules and institutional frameworks, and emerging markets where remittances, access to U.S. dollars via stablecoins, and mobile-first finance continue to accelerate adoption. In other words, crypto adoption is truly global.
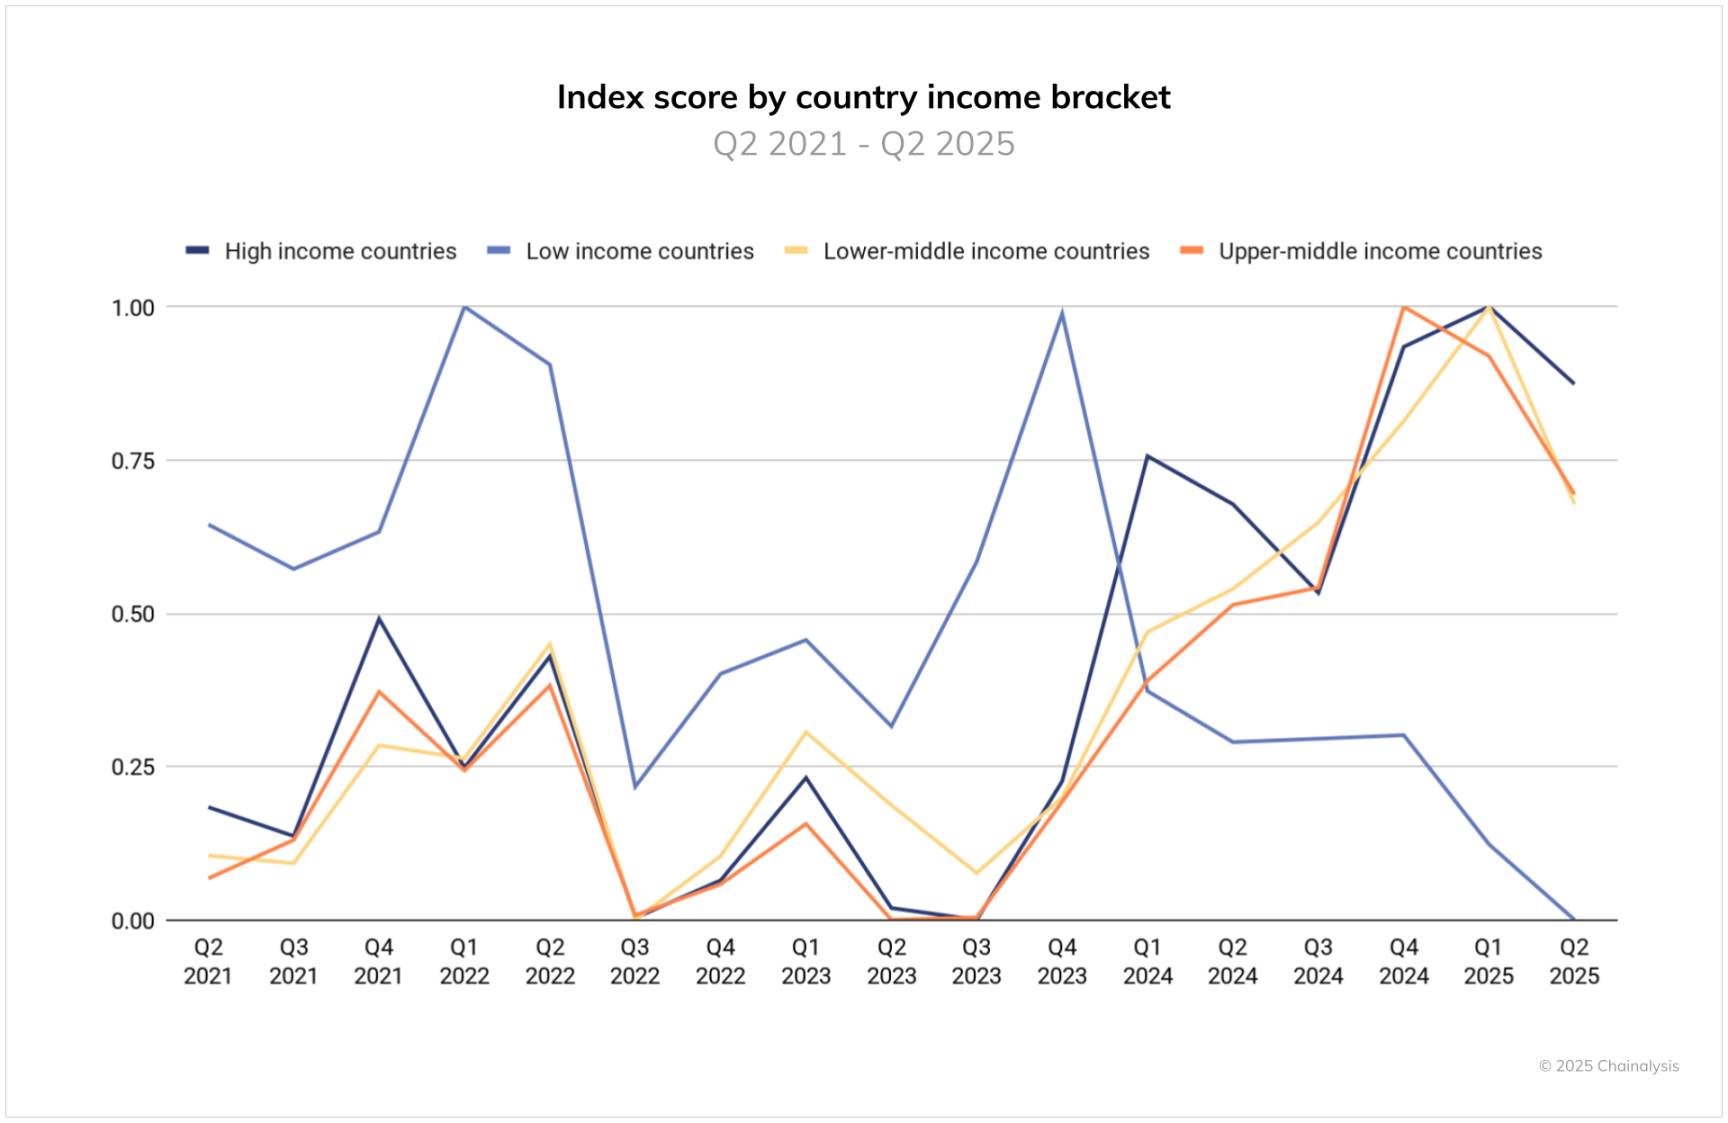
One important caveat exists for the low-income group. This category includes several countries where you wouldn’t typically expect sustained heavy crypto usage, and this composition introduces greater volatility: brief surges followed by pullbacks. These fluctuations are driven by factors such as policy shocks, liquidity constraints, and conflict-related disruptions. For example, Afghanistan—a low-income country—saw all crypto activity temporarily vanish after the U.S. withdrawal in 2021, according to Chainalysis. The global peak signal is real, but trends in low-income countries are more fragile and unstable; sustainable growth there will depend on improved on-ramps, regulatory transparency, and basic financial and digital infrastructure.
Join TechFlow official community to stay tuned
Telegram:https://t.me/TechFlowDaily
X (Twitter):https://x.com/TechFlowPost
X (Twitter) EN:https://x.com/BlockFlow_News