Bitcoin drops to $95K to buy the dip?
TechFlow Selected TechFlow Selected
Bitcoin drops to $95K to buy the dip?
Current spot demand is neutral, while perpetual contracts are bearish.
Written by: CryptoVizArt, UkuriaOC, Glassnode
Translated by: AididiaoJP, Foresight News
Bitcoin is trading near $111,000, testing a key support zone between $107,000 and $108,900. A rebound toward $113,600 may face persistent selling pressure, while a deeper decline could target $93,000–$95,000. Current unrealized losses remain shallow, spot demand is neutral, and perpetual contracts show mildly bearish positioning.
Summary
-
Bitcoin has pulled back to $111,000, with support anchored in the cost basis cluster of $93,000–$110,000. A break below $107,000–$108,900 could open downside space, targeting $93,000–$95,000.
-
Short-term holders remain under pressure, meaning any rebound toward $113,600 may encounter resistance as they sell into strength.
-
Unrealized and realized losses remain shallow, far from previous bear market extremes, indicating limited capitulation so far.
-
Spot demand has normalized to neutral, while perpetual futures lean bearish with funding rates showing fragile neutrality.
Filling the Gap
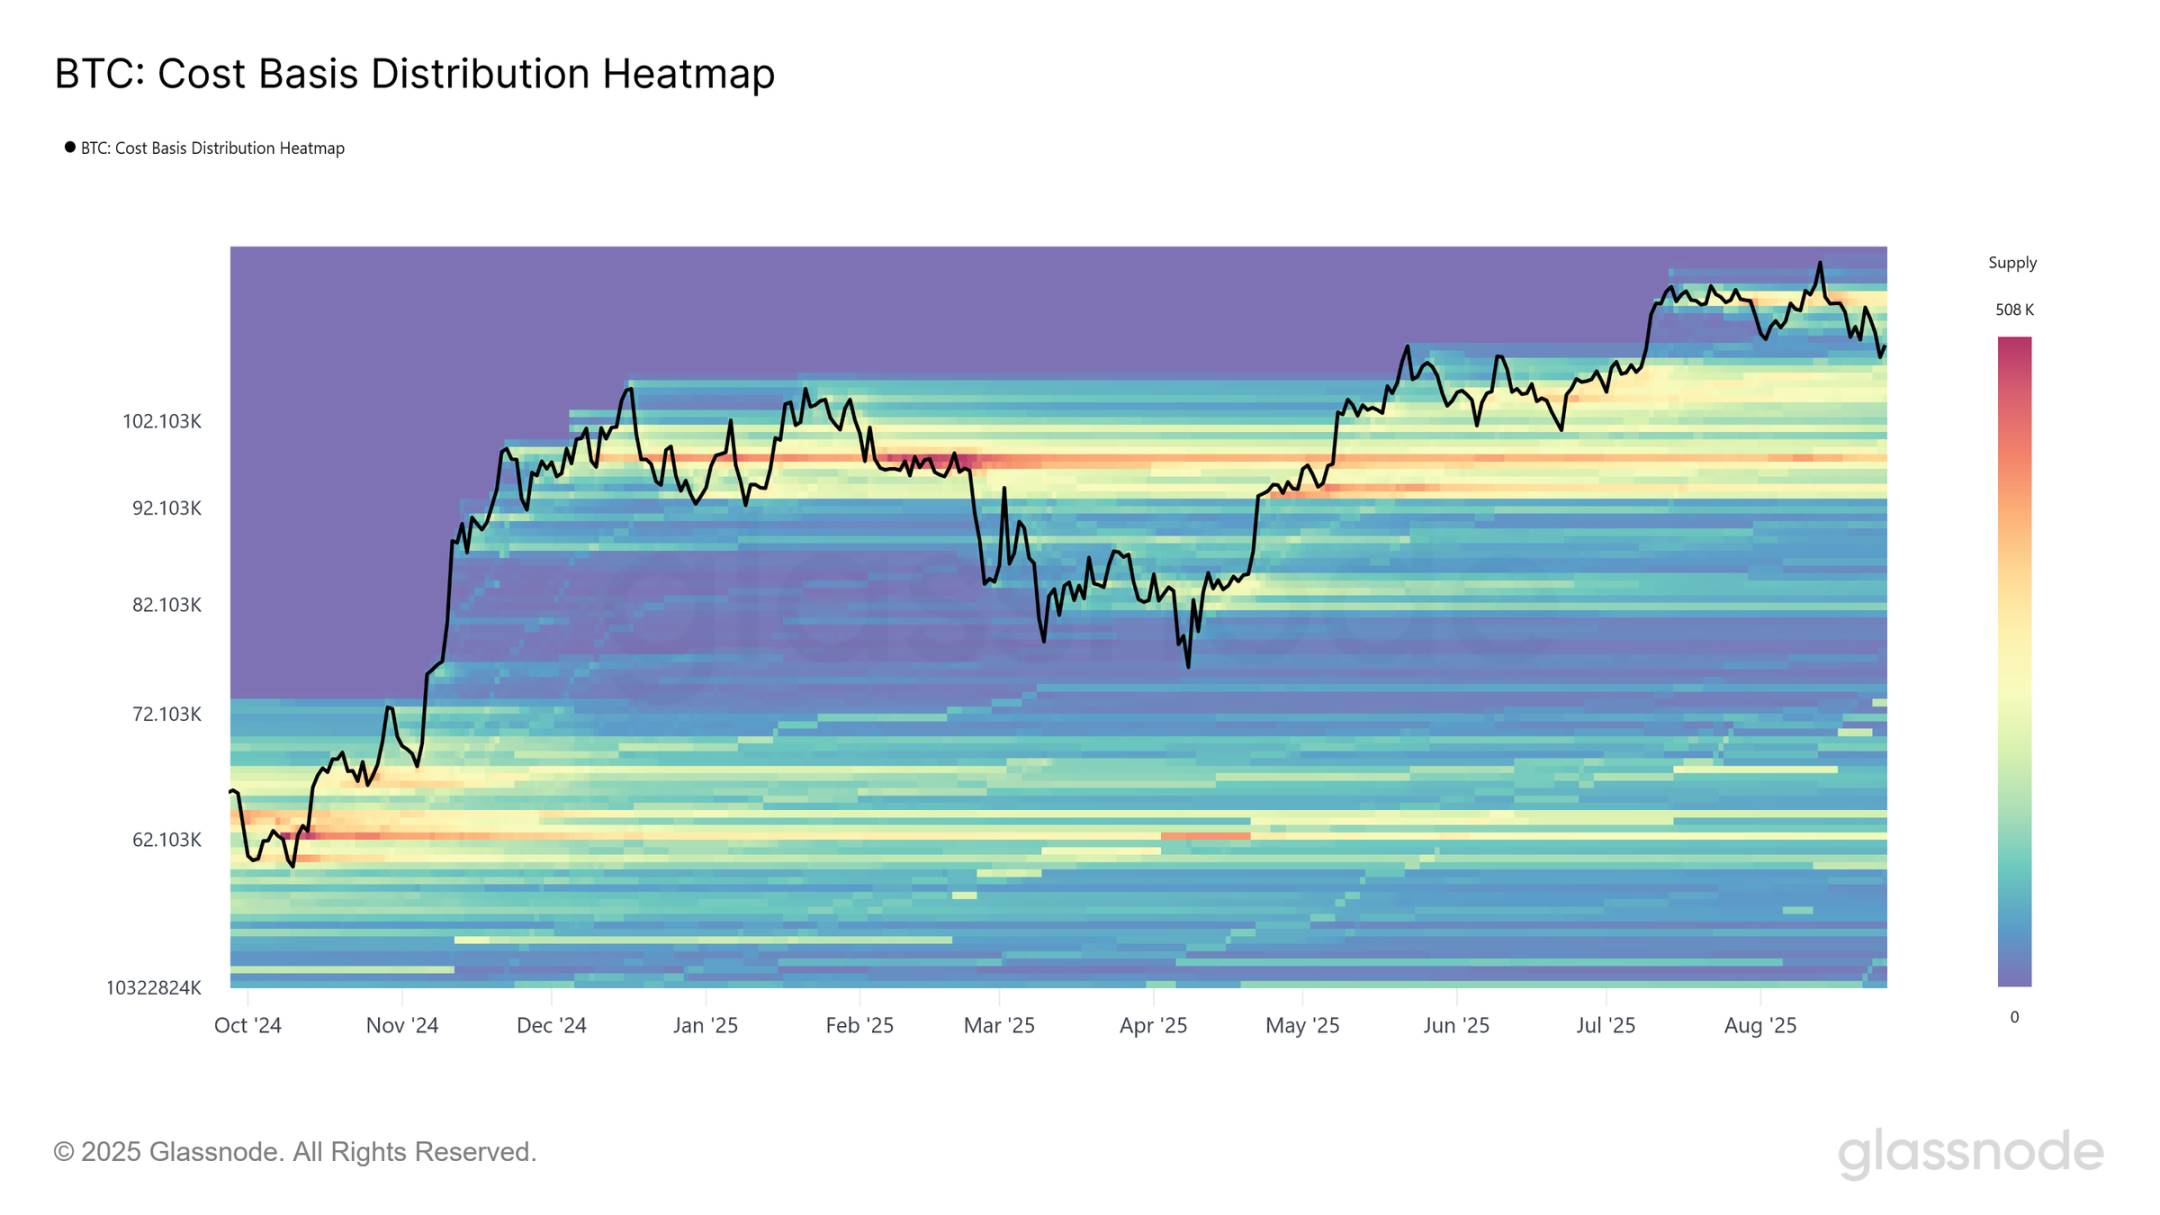
The market enters the second week of retracing from its all-time high of $124,000, raising the question: Is this merely a brief pause or the start of a deeper correction? To answer this, we turn to price models, starting with the Cost Basis Distribution (CBD) heatmap.
The CBD heatmap visualizes supply concentration across different acquisition prices, highlighting where tokens last moved significantly. Each colored band reflects dense cost basis zones that often act as natural support or resistance levels.
Bitcoin is currently trading near $111,000, hovering just above the lower edge of the "price gap." The recent pullback has allowed supply to be redistributed at discounted prices, gradually filling the gap. Notably, a thick supply cluster formed between $93,000 and $110,000 since December 2024, increasingly acting as a potential bottoming zone.
This accumulation helps explain the ongoing resilience above $110,000, suggesting further correction would require either significant short-term selling pressure or prolonged lack of demand sufficient to force these investors into capitulation.
Testing New Buyers' Patience
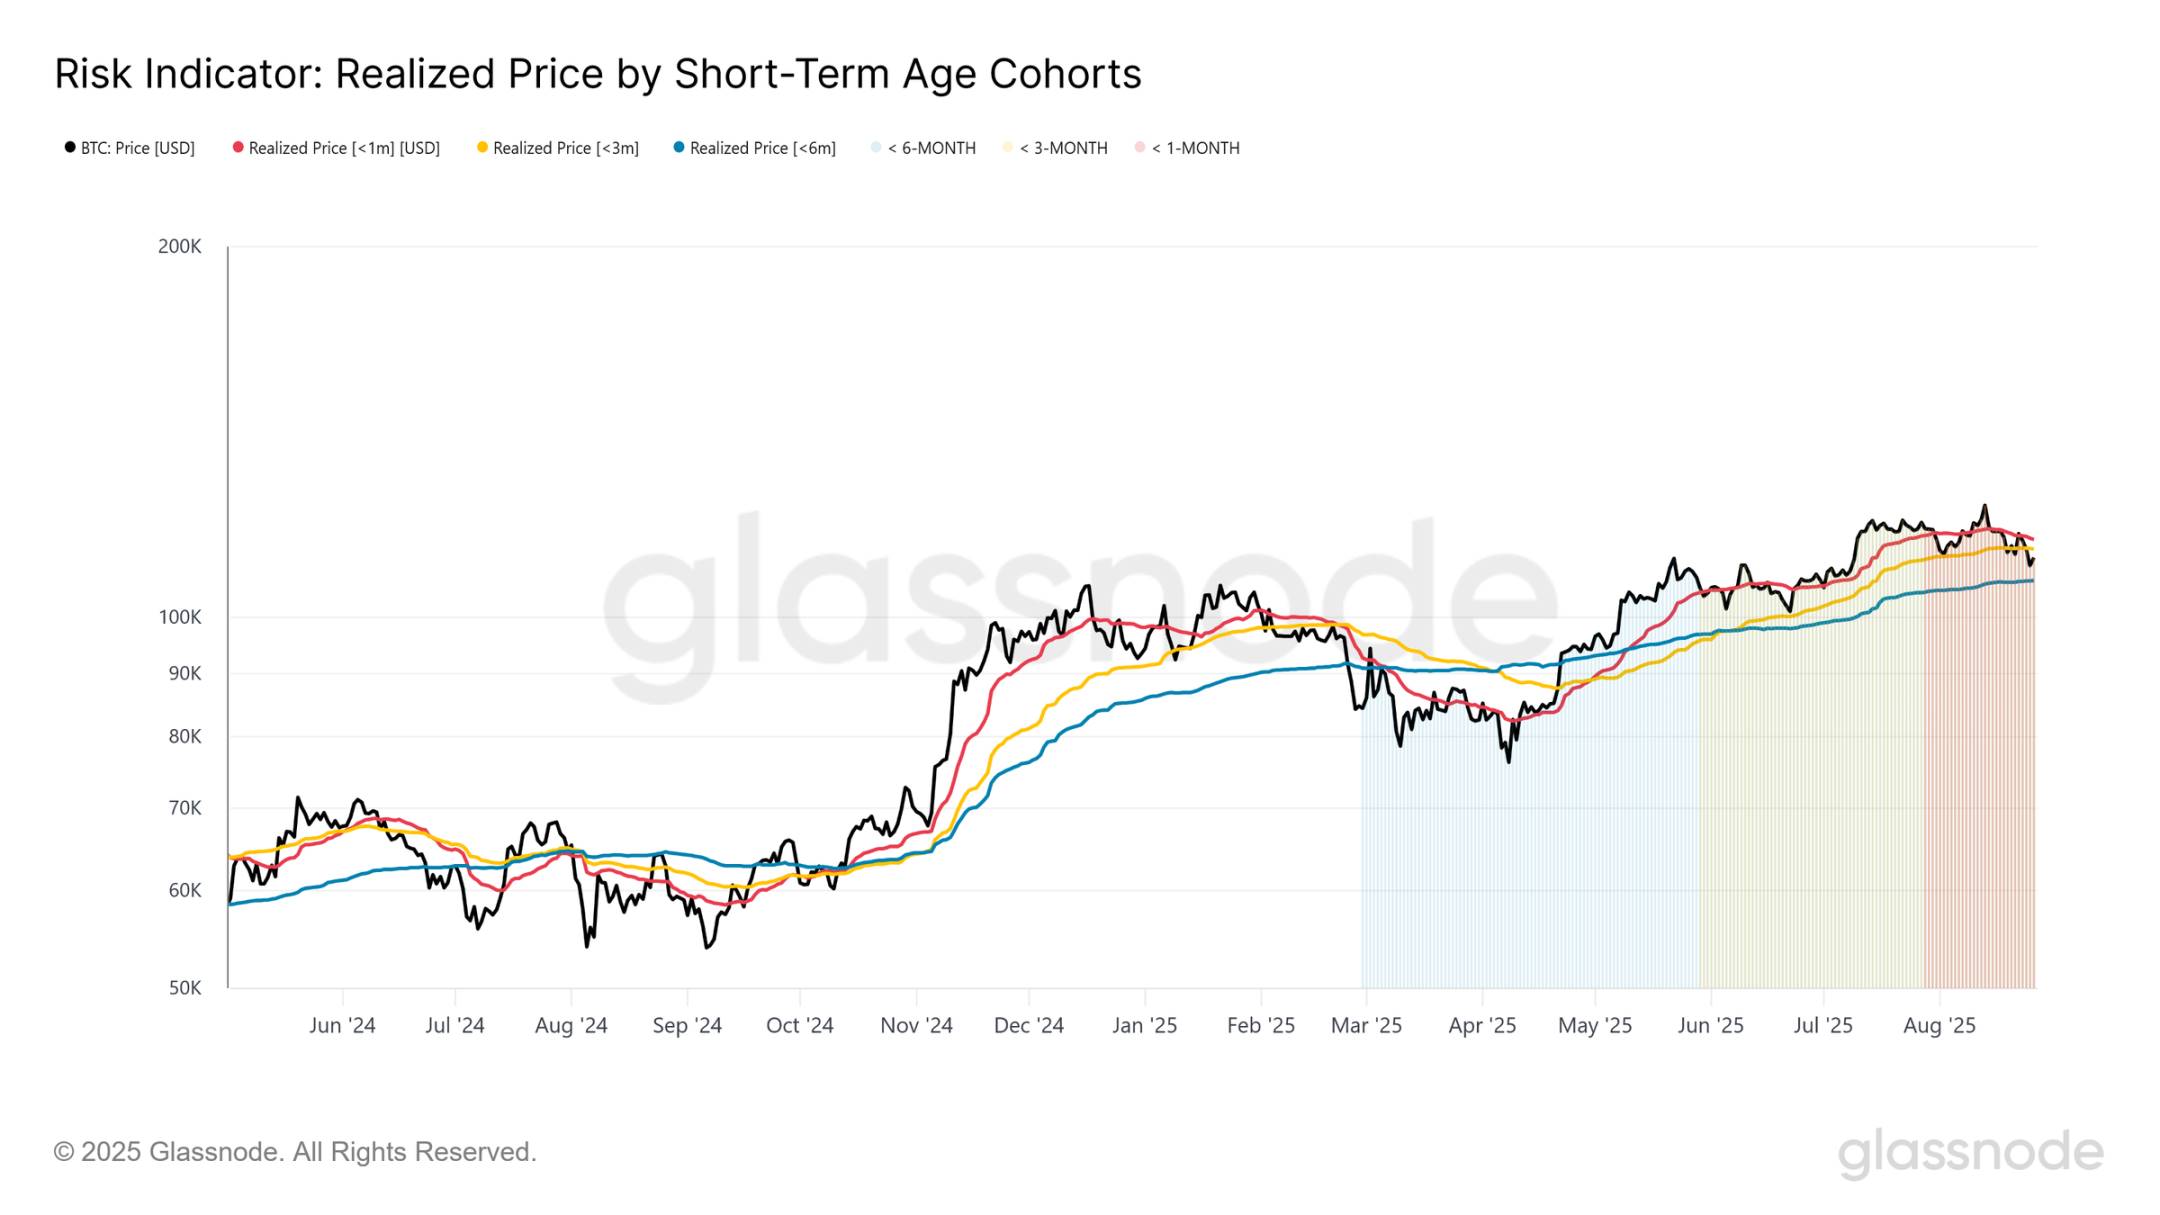
To better gauge market sentiment, we examine the cost basis of recent investors. This metric captures the average acquisition price of holders who entered within the past 1 to 6 months, serving as a psychological benchmark. When prices trade below these levels, it typically indicates new holders are in unrealized loss, which may trigger selling pressure.
Currently, Bitcoin trades below the cost basis of 1-month ($115,600) and 3-month ($113,600) holders, placing them under pressure. As such, any relief rally may face resistance as short-term holders seek to exit at breakeven.
More critically, the 6-month cost basis sits around $107,000. Sustained trading below this level could spark fear and accelerate downward momentum, pointing toward the lower edge of the support cluster highlighted in the CBD heatmap.
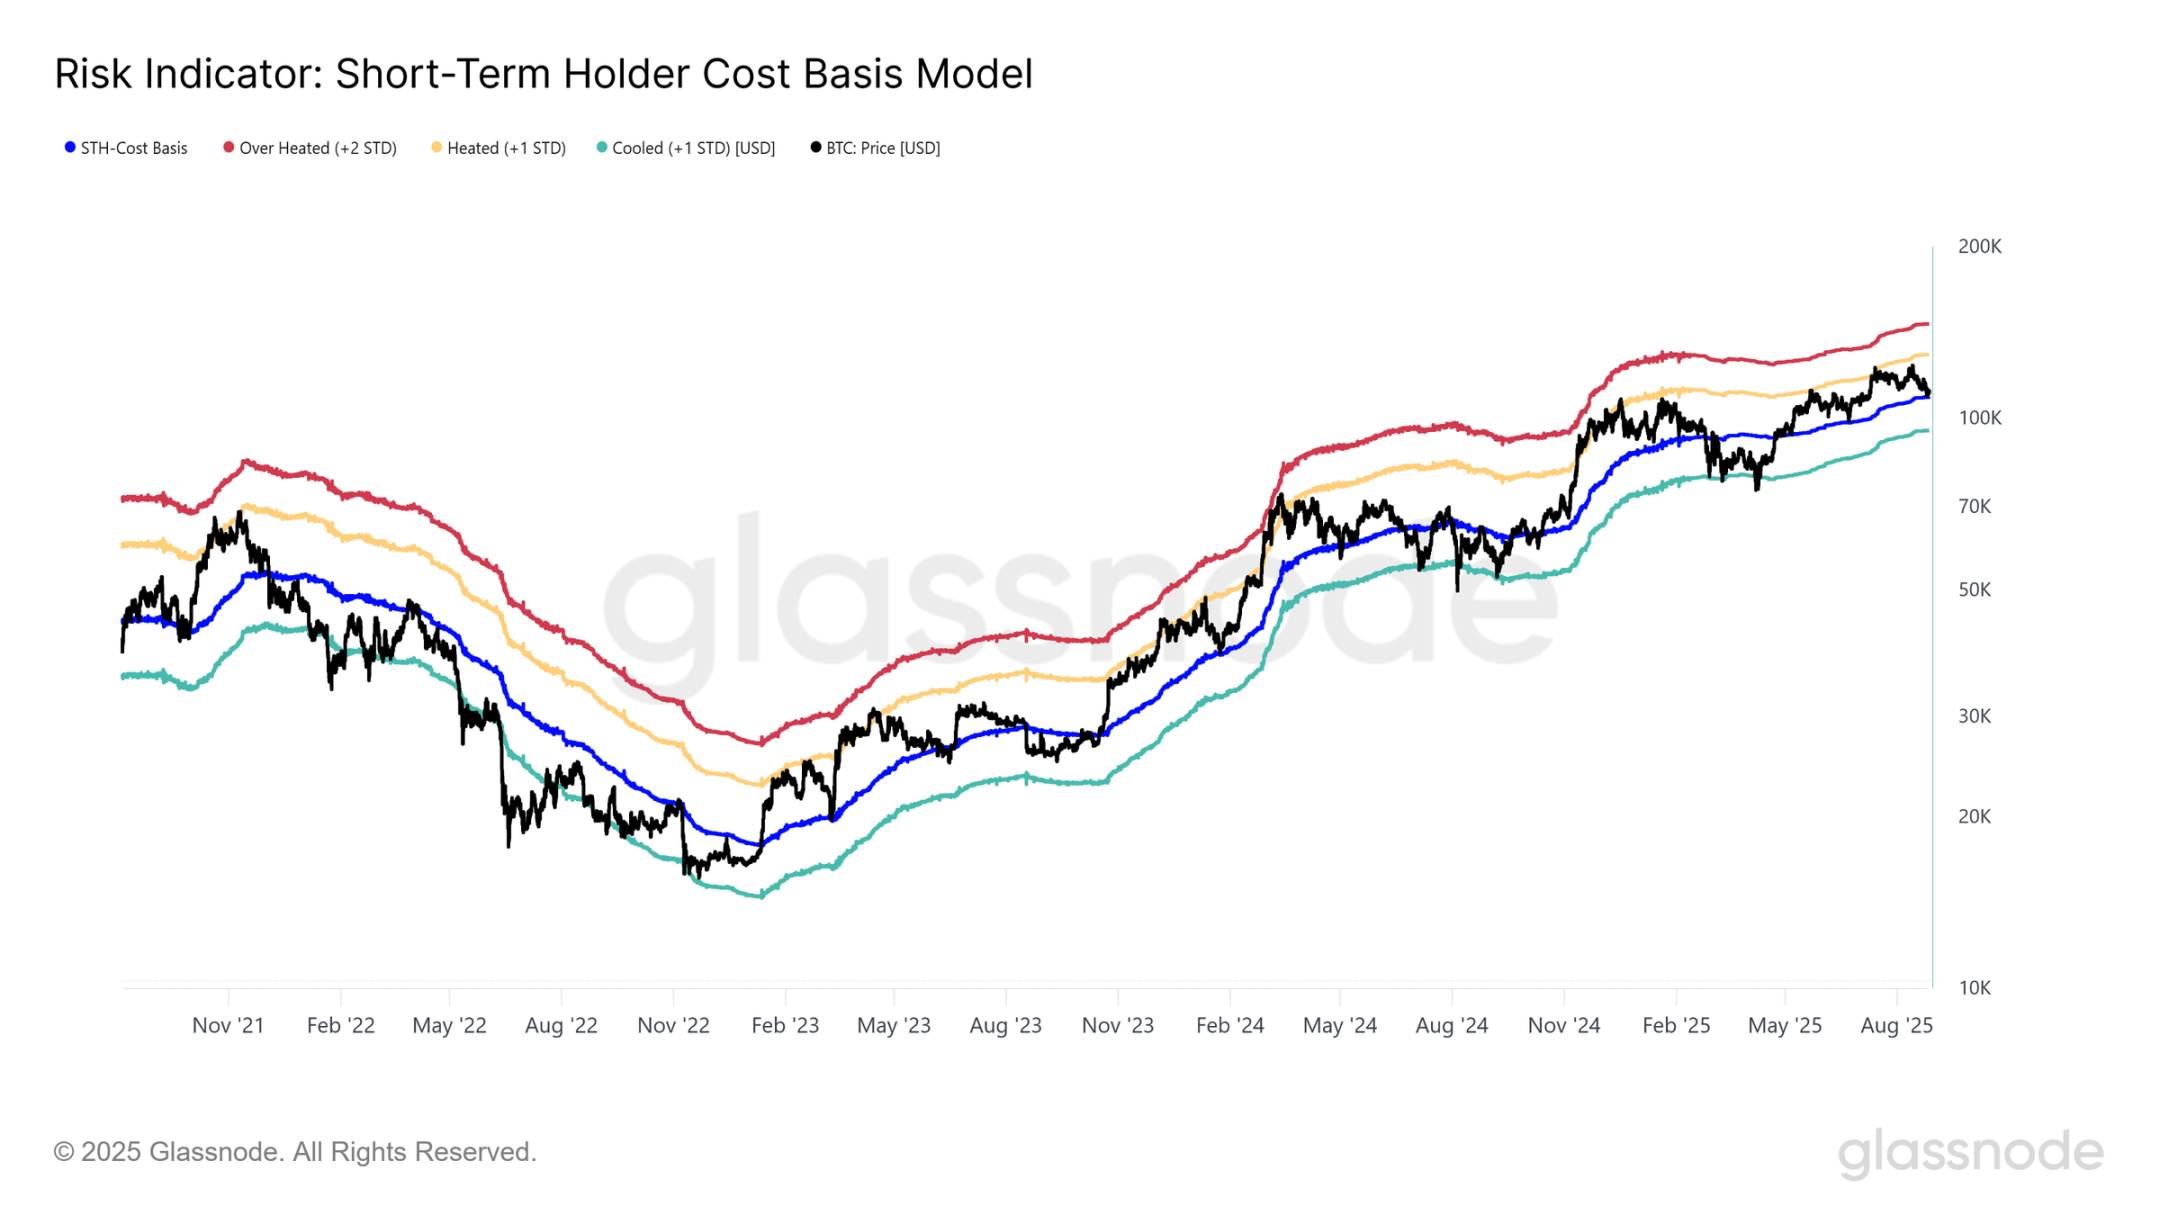
Medium-Term Risks
If current weakness persists and price continues trading below the short-term holder cost basis near $108,900, history suggests caution. In prior cycles, such breaks often signaled the beginning of multi-month bearish phases as newer investors sold amid growing unrealized losses.
Using 4-year statistical bands to frame this risk, previous bearish corrections typically bottomed near one standard deviation below the short-term holder cost basis. For this cycle, that lower bound is estimated around $95,100. Therefore, if Bitcoin fails to regain footing above the $107,000–$108,900 threshold, the medium-term range for a potential bottom may settle in the $93,000–$95,000 region—consistent with the dense support cluster earlier identified in the CBD heatmap.
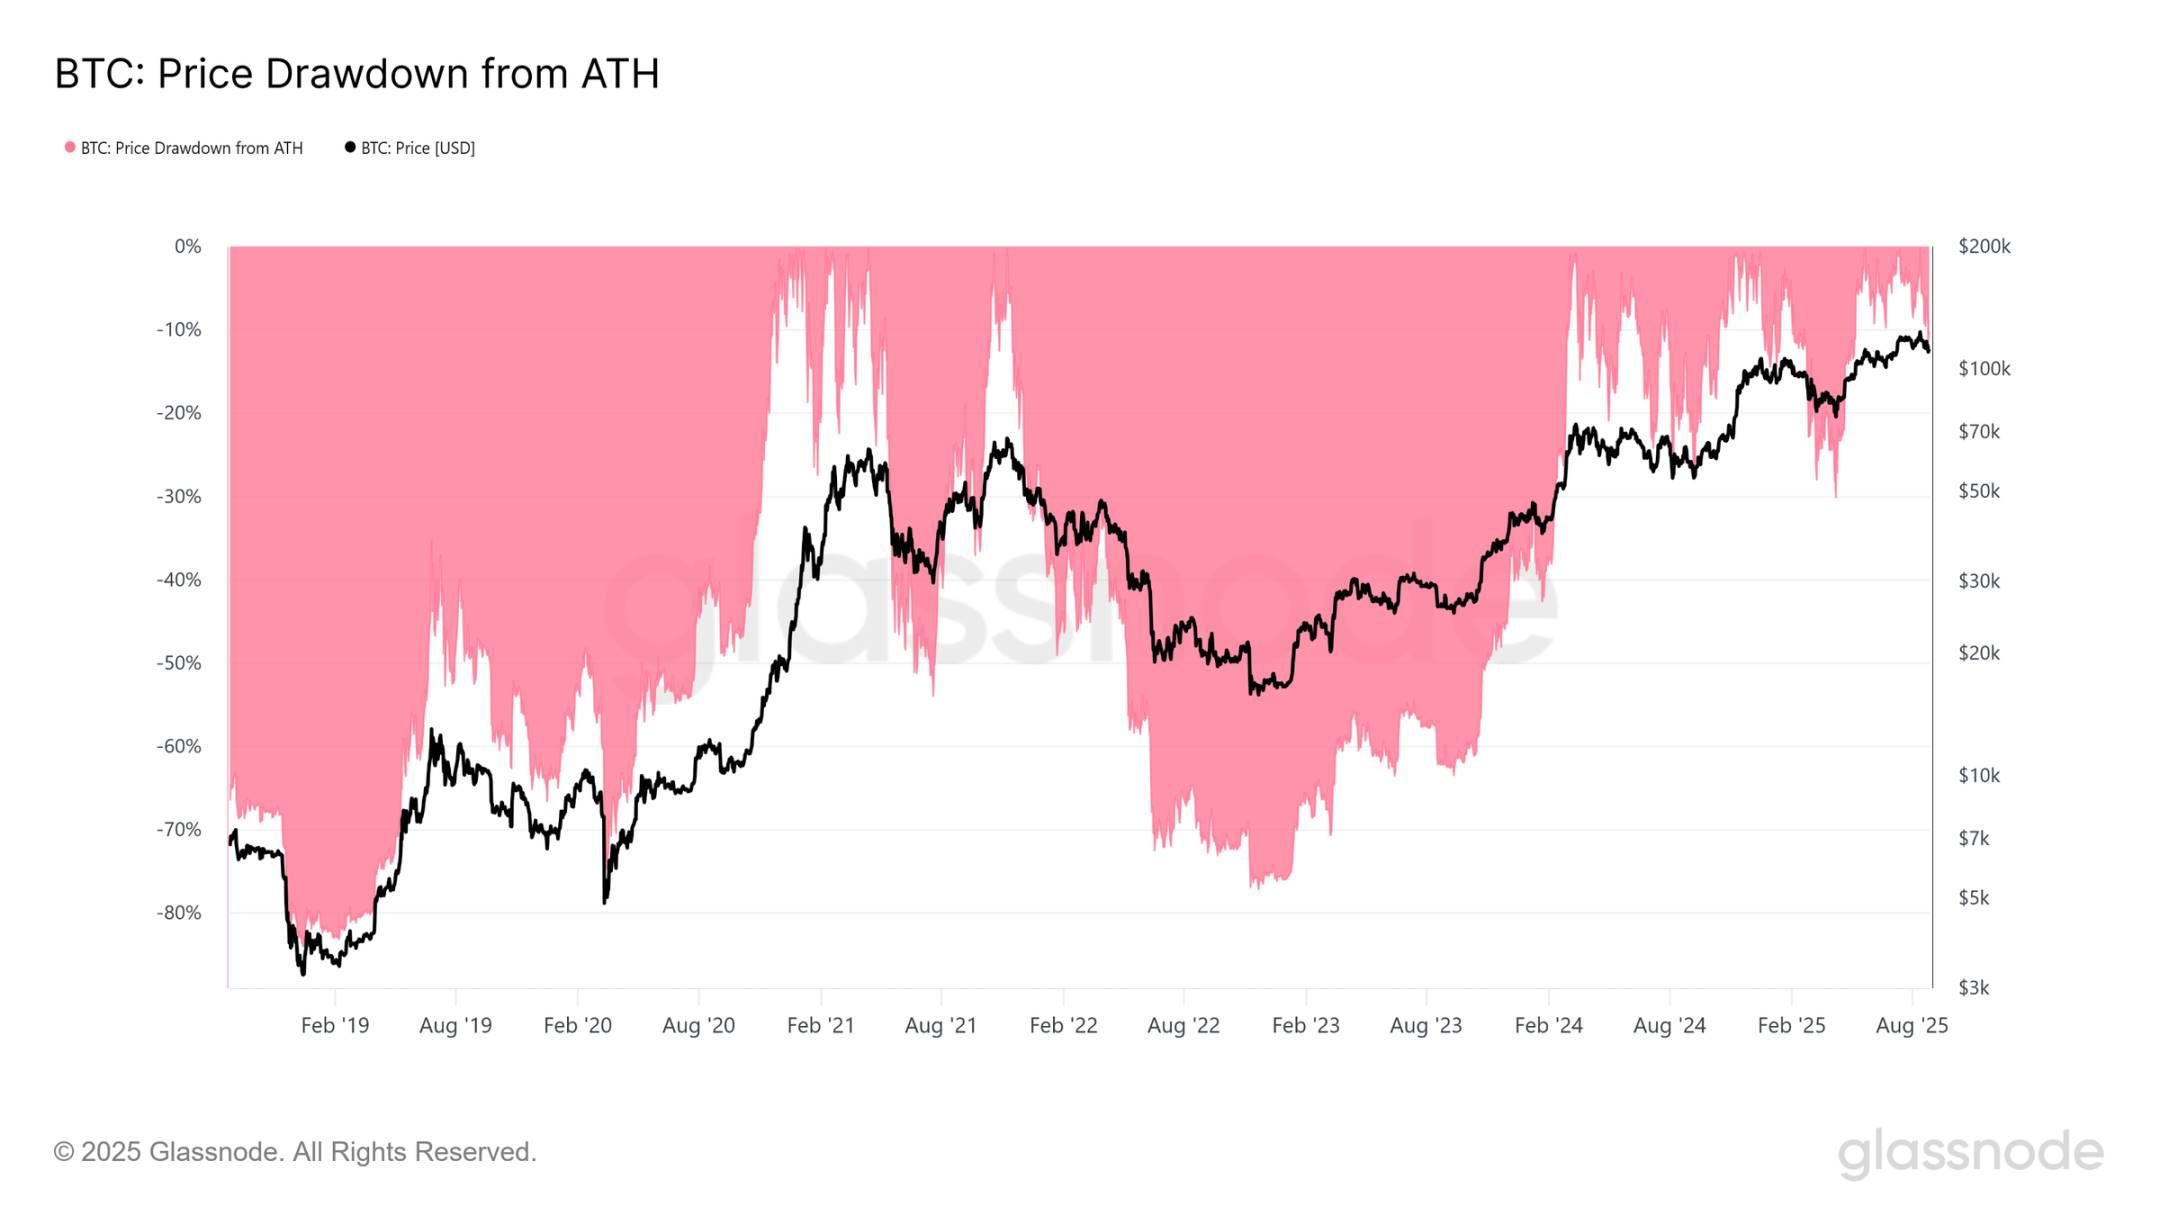
Past Cyclical Bear Markets
To contextualize the current pain level, we can compare today’s market structure against previous cyclical extremes. Historically, bear markets have been marked by severe drawdowns that either defined mid-cycle resets or full-blown capitulation events.
So far, the recent dip to $110,100 represents an approximately 11.4% retracement from the $124,000 all-time high. Compared to prior mid-cycle bear markets (typically exceeding 25%) or deep cyclical lows (drawdowns greater than 75%), the current decline is notably mild. In this context, the intensity of the current correction remains relatively shallow and does not yet resemble the stress conditions seen during historical extremes.
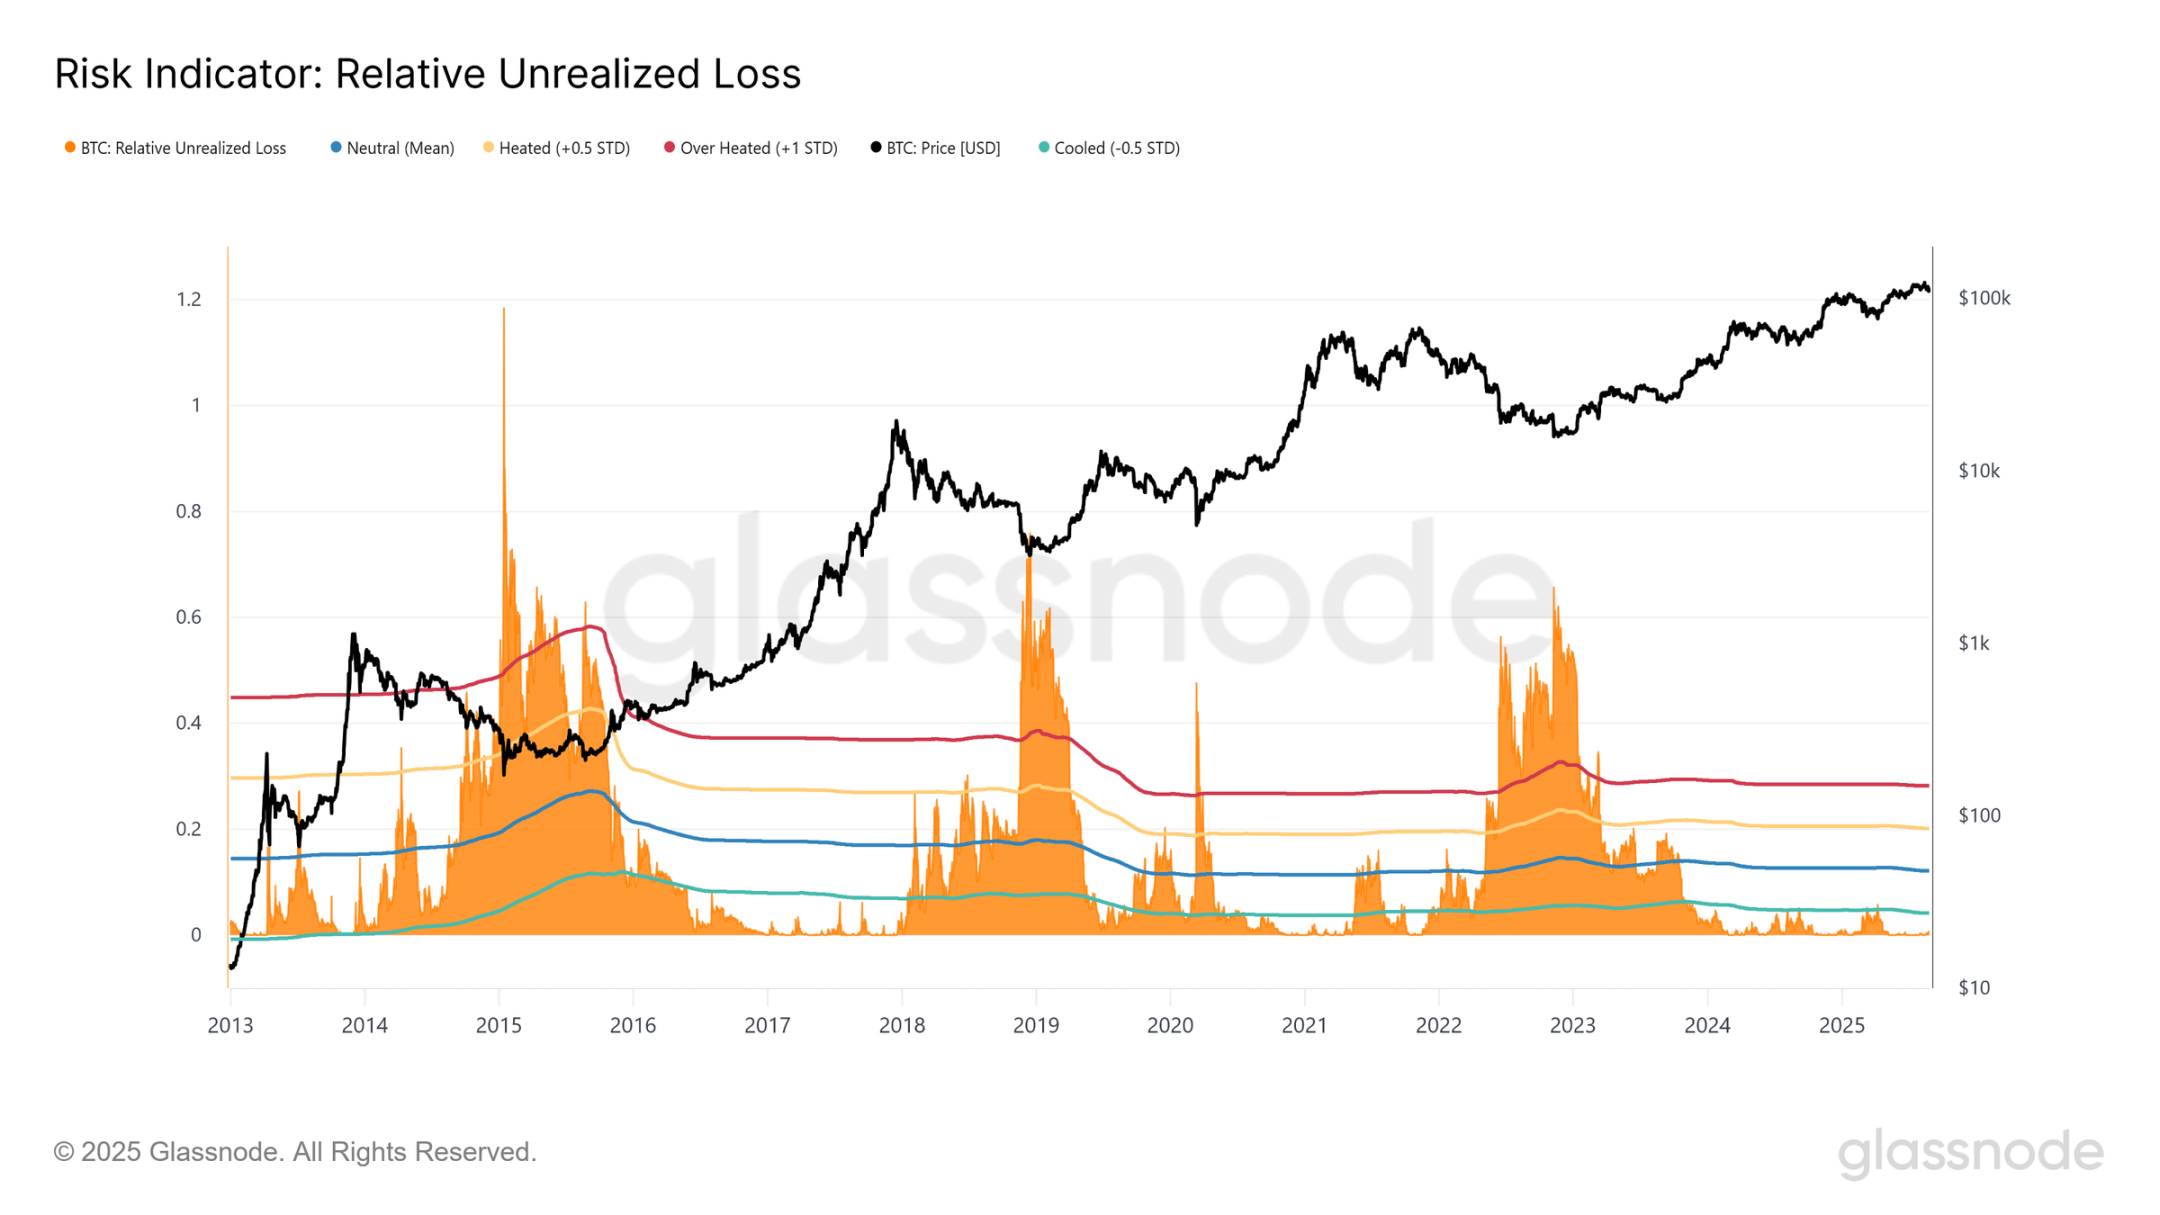
Measuring Pain via Unrealized Loss
Another way to assess the current correction is relative unrealized loss, which measures the share of total market loss relative to market capitalization. This metric highlights the scale of investor stress compared to prior cycles.
Since November 2023, relative unrealized loss has mostly remained below the -0.5 standard deviation level, around 5%, never approaching the depths observed during the prolonged bear markets of 2018–2020 or 2022–2023.
Currently, with Bitcoin trading near $111,000, the metric stands at just 0.5%, far below the loss levels (>30%) typically associated with deep bear market phases. This perspective reinforces the earlier conclusion: although the recent pullback has frustrated short-term holders, the overall magnitude of unrealized pain remains far from historical extremes.
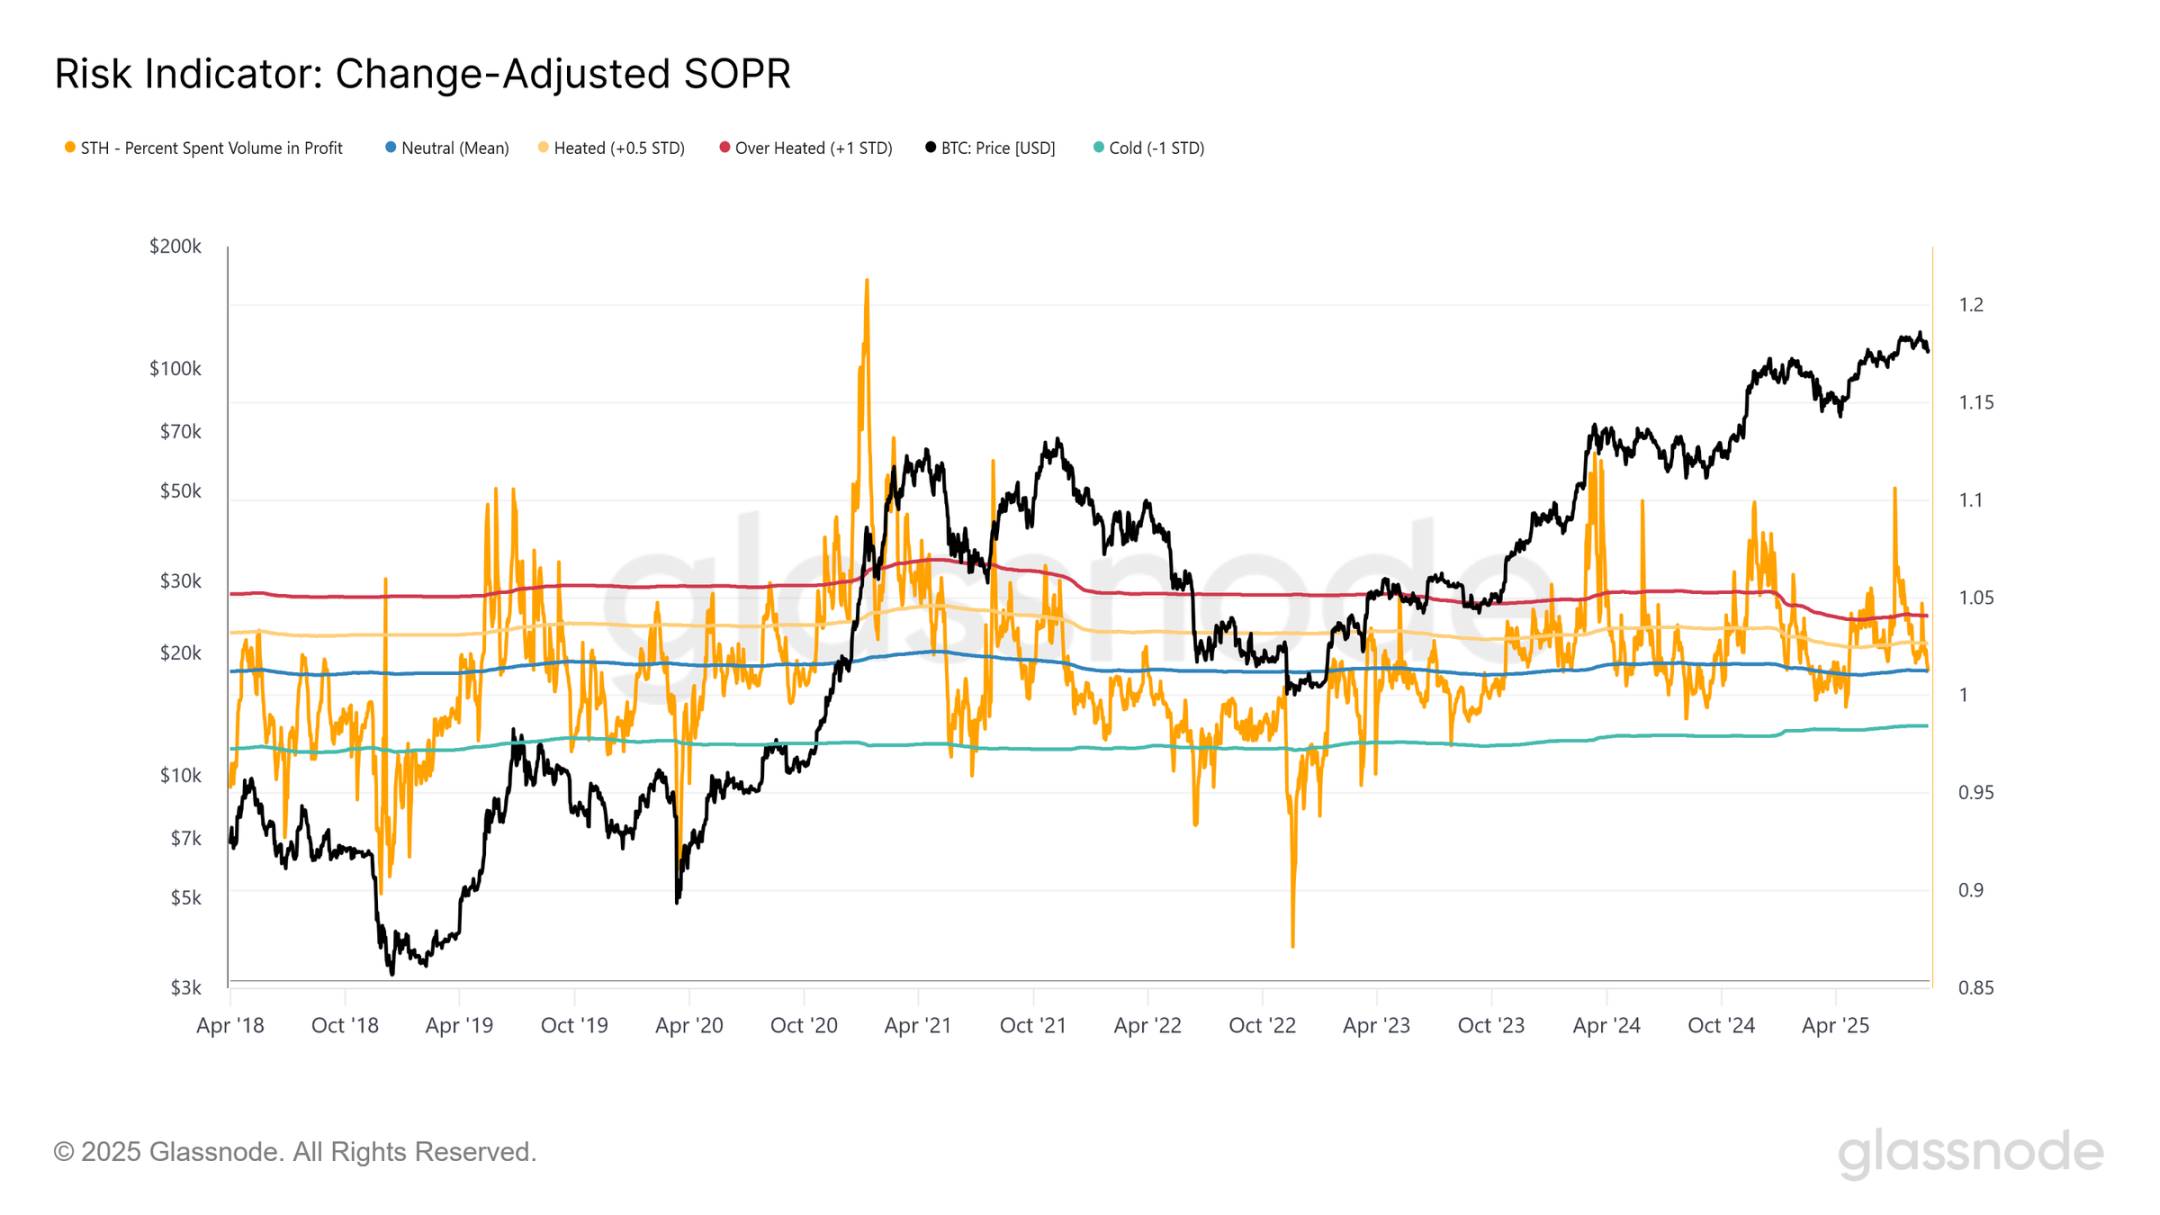
Realized Selling Pressure
While unrealized loss offers insight into investor stress, it's equally important to observe how much of these paper losses are actually being realized on-chain. Spent Output Profit Ratio (SOPR) provides this insight by measuring the ratio of spending price to cost basis. Values above 1 indicate profits are being realized, while values below 1 mean tokens are being sold at a loss—a sign of capitulation.
Currently, the 7-day moving average of adjusted SOPR (filtered for internal transfers) hovers near the neutral value of 1. This suggests most active investors are realizing neither significant profit nor loss, signaling uncertainty.
Historically, cyclical bottoms are only confirmed when this indicator falls below 0.98, marking widespread capitulation across the market. The absence of such a signal indicates that despite rising anxiety, the market has not yet experienced the depth of loss realization that defines true bear market bottoms.
Spot Market Neutralization
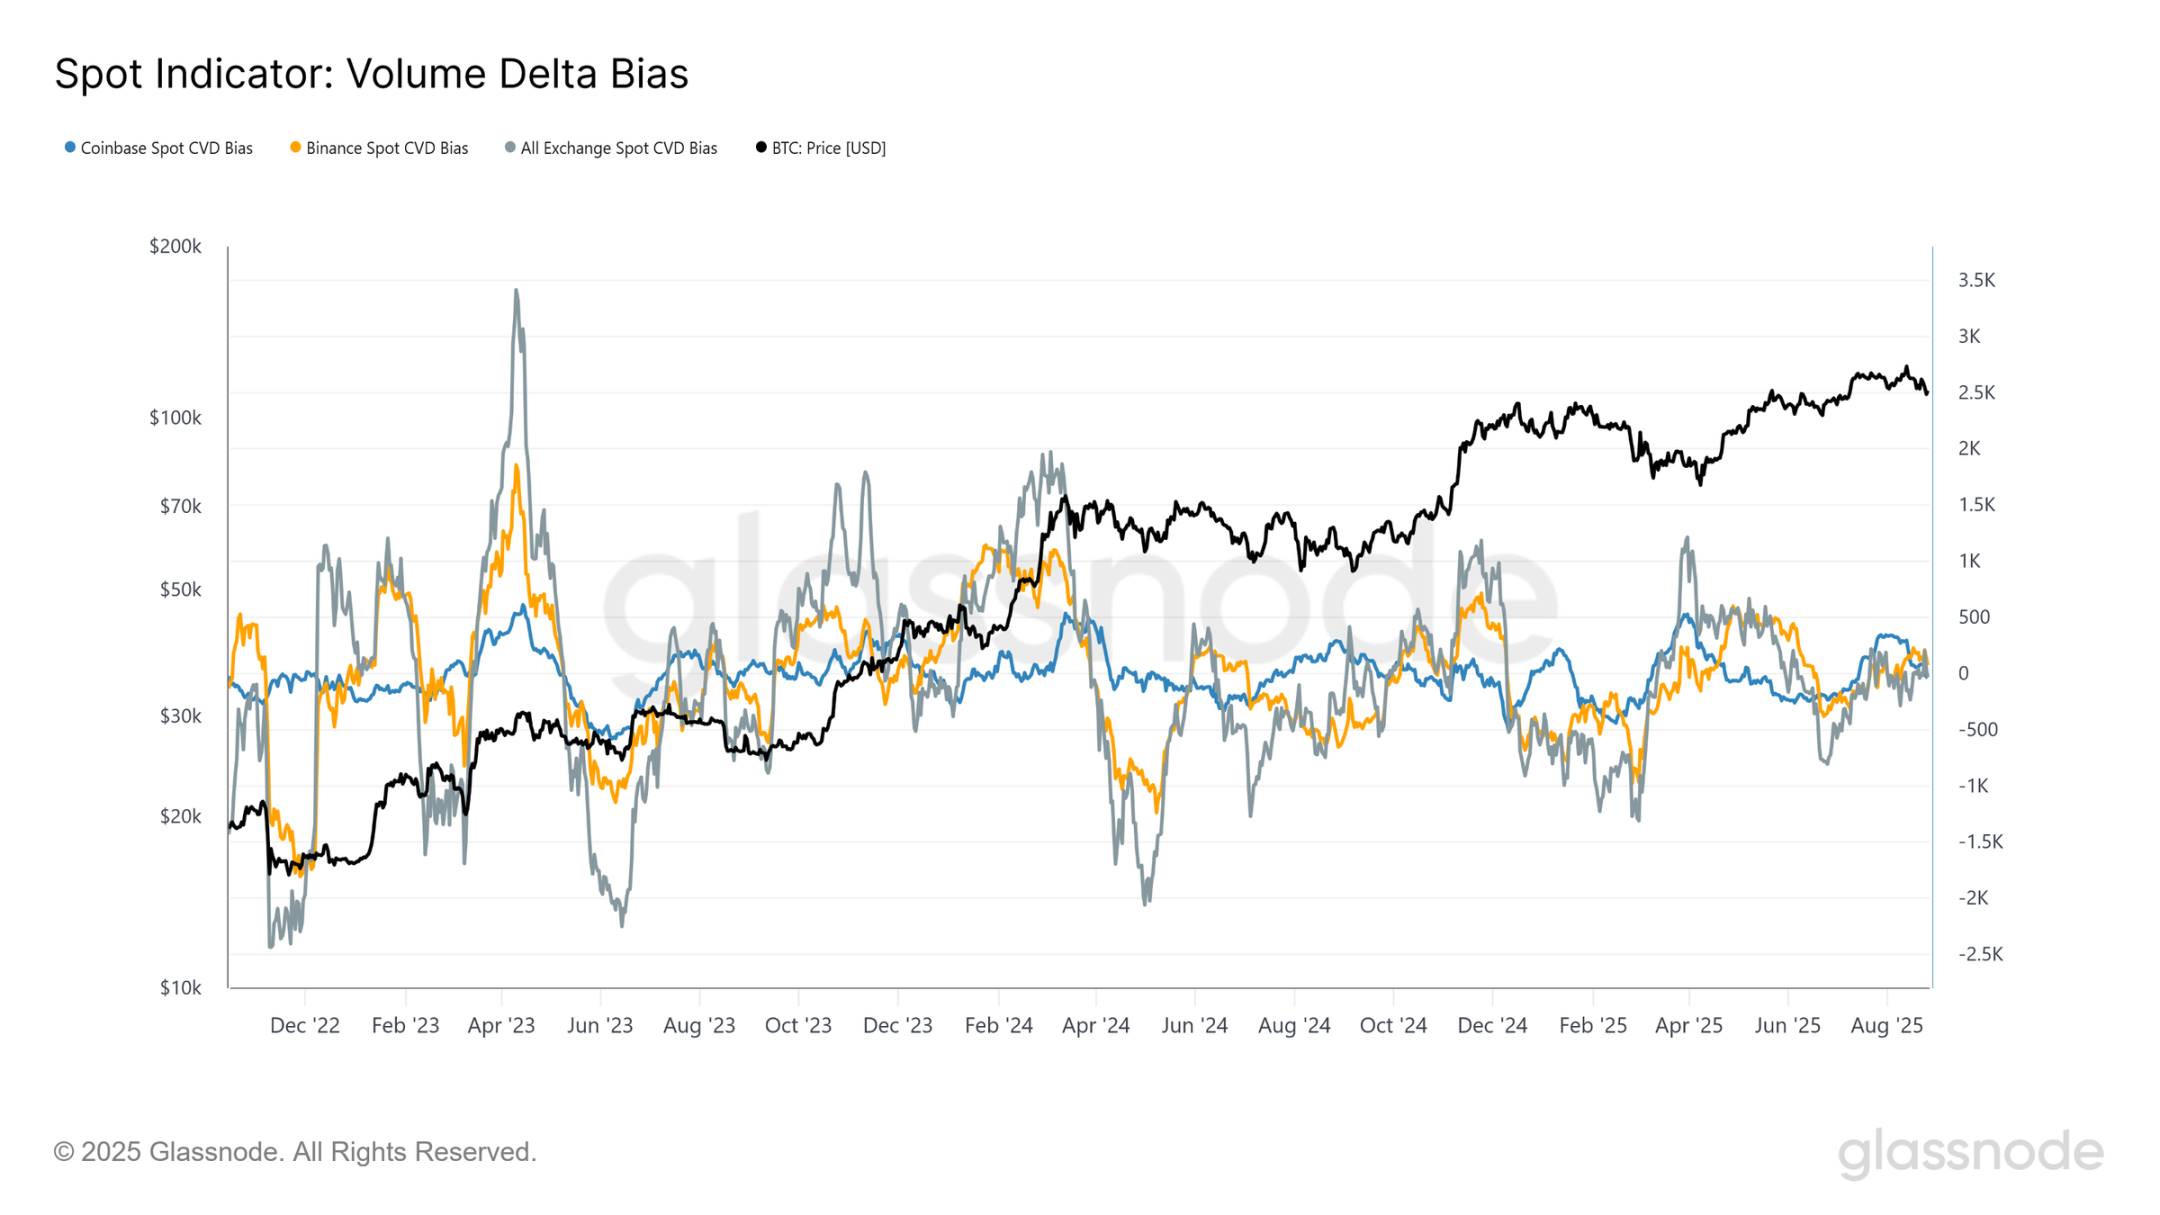
After establishing statistical boundaries for potential price outcomes through on-chain analysis, we can now shift to off-chain data to evaluate sentiment from the perspective of exchange order books. A useful lens is Cumulative Volume Delta (CVD), which tracks the net difference between trades initiated by buyers and sellers, then aggregates this imbalance into a cumulative signal.
To measure shifts in spot market behavior, we compare the 30-day moving average of CVD against its 180-day median. On major venues like Coinbase and Binance, as well as aggregated exchange flows, this bias has recently converged toward zero. This marks a notable shift from the strong buying pressure observed in April 2025, which drove the rebound from $72,000. While small positive readings in July helped fuel the move up to $124,000, the broader trend now reflects neutralized spot sentiment, indicating weakening conviction among buyers at current levels.
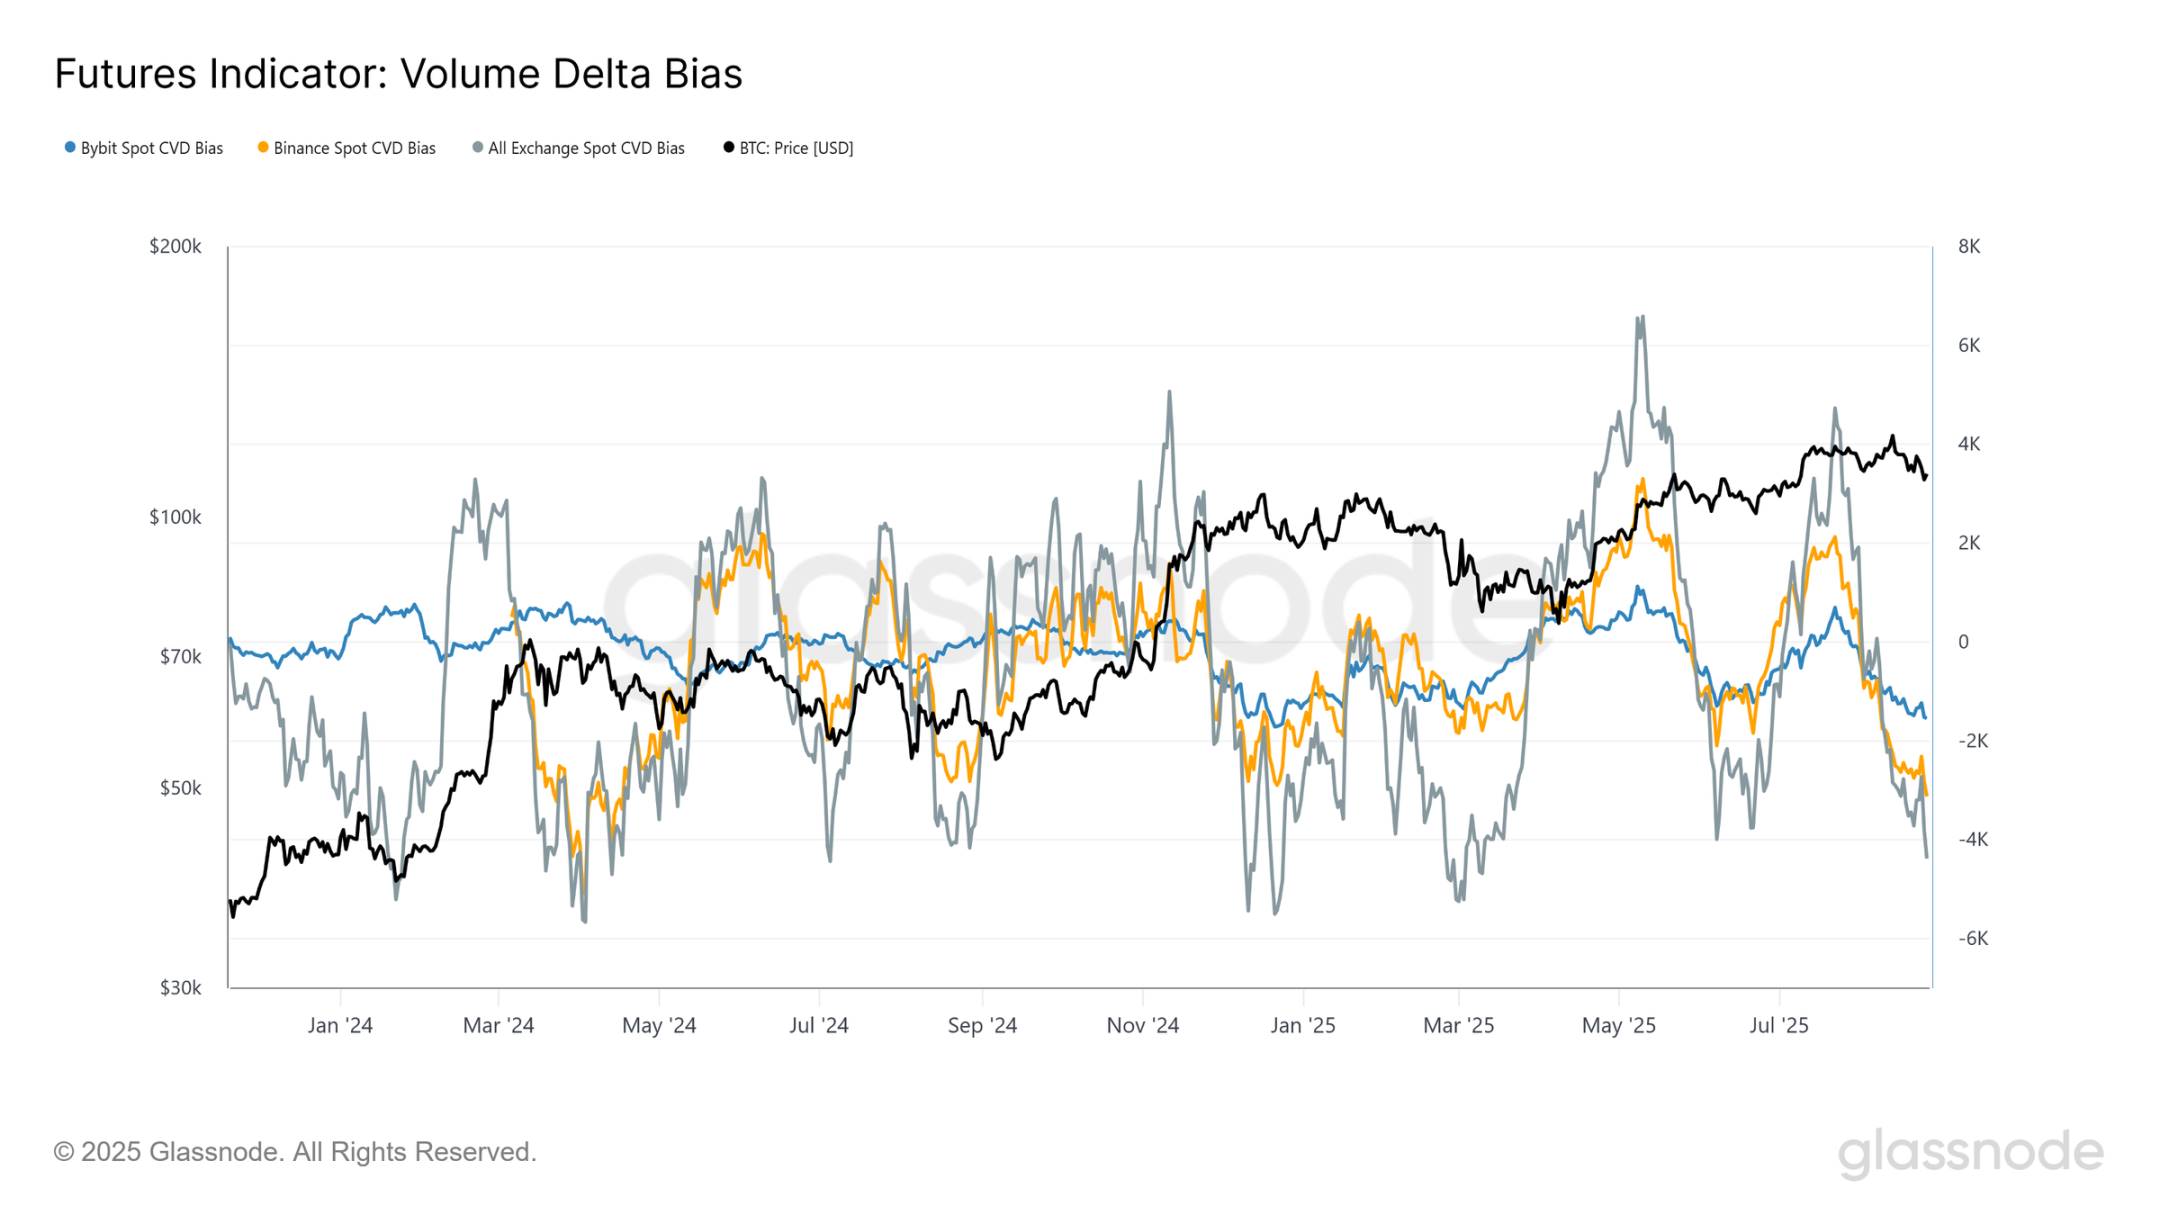
Perpetual Contracts Lean Bearish
In contrast to the neutral tone in the spot market, the situation in perpetual futures has decisively turned bearish. Since July, CVD bias on Binance, Bybit, and aggregated exchanges has declined into negative territory, indicating increasing imbalance in selling pressure. This suggests that perpetual traders—often the more speculative segment of the market—have favored short positions during the recent pullback.
That said, the indicator is highly volatile and frequently reaches extreme buy or sell pressure levels over short periods. While the current bias highlights growing bearish momentum, it should be closely monitored to determine whether this negativity represents a sustained trend or merely a transient fluctuation within perpetual contracts.
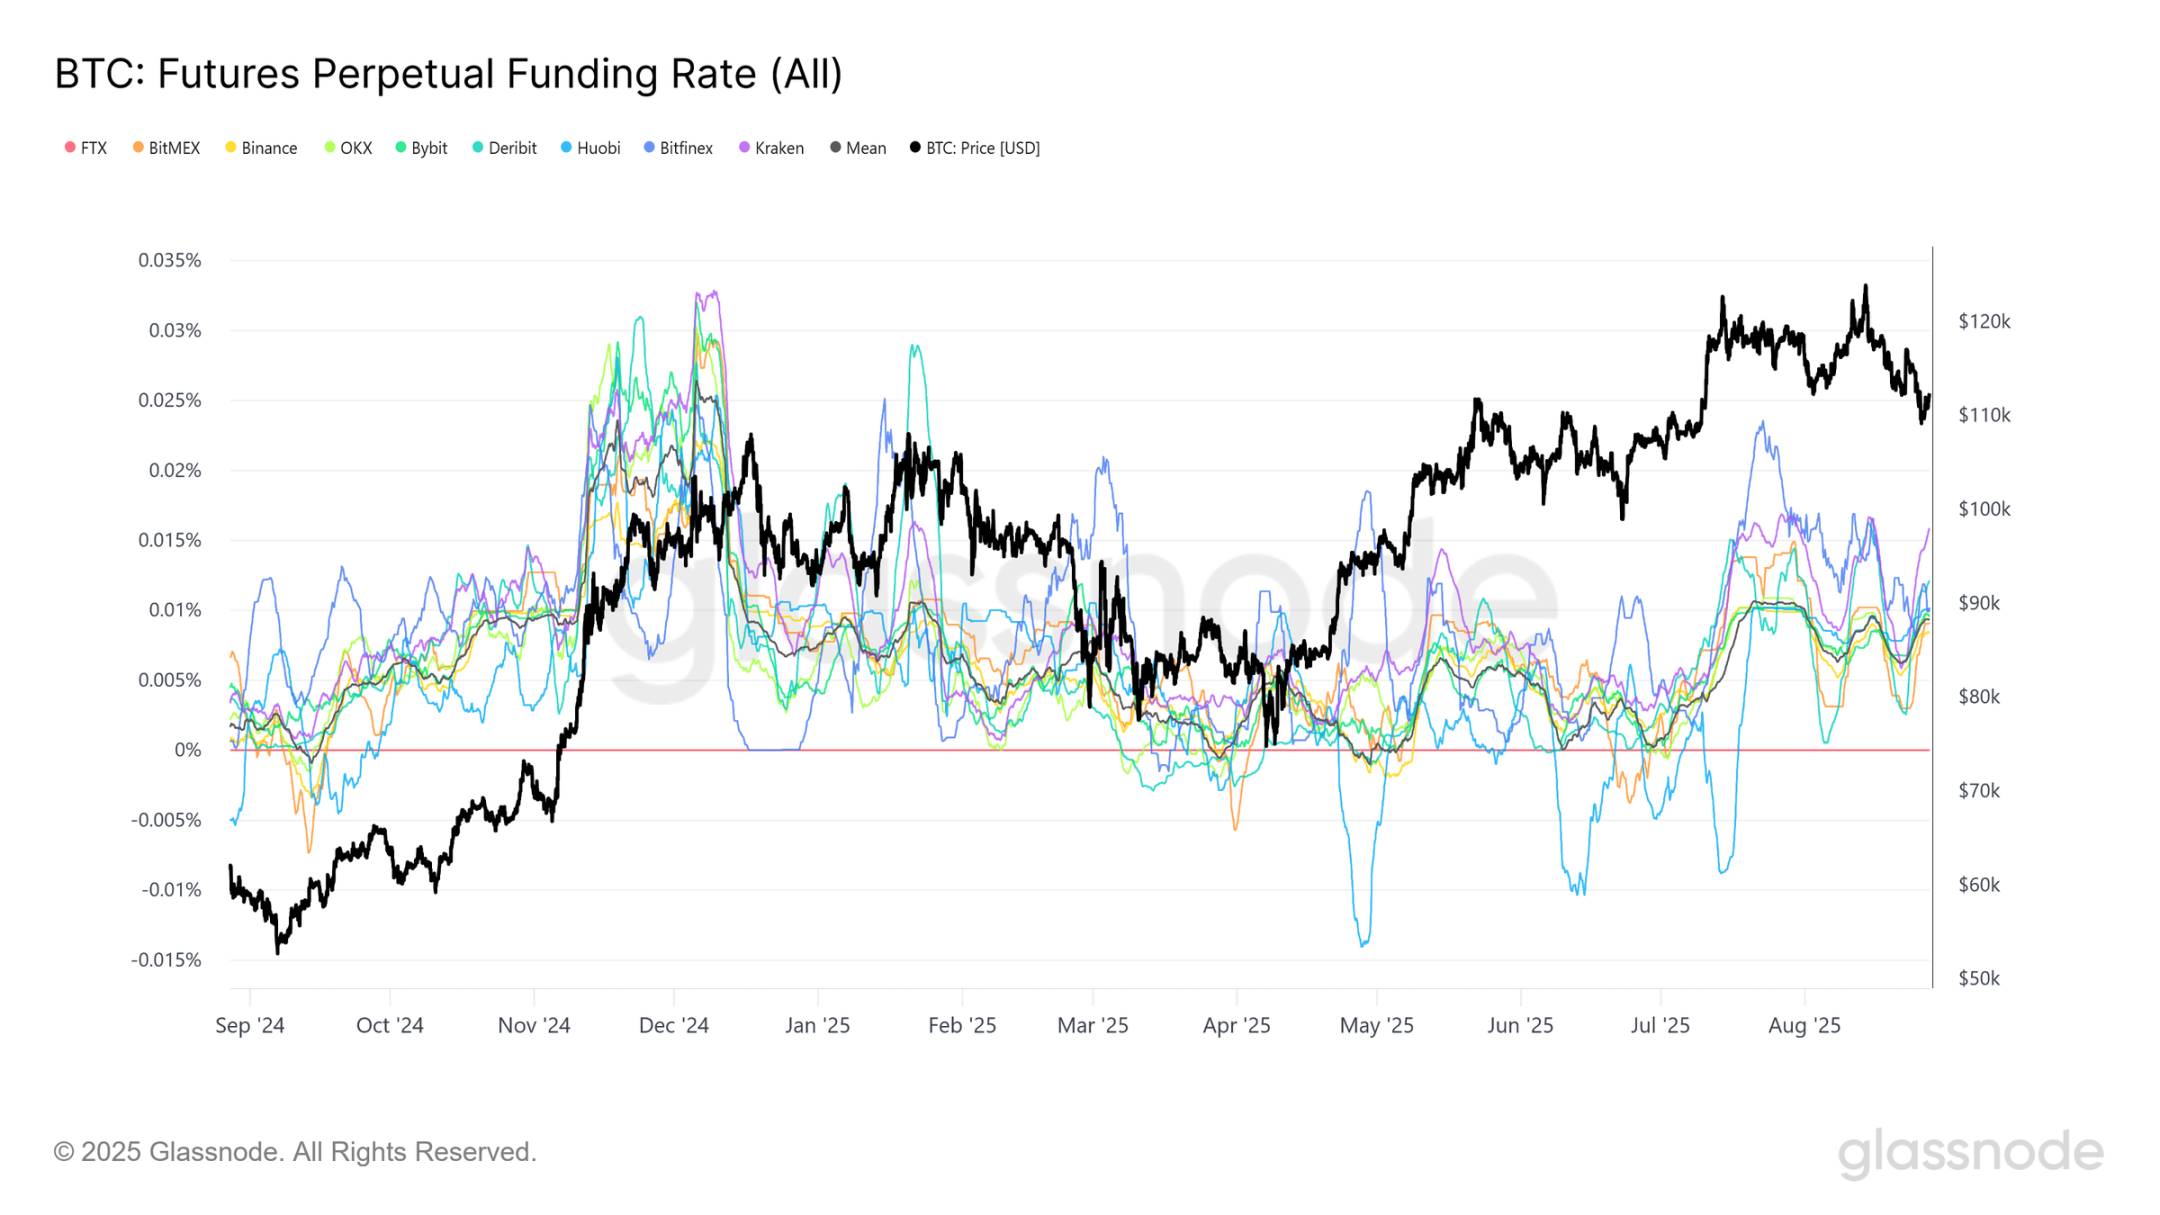
Fragile Neutrality
To confirm broader sentiment in perpetual markets, we can pair CVD analysis with funding rates, which track the cost of holding long versus short positions. The 7-day moving average funding rate across major exchanges currently sits around 0.01%.
This pattern indicates that while some leveraged traders are attempting to catch the falling knife, their long exposure is insufficient to shift the overall balance. Instead, the market remains in a neutral but fragile state, where even a modest increase in selling pressure could quickly tip sentiment toward bearishness.
Conclusion
Bitcoin’s pullback to $111,000 puts the market to the test within a critical range. The cost basis of recent investors between $107,000 and $108,900 marks key support; a break below could open the path toward $93,000–$95,000, where a dense supply cluster may form a medium-term bottom. A rebound toward $113,600 is possible but may meet resistance as pressured short-term holders sell into strength.
Meanwhile, unrealized and realized losses remain shallow, and SOPR has not yet signaled broad capitulation. Off-chain, spot demand has neutralized, while perpetual futures lean bearish and fragile. Overall, compared to past cycles, the current correction is mild, but buying conviction has weakened, leaving the market balanced between resilience and further downside risk.
Join TechFlow official community to stay tuned
Telegram:https://t.me/TechFlowDaily
X (Twitter):https://x.com/TechFlowPost
X (Twitter) EN:https://x.com/BlockFlow_News