Crypto Market Leverage Status in Q2 2025
TechFlow Selected TechFlow Selected
Crypto Market Leverage Status in Q2 2025
As of June 30, the open interest in perpetual futures was $108.922 billion, an increase of $29.2 billion (+36.66%) compared to the end of the first quarter.
Author: Zack Pokorny, Galaxy
Translation: AididiaoJP, Foresight News
Introduction
Leverage in the cryptocurrency market resumed an upward trend in Q2 after declining in Q1, when crypto-backed loans and futures markets both contracted. Following the market volatility on "Liberation Day" in early April, optimism returned to the crypto market, and rising asset prices drove leverage expansion during Q2. Notably, on-chain crypto-collateralized loans grew by 42% during this period, reaching a record high of $26.5 billion.
Digital Asset Treasury Companies (DATCOs) remained a central topic in Q2. However, these firms heavily relied on non-debt strategies for asset acquisition, resulting in no change in their debt balances compared to the previous quarter.
This report tracks leverage trends in crypto-collateralized loans across DeFi and CeFi platforms, publicly traded reserve companies, and crypto futures markets, while adding new participants in CeFi and DeFi lending platforms and futures markets.
Key Takeaways
As of June 30, Galaxy Research tracked $17.78 billion in outstanding borrowing from CeFi platforms. This represents a 14.66% increase ($2.27 billion) quarter-on-quarter and a $10.59 billion (+147.5%) rise since the bear market low of $7.18 billion in Q4 2023.
Outstanding dollar-denominated loans in DeFi applications rebounded strongly from Q1, increasing by $7.84 billion (+42.11%) to reach $26.47 billion—a new all-time high.
Digital Asset Treasury Companies (DATCOs) remained a core theme in Q2. From March to June, the emergence of Ethereum-based treasury firms became a notable trend within the DATCO space, entities that were uncommon in the earlier months of the year.
Bitcoin-focused DATCOs did not issue new debt, leaving the total outstanding debt balance unchanged among traceable reserve companies. Nevertheless, June 2028 remains a key month to watch, when $3.65 billion in outstanding debt will mature.
Open interest in futures (including perpetuals) surged significantly during Q2. As of June 30, major platforms reported total futures open interest of $132.6 billion.
Perpetual futures open interest reached $108.922 billion as of June 30, up $29.2 billion (+36.66%) from the end of Q1.
Crypto-Collateralized Loans
The following outlines key players in the CeFi and DeFi crypto-lending markets. Some large CeFi lenders—ranked by loan size—collapsed in 2022 and 2023 due to plunging crypto asset prices and liquidity drying up. These are marked with red warning dots. Since Galaxy’s last crypto leverage report, we have added five new DeFi applications, one CeFi lender, and one collateralized debt position (CDP) stablecoin.
Newly added DeFi applications include:
-
Fraxlend (Ethereum, Fraxtal, and Arbitrum)
-
Curve Llamalend (Ethereum, Arbitrum, Fraxtal, and OP Mainnet)
-
Lista (BSC)
-
Hyperlend (HyperEVM)
-
Venus (BSC, Ethereum, Unichain, Arbitrum, zkSync Era, Base, OP Mainnet, and opBNB)
Existing applications expanding chain coverage include:
-
Echelon (Echelon Chain)
-
Save (Eclipse)
-
Euler (Arbitrum)
-
Kamino (13 new markets)
-
Dolomite (Ethereum)
Newly added CDP stablecoins include:
-
Felix (native to HyperEVM)
Newly added CeFi lenders include:
-
Figure Markets
-
Nexo
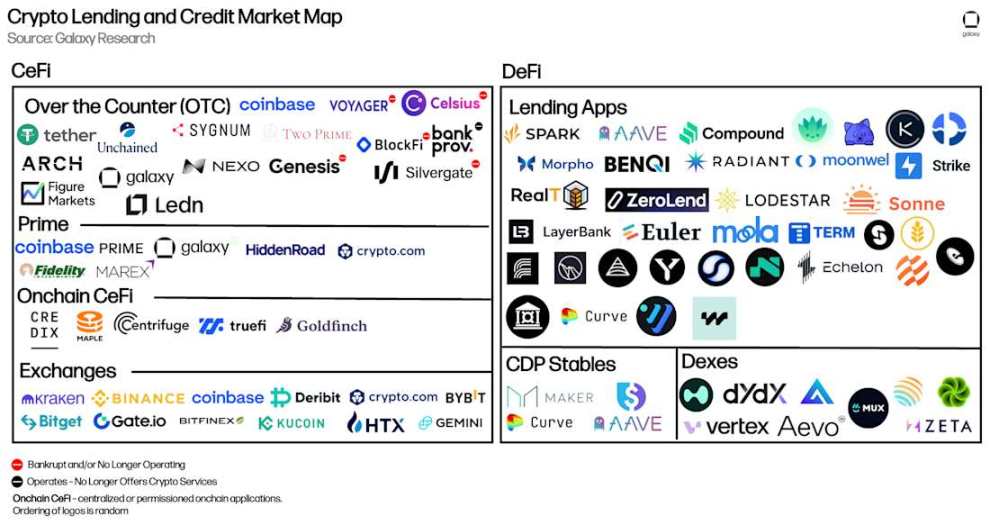
Map of Crypto Lending and Credit Markets
CeFi
The table below compares CeFi crypto-lending institutions included in our analysis. Some firms offer multiple services to investors. For example, Coinbase primarily operates as an exchange but also provides credit via OTC crypto loans and margin financing. However, this analysis focuses only on the scale of its crypto-collateralized loans.
This marks the first inclusion of Figure Markets in this report. Figure is a top player in on-chain credit, with $11.1 billion in private credit and home equity lines of credit (HELOCs). Additionally, the company offers a Bitcoin-backed loan product, data for which is included in the table below. Although Figure launched its Bitcoin loan product in April 2024, it only recently began incentivizing its use.
Nexo is also newly included this quarter. The lender has operated since 2018 and currently serves only non-U.S. clients. The firm recently announced plans to re-enter the U.S. market.
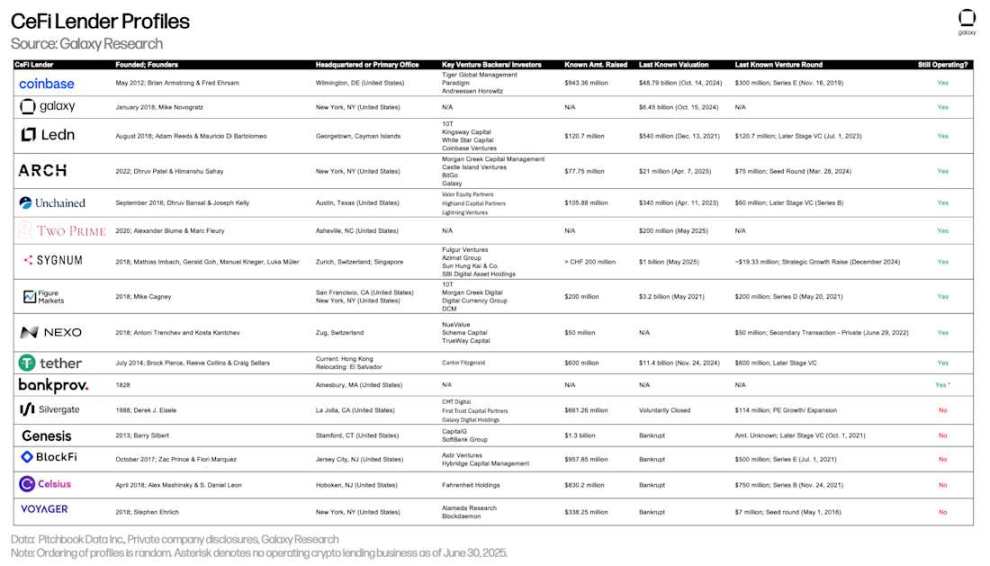
Overview of CeFi Crypto Lenders
As of June 30, Galaxy Research tracked $17.78 billion in outstanding CeFi borrowing. This represents a 14.66% quarterly increase ($2.27 billion) and a $10.59 billion (+147.5%) rise from the Q4 2023 bear market low of $7.18 billion.
Galaxy Research attributes growth in CeFi lending primarily to the following factors:
-
A reflexive relationship between borrowing activity and price appreciation: as prices rise, borrowing typically increases. This holds true in both DeFi and CeFi lending.
-
Intensifying competition may begin to affect borrowing costs. Greater competition leads to better cost control, enabling larger-scale lending at more attractive rates.
-
Treasury firms are increasingly funding through CeFi lenders, representing a significant new source of demand.
Ledn has dropped out of the top three in outstanding loan volume due to changes in its loan issuance strategy. In Q2, Ledn decided to focus entirely on Bitcoin-backed loans, discontinuing yield products and Ethereum-related offerings. This decision led to record-high issuance of Bitcoin-backed loans. However, due to the removal of institutional loans (from discontinued Bitcoin and Ethereum yield products), its overall loan volume declined compared to Q1. It should be noted that as of the end of Q2, Ledn reported 100% of its loan volume denominated in USD, with 99% backed by Bitcoin and 1% consisting of legacy Ethereum-backed loans, which will be phased out.
Tether, Nexo, and Galaxy are the top three lenders by outstanding loan value tracked by Galaxy Research. As of June 30, Tether's outstanding loans totaled $10.14 billion, Nexo $1.96 billion, and Galaxy $1.11 billion.
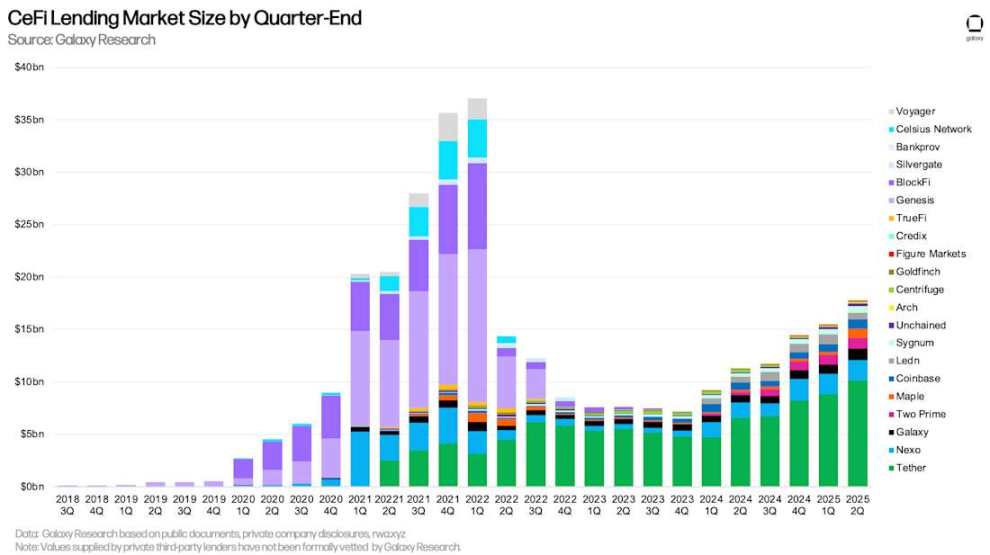
CeFi Crypto Lending Market Size by Quarter-End
Tether dominates our analysis with a 57.02% market share. Together with Nexo (11.01%) and Galaxy (6.23%), the top three CeFi lenders account for 74.26% of the market.
When comparing market shares, it’s important to note differences among CeFi lenders. Some offer only specific loan types (e.g., Bitcoin-only collateral, altcoin collateral, or cash loans excluding stablecoins), serve specific client types (institutional or retail), or operate in specific jurisdictions. These combinations make it easier for some lenders to scale.
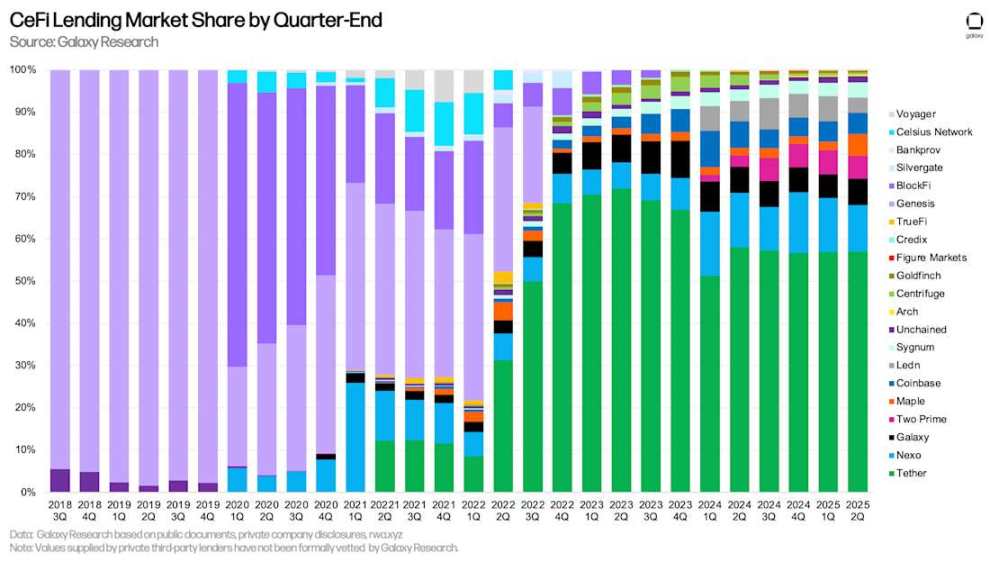
CeFi Lending Market Share by Quarter-End
The table below details Galaxy Research’s data sources and methodology for calculating each CeFi lender’s loan volume. While DeFi and on-chain CeFi lending data are transparent and accessible on-chain, CeFi data is more complex due to inconsistencies in how lenders report outstanding loans, disclosure frequency, and access difficulty.
Note: Figures provided by third-party private lenders have not been formally audited by Galaxy Research.
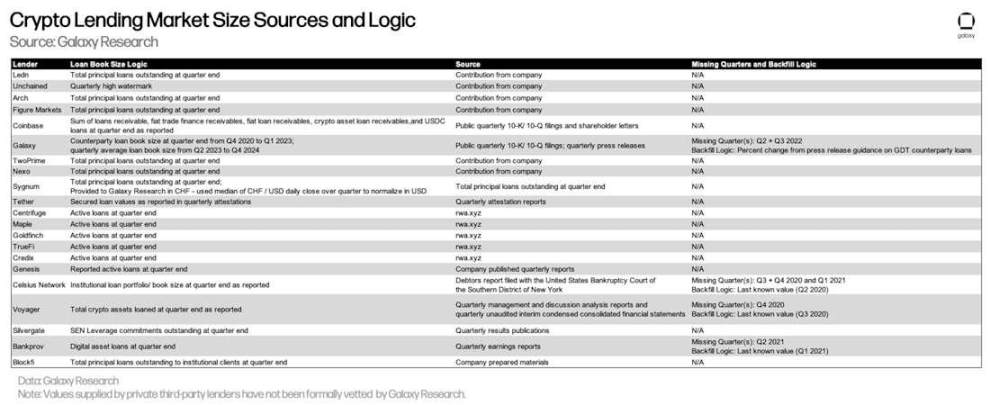
Data Sources and Methodology for Crypto Lending Market Size
CeFi and DeFi Lending
Outstanding dollar-denominated loans in DeFi applications rebounded strongly from Q1, increasing by $7.84 billion (+42.11%) to $26.47 billion—an all-time high. Combining DeFi applications and CeFi lending platforms, total crypto-collateralized outstanding loans reached $44.25 billion at quarter-end. This represents a $10.12 billion (+29.64%) increase from the previous quarter, driven primarily by growth in DeFi lending platforms. Only Q4 2021 ($53.44 billion) and Q1 2022 ($48.39 billion) saw higher outstanding loan volumes than Q2 2025.
Note: There may be double-counting between CeFi loan totals and DeFi borrowings. This occurs because some CeFi entities rely on DeFi applications to lend to off-chain clients. For example, if a CeFi lender uses idle Bitcoin as collateral to borrow USDC on-chain, then lends that USDC to an off-chain borrower, the on-chain borrowing appears in both DeFi outstanding loans and the lender’s financial statements (as an outstanding loan to a client). Due to lack of disclosure or on-chain attribution, filtering this out is difficult.
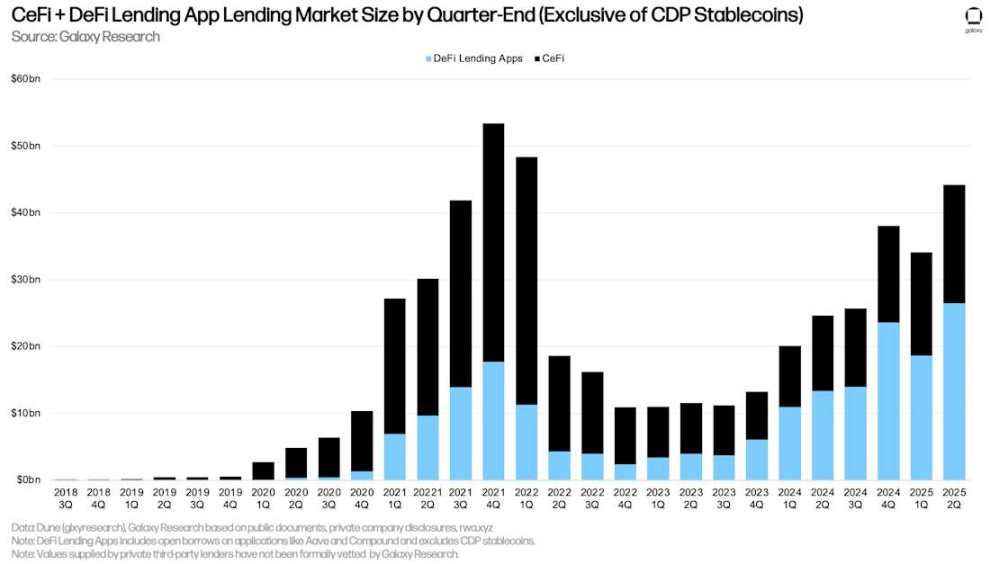
CeFi + DeFi Lending Market Size by Quarter-End (excluding CDP stablecoins)
Due to the quarter-on-quarter growth in DeFi lending platform borrowings, DeFi’s lead over CeFi lending platforms again approached the historical peak seen in Q4 2024. As of the end of Q2 2025, DeFi lending applications accounted for 59.83% of the CeFi + DeFi lending market, up from 54.56% in Q1 2025, though down 216 basis points from Q4 2024’s peak of 61.99%.

CeFi + DeFi Lending Market Share by Quarter-End (excluding CDP stablecoins)
The third component—crypto-collateralized portion of CDP stablecoin supply—increased by $1.24 billion (+16.45%) quarter-on-quarter. Similarly, there may be overlap between CeFi loan totals and CDP stablecoin supply, as some CeFi entities may rely on minting CDP stablecoins via crypto collateral to lend to off-chain clients.
Overall, in Q2 2025, crypto-collateralized loans grew by $11.43 billion (+27.44%) to $53.09 billion. Only Q4 2021 ($69.37 billion) and Q1 2022 ($63.43 billion) had higher combined balances of crypto-collateralized loans and CDP stablecoins.
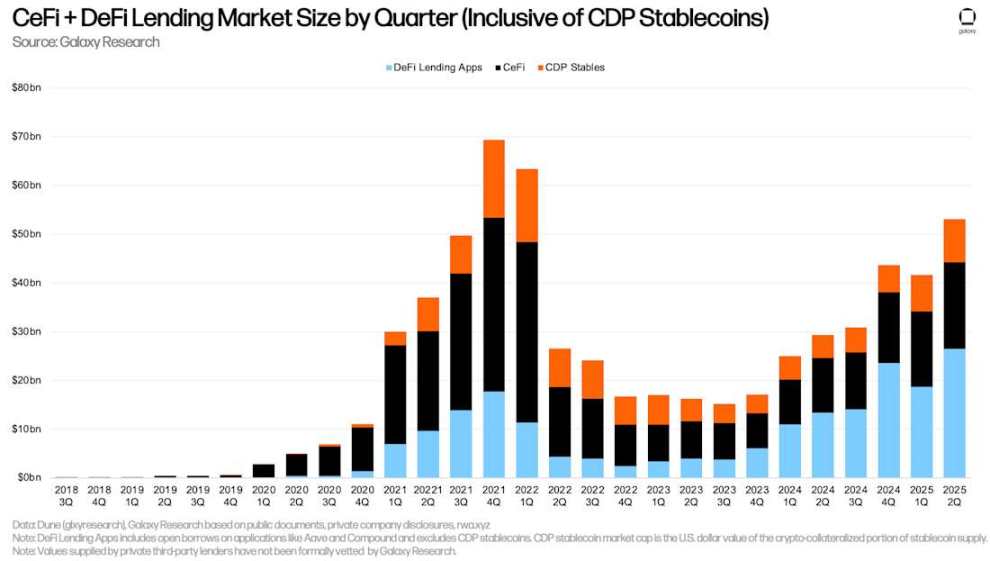
Quarterly CeFi + DeFi Lending Market Size (including CDP stablecoins)
As of the end of Q1 2025, DeFi lending applications accounted for 49.86% of the crypto-collateralized loan market (up 515 basis points from Q1 2025), CeFi platforms 33.48% (down 373 basis points), and the crypto-collateralized portion of CDP stablecoins 16.65% (down 142 basis points). Combined, DeFi lending applications and CDP stablecoins accounted for 66.52% of the market (up 373 basis points), slightly below the historical peak of 66.86% at the end of Q4 2024.
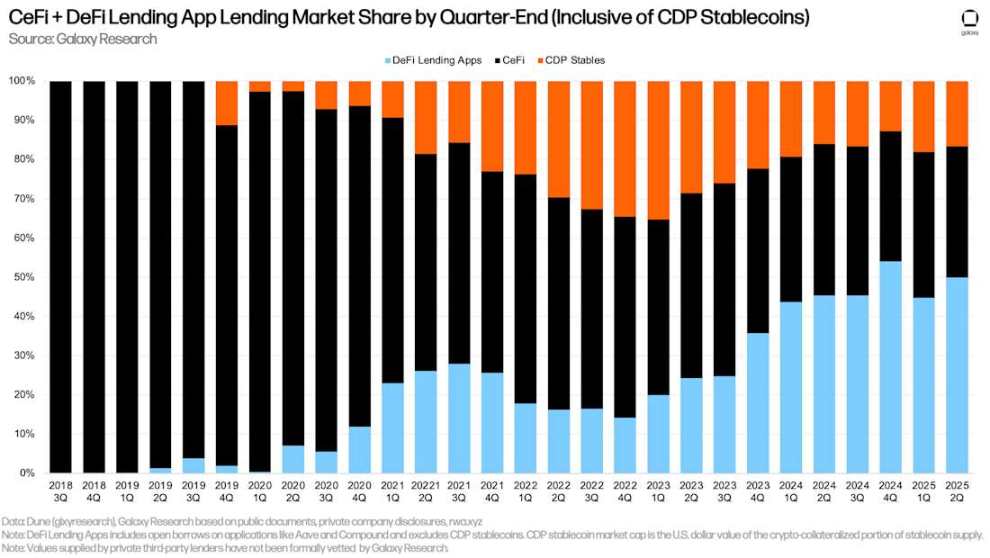
CeFi + DeFi Lending Market Share by Quarter-End (including CDP stablecoins)
Additional Perspectives on DeFi Lending
DeFi borrowing continues to climb to new highs, with Ethereum dominating activity. Ethena’s “liquid leverage” program in collaboration with Aave, along with ongoing use of Pendle Principal Tokens (PTs) on Aave and Euler, played significant roles in expanding on-chain lending. Supported by the “liquid leverage” program and Pendle PT tokens, users implement “looping strategies,” arbitraging between asset yield and borrowing costs. This strategy is common with ETH and stETH (liquid staked ETH), allowing users to gain leveraged exposure to Ethereum staking APY.
Since the end of the quarter on June 30, asset supply in DeFi lending applications increased by $20.06 billion (+33.91%) to $79.22 billion. As of July 31, 2025, Ethereum accounted for 78.22% of DeFi lending supply. During the same period, Solana deposits totaled $4.3 billion, or 5.43%.
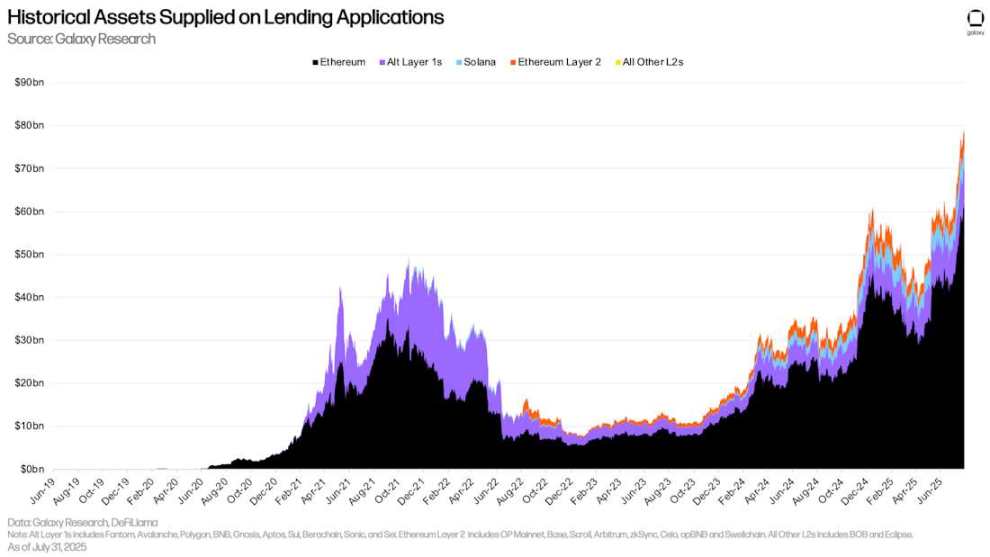
Historical Asset Supply on Lending Applications
Borrowing trends in DeFi lending applications mirrored supply trends. Between June 30 and July 31, DeFi lending platforms added $6.2 billion (+33.94%) in new borrowing. Ethereum led in both absolute and relative growth, adding $8.48 billion in borrowing (+42.73%). During the same period, Ethereum Layer 2 borrowing ranked second, growing by $309.73 million (+24.71%).
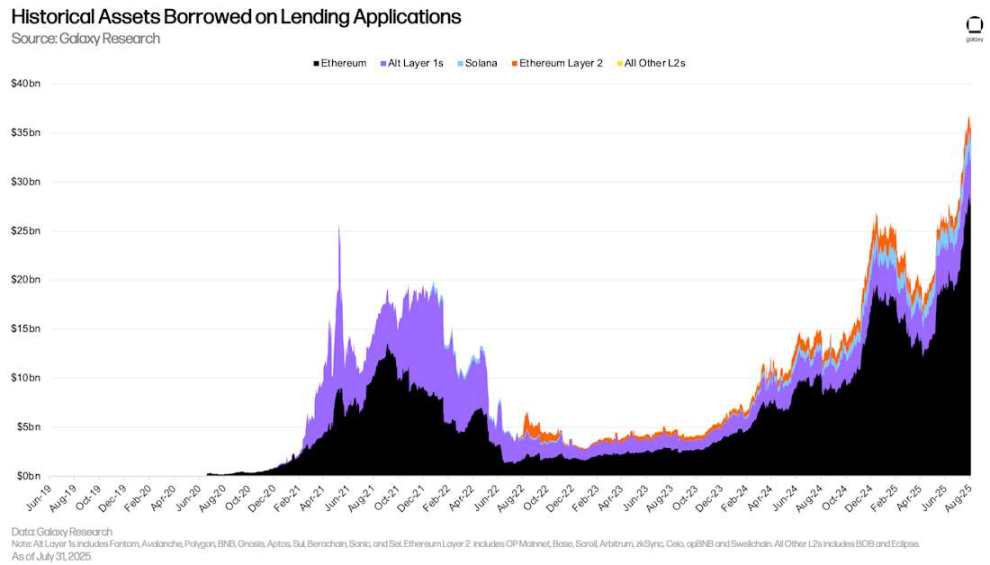
Historical Borrowed Assets on Lending Applications
As of August 8, Aave V3 Core held $5.79 billion in Ethena-issued assets, of which 55.88% were Pendle PT tokens. Additionally, USDe (Ethena’s synthetic dollar) and sUSDE (staked USDe, earning yield from USDe’s underlying collateral) totaled $2.45 billion.
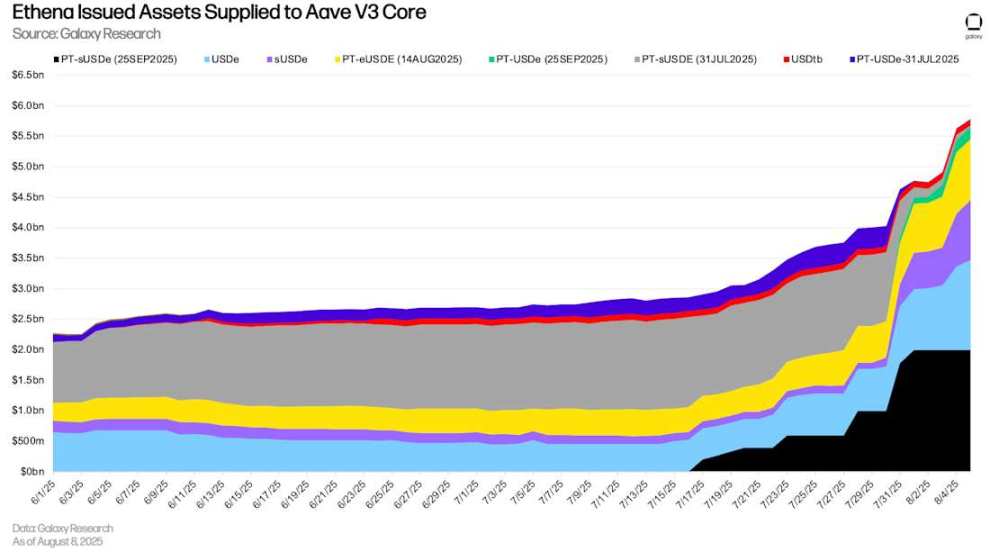
Ethena-Issued Assets Supplied to Aave V3 Core
On-Chain vs. Off-Chain Interest Rates
The following compares borrowing rates for stablecoins, BTC, and ETH between on-chain lending markets and off-chain platforms.
Stablecoins
The weighted average stablecoin borrowing rate rose slightly from 4.7% on March 31 to 4.96% on July 31 (using seven-day moving averages of weighted average stablecoin borrowing rates and CDP stablecoin minting fees). This slight increase resulted from modestly higher borrowing activity, while stablecoin lending market parameters saw little adjustment. Since mid-March 2025, stablecoin rates on Aave—the largest liquidity hub for stablecoins—have remained unchanged.
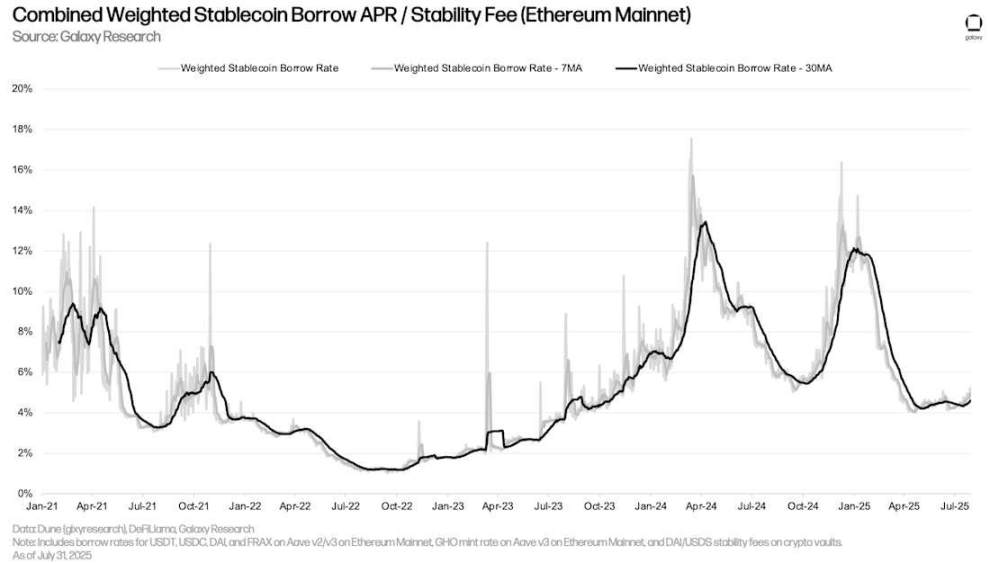
Composite Weighted Stablecoin Borrowing APR / Stability Fee (Ethereum Mainnet)
The following separately lists the cost of borrowing stablecoins via lending applications versus minting CDP stablecoins via crypto collateral. Both rates follow similar trends, but CDP stablecoin minting rates tend to be less volatile, as they are manually set periodically rather than adjusting in real time with market conditions.
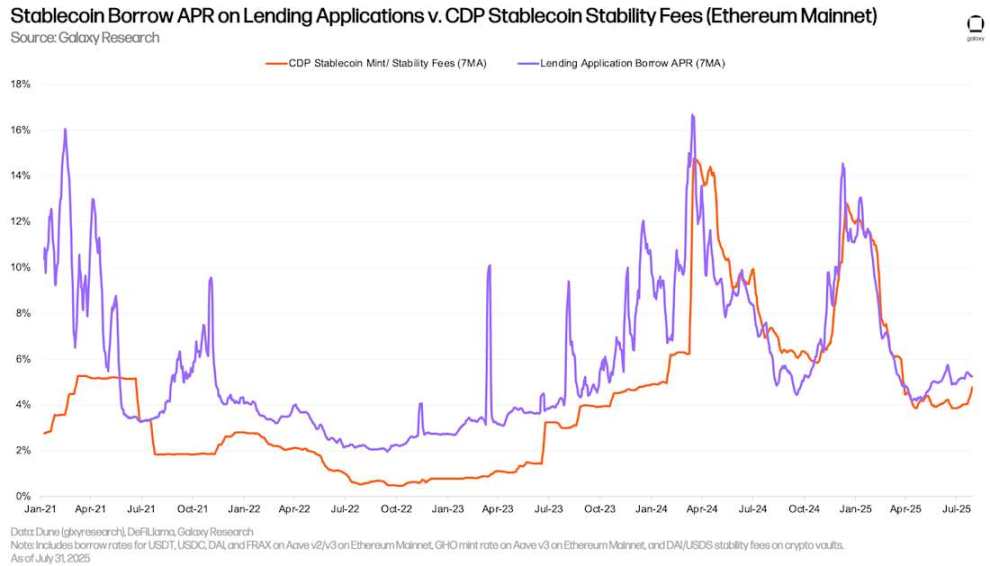
Stablecoin Borrowing APR on Lending Applications vs. CDP Stability Fee (Ethereum Mainnet)
Since early July, off-chain USDC rates have begun to rise slightly, while on-chain lending application rates have remained flat. As of July 28, 2025, the spread between on-chain and off-chain USDC rates (on-chain minus off-chain) reached its highest level since December 30, 2024. Despite sustained price increases throughout the quarter, both on-chain and off-chain stablecoin rates remained stable.
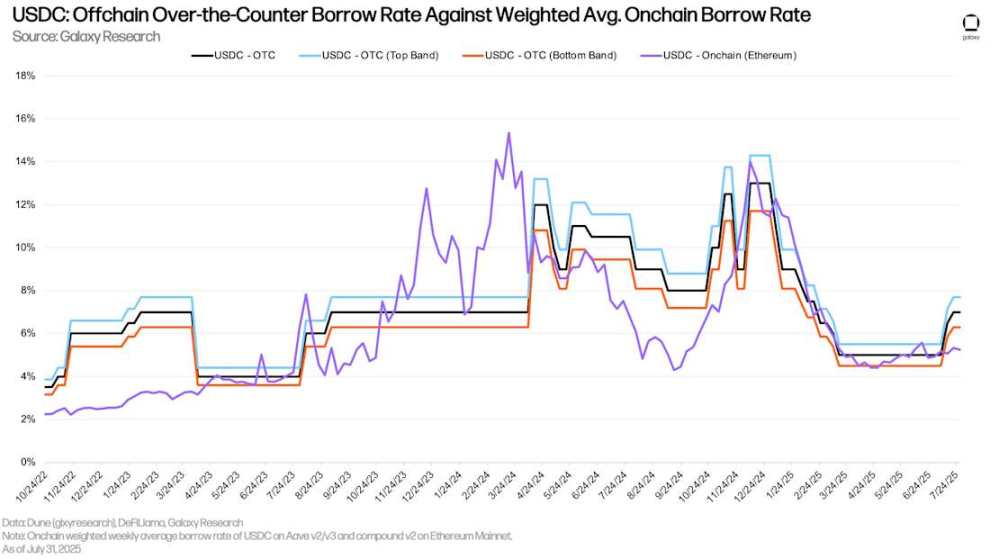
USDC: Off-Chain Borrowing Rate vs. Weighted Average On-Chain Borrowing Rate
The chart below tracks the same rates for USDT. Since early July, on-chain and off-chain USDT rates have been closer than those for USDC.
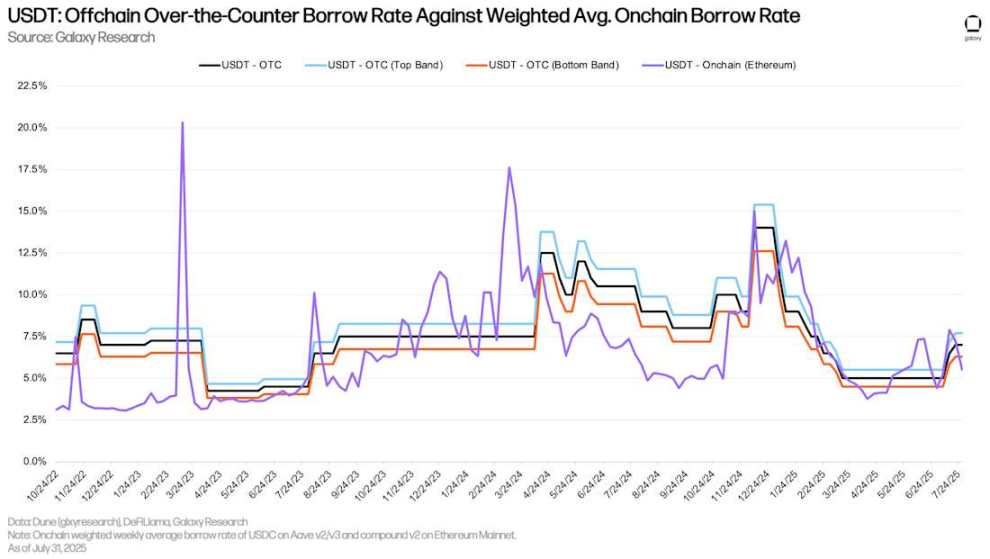
USDT: Off-Chain Borrowing Rate vs. Weighted Average On-Chain Borrowing Rate
Bitcoin
The chart below shows the weighted borrowing rate for wrapped Bitcoin (WBTC) across multiple applications and chains. On-chain WBTC borrowing costs are typically lower because wrapped Bitcoin is primarily used as collateral in on-chain markets, with relatively low borrowing demand. Compared to stablecoins, on-chain BTC borrowing costs have remained stable due to infrequent borrowing and repayment by users.
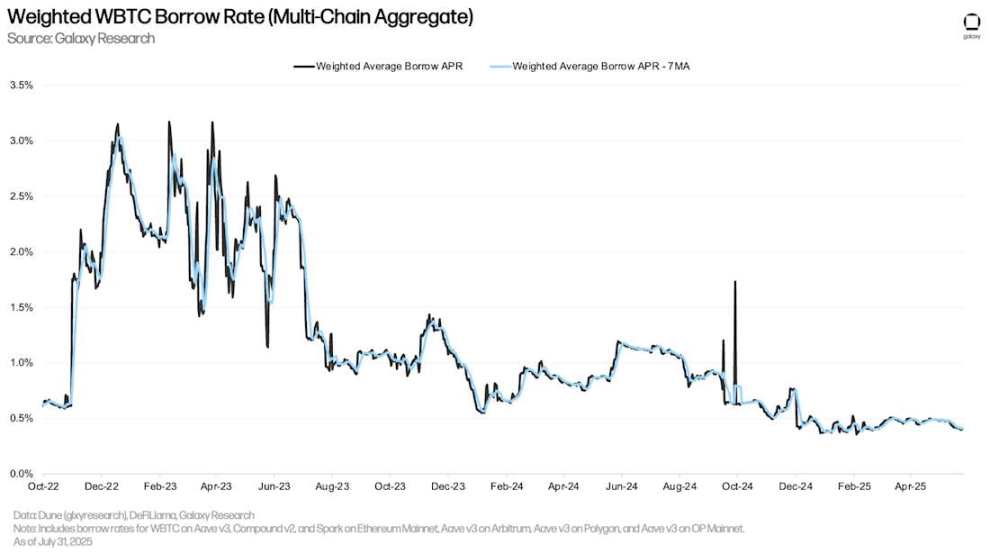
Weighted WBTC Borrowing Rate (Multi-Chain Aggregated)
The historical divergence between on-chain and off-chain BTC borrowing rates persisted in Q2. In off-chain markets, BTC demand is mainly driven by two factors: 1) short-selling BTC; and 2) using BTC as collateral for stablecoin and cash loans. The former is uncommon in on-chain lending markets, explaining the difference in borrowing costs.
In early April, as the market rebounded sharply from the "Liberation Day" lows, off-chain BTC rates rose slightly. However, as the market cooled by late July, rates fell back to the 2.25% level seen at the start of Q2.
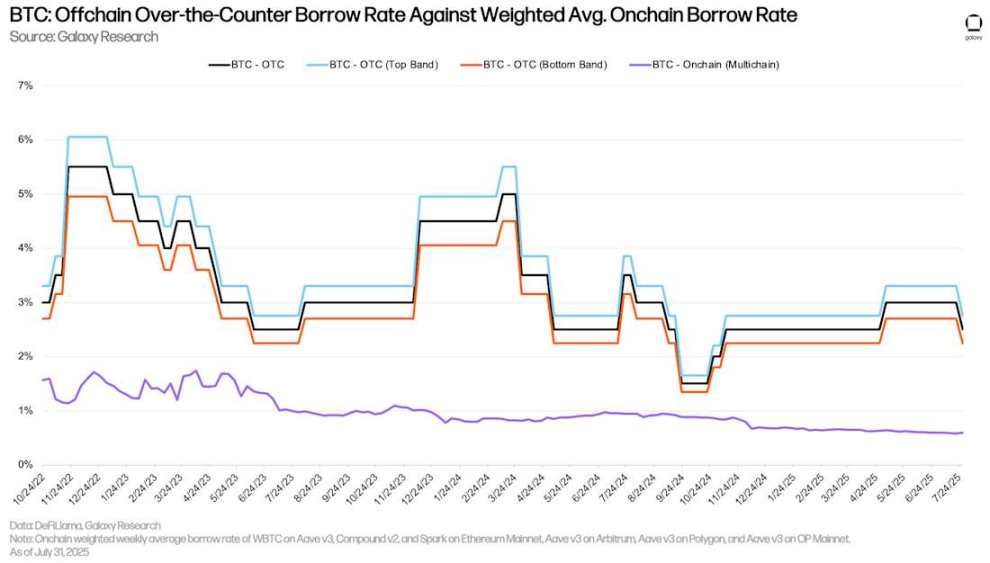
BTC: Off-Chain Borrowing Rate vs. Weighted Average On-Chain Borrowing Rate
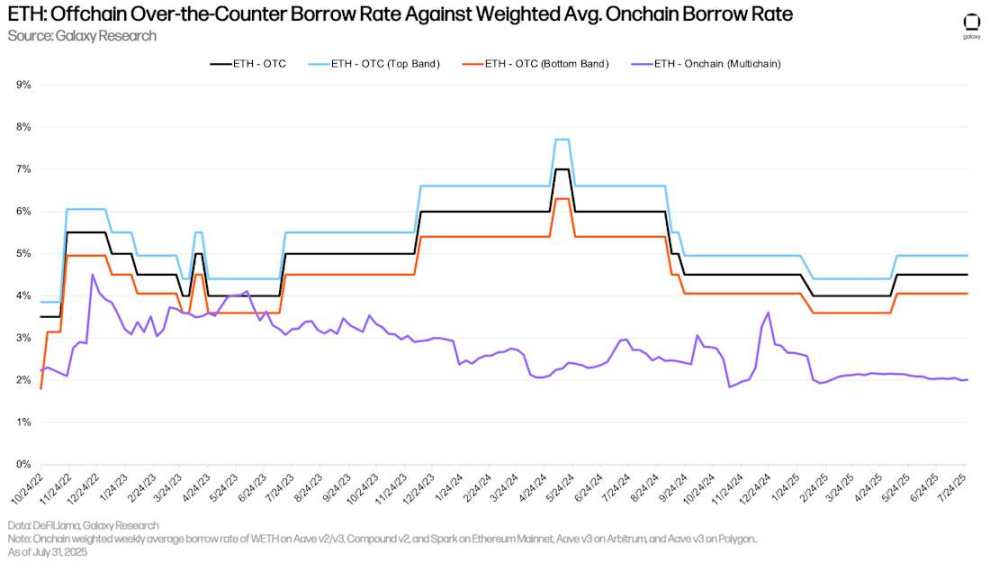
ETH and stETH
The chart below shows the weighted borrowing rates for ETH and stETH (staked ETH on Lido protocol) across multiple applications and chains. Historically, ETH borrowing costs have been higher than stETH because users borrow ETH to execute looping strategies, gaining leveraged exposure to Ethereum network staking APY (using stETH as collateral). Thus, ETH borrowing APR typically fluctuates around 30–50 basis points above or below Ethereum staking APY. When borrowing costs exceed staking yields, the strategy becomes uneconomical, so ETH borrowing APR rarely stays above staking APY for long. However, in July, ETH borrowing rates spiked sharply due to large ETH withdrawals on Aave V3 Core. The impact of this event is discussed further below.
Similar to WBTC, stETH borrowing costs are typically low because the asset is primarily used as collateral with relatively low utilization.
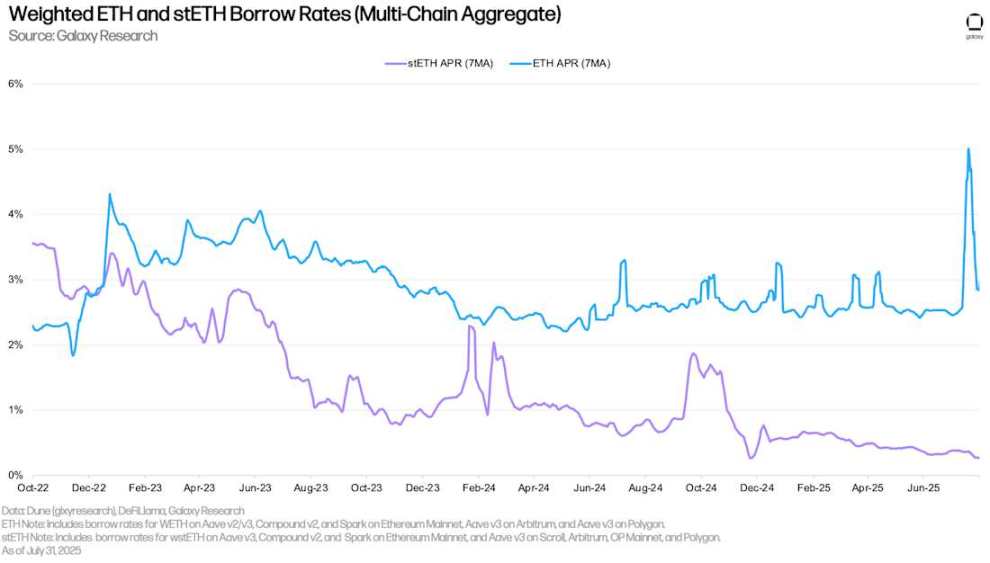
Weighted ETH and stETH Borrowing Rate (Multi-Chain Aggregated)
By using yield-generating liquid staking tokens (LSTs) or liquid restaking tokens (LRTs) as collateral, users can obtain ETH loans at low (or even negative) net borrowing rates. This cost efficiency enables looping strategies: users repeatedly use LSTs as collateral to borrow unstaked ETH, stake it, then use the generated LSTs to borrow more ETH, amplifying exposure to ETH staking APY. This strategy is only viable when ETH borrowing costs are below stETH staking APY. Most of the time, users can execute this smoothly. However, between July 15 and July 25, nearly 300,000 ETH were withdrawn from Aave V3 Core, causing ETH borrowing rates to spike and making the looping strategy unprofitable (net rate persistently above 0% in the chart below).
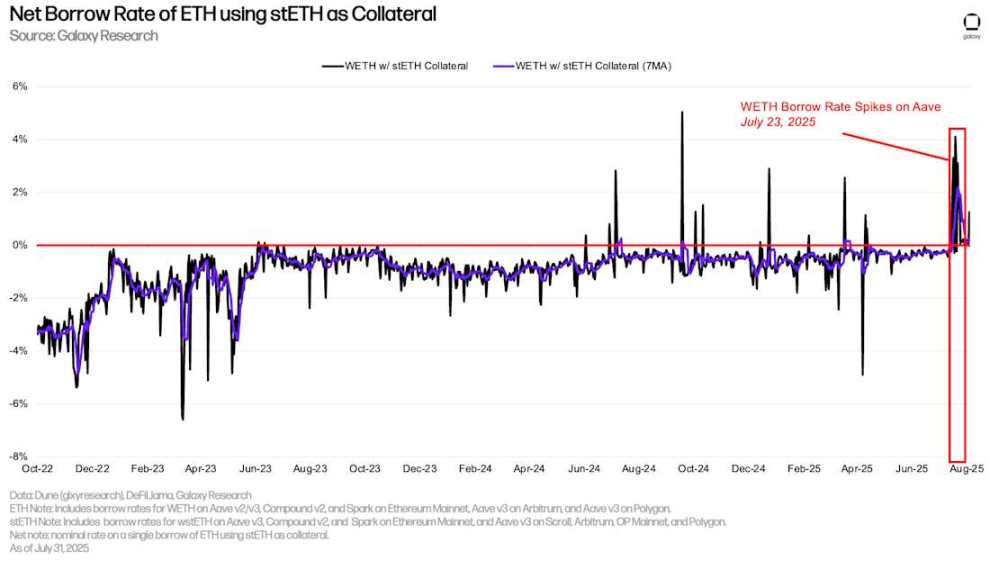
Net ETH Borrowing Rate Using stETH as Collateral
This event triggered ripple effects in the Ethereum staking withdrawal queue, as users rushed to close looping positions requiring ETH unstaking from Ethereum’s Beacon Chain. At its peak, ETH unstaking wait times approached 13 days—a record high. The Aave incident illustrates that, although rare, DeFi markets can significantly impact blockchain operations themselves.
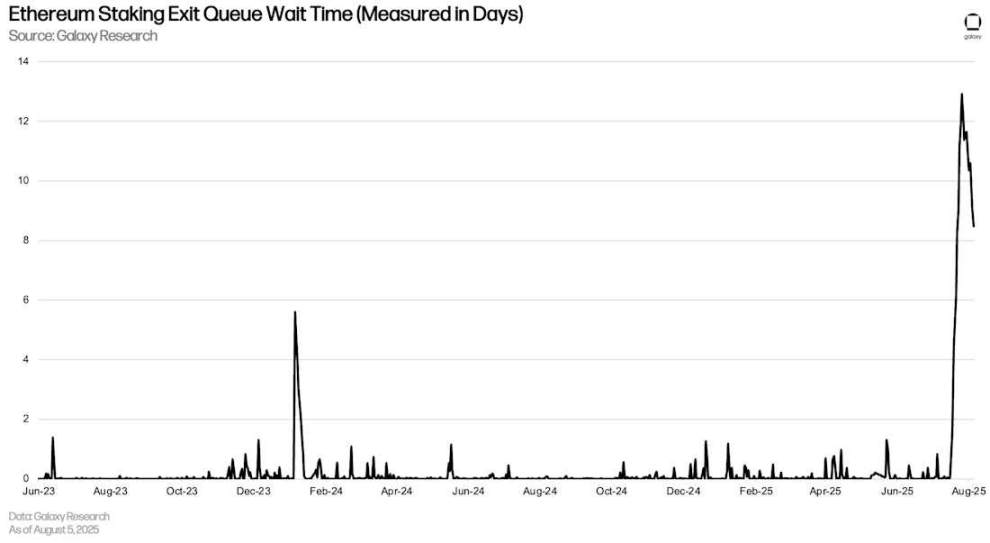
Ethereum Staking Withdrawal Queue Wait Time (in days)
ETH Off-Chain Rates
Similar to Bitcoin, the cost of borrowing ETH via on-chain lending applications is significantly lower than off-chain. This is driven by two main factors: 1) similar to BTC, off-chain markets have short-selling demand, which is uncommon on-chain; and 2) Ethereum staking APY sets a floor for off-chain borrowing rates, as suppliers have little incentive to deposit assets on off-chain platforms below staking APY, nor do platforms lend below that rate. Therefore, for ETH, the off-chain lending floor is typically the staking APY, while on-chain staking APY usually acts as the ceiling.
ETH: Off-Chain Borrowing Rate vs. Weighted Average On-Chain Borrowing Rate
Corporate Debt Strategies
Digital Asset Treasury Companies (DATCOs) remained a core theme in Q2. From March to June, the rise of Ethereum treasury firms became a notable trend in the DATCO space—entities that were uncommon in the early months of the year. One key difference between Bitcoin and Ethereum DATCOs is that Bitcoin-focused firms use debt financing to purchase assets. In contrast, large Ethereum treasury firms launched over the past few months have relied entirely on public PIPEs (private investments in public equity), private placements, at-the-market (ATM) offerings, and selling other assets (e.g., selling BTC to buy ETH) for funding. Combined with no new debt issuance from Bitcoin DATCOs, the total outstanding debt balance among traceable reserve companies remained unchanged at $12.74 billion (including GameStop).
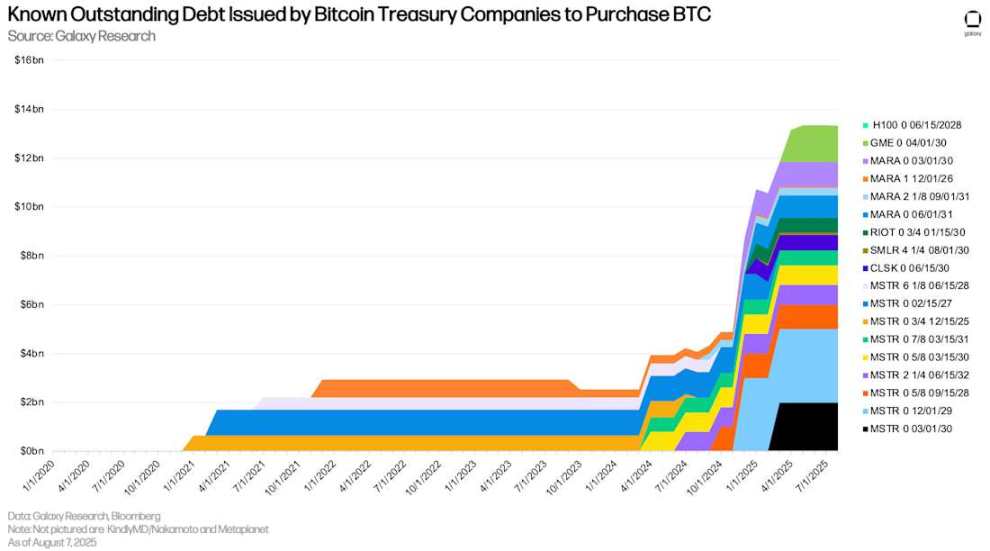
Known Outstanding Debt Issued by Bitcoin Reserve Companies to Purchase BTC
With no new debt issuance, the scale and maturity profile of DATCO debt remain consistent. Nevertheless, June 2028 remains a key month to watch, when $3.65 billion in outstanding debt will mature. The first debt maturities (December 2026) are now 16 months away.
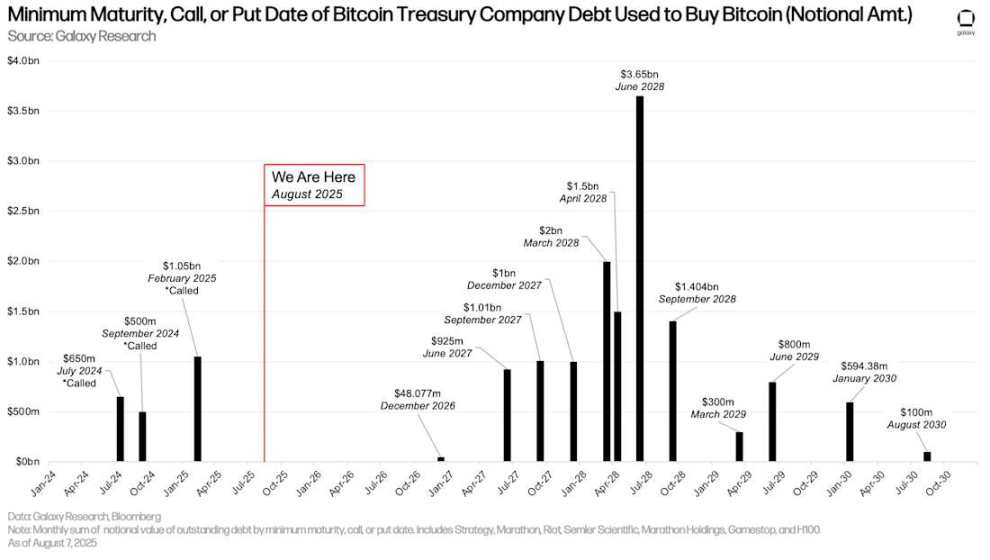
Earliest Maturity, Redemption, or Put Dates for Debt Used by Bitcoin Reserve Companies to Purchase Bitcoin (Nominal Amount)
Similar to the maturity schedule, DATCOs issuing interest-bearing debt paid consistent quarterly interest amounts compared to the prior quarter. Strategy (formerly MicroStrategy) had the highest quarterly interest expense at $17.5 million.
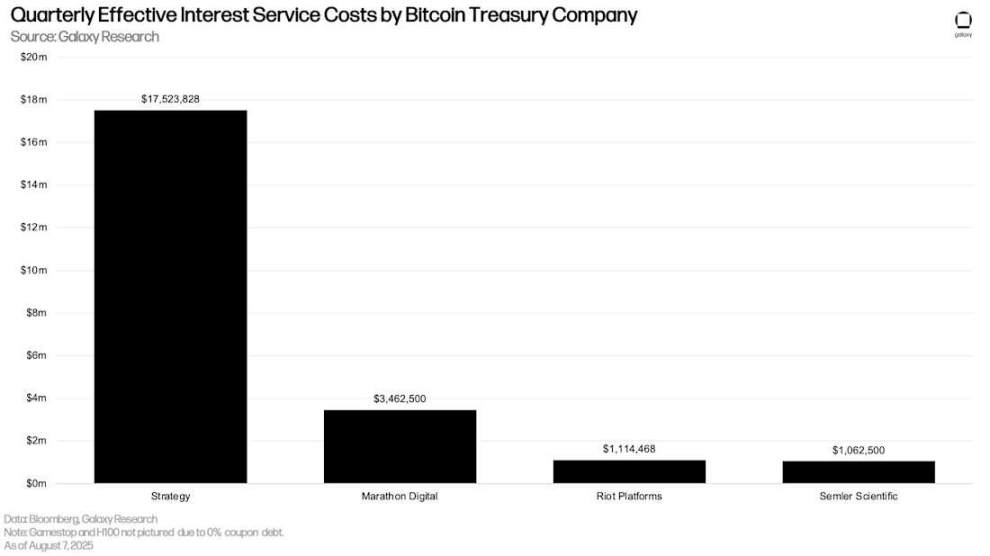
Actual Quarterly Interest Expense by Bitcoin Reserve Companies
Futures Markets
Open interest in futures (including perpetuals) surged significantly during Q2. As of June 30, major platforms reported total futures open interest of $132.6 billion—up $36.14 billion (+37.47%) from the end of Q1 on March 31. During the same period, Bitcoin futures open interest grew by $16.85 billion (+34.92%), Ethereum futures by $10.54 billion (+58.65%), Solana futures by $1.97 billion (+42.82%), and other crypto futures by 38.52%. Note that total open interest does not fully represent absolute leverage, as some positions may be hedged by spot long positions, leaving traders delta-neutral to the underlying asset.
Since last quarter, we have added the following futures platforms:
-
BingX
-
Bitunix
-
CoinEx
-
Coinbase
-
Gate
-
KuCoin
-
MEXC
-
dYdX
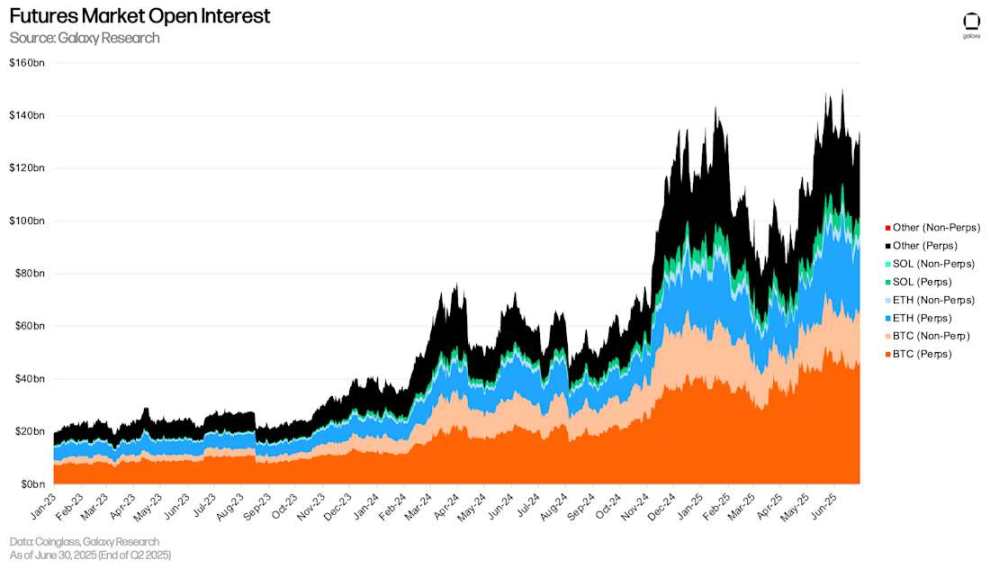
Futures Market Open Interest
As of June 30, CME (including perpetual and non-perpetual contracts) accounted for 15.48% of total open interest—up 149 basis points from 13.99% on March 31, but down 58 basis points from January 1. The Chicago exchange peaked at 19.08% on February 21, then declined by 360 basis points.
As of June 30, CME’s Ethereum open interest share (calculated as CME Ethereum open interest divided by total market open interest) was 10.77%—up 218 basis points from the end of Q1 2025, but down 118 basis points from January 1, 2025. Similarly, CME’s Bitcoin open interest share rose 380 basis points in Q2 to 26.32%, down 152 basis points from the start of the year.
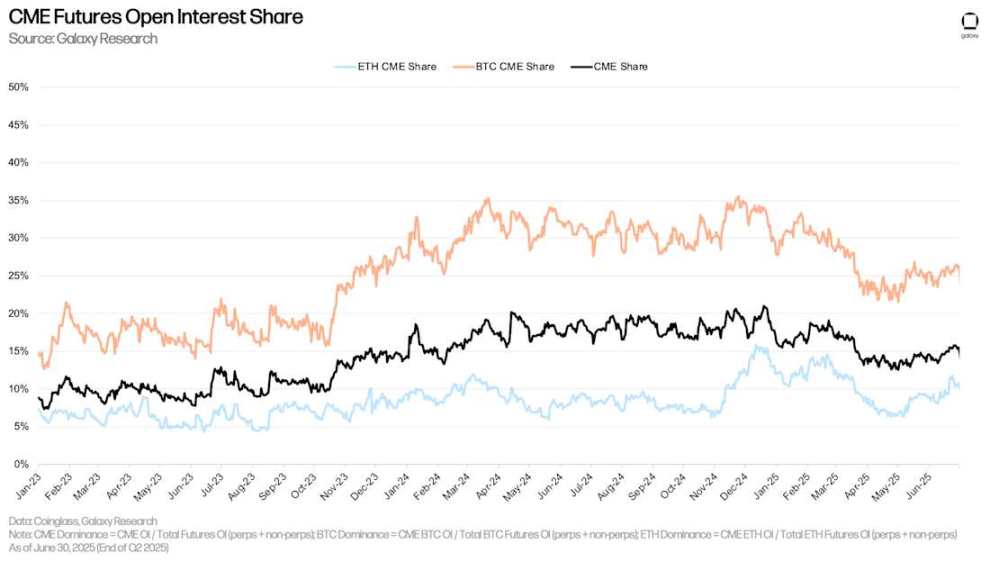
CME Futures Open Interest Share
Perpetual Futures
As of June 30, perpetual futures open interest reached $108.922 billion, up $29.2 billion (+36.66%) from the end of Q1. This is 14.18% below the all-time high of $126.7 billion on June 10. As of June 30, Bitcoin perpetuals accounted for 41.77% of the market, Ethereum 23.13%, Solana 5.88%, and other assets 29.23%.
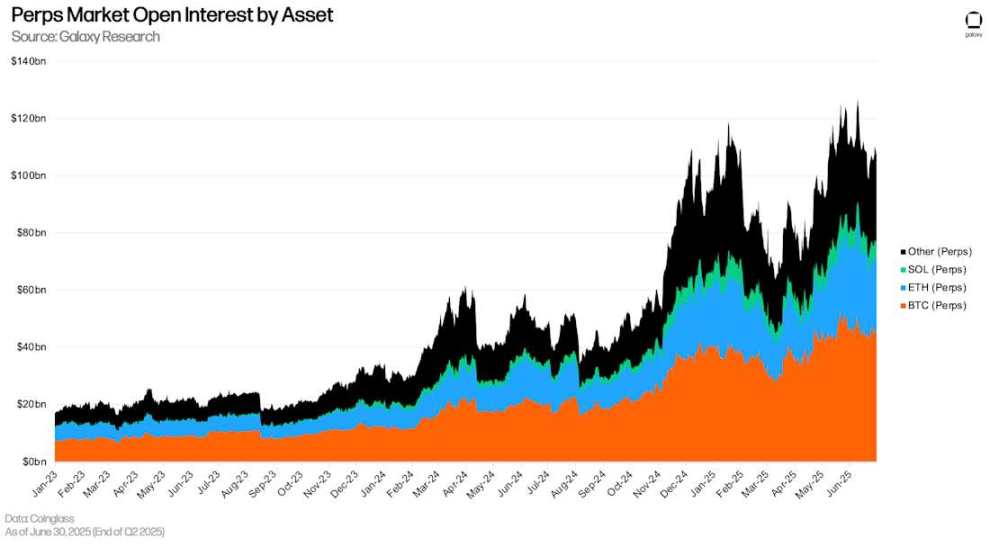
Perpetual Futures Open Interest by Asset
As of June 30, perpetual futures open interest represented 82.02% of total futures open interest, down 231 basis points from the end of Q1.
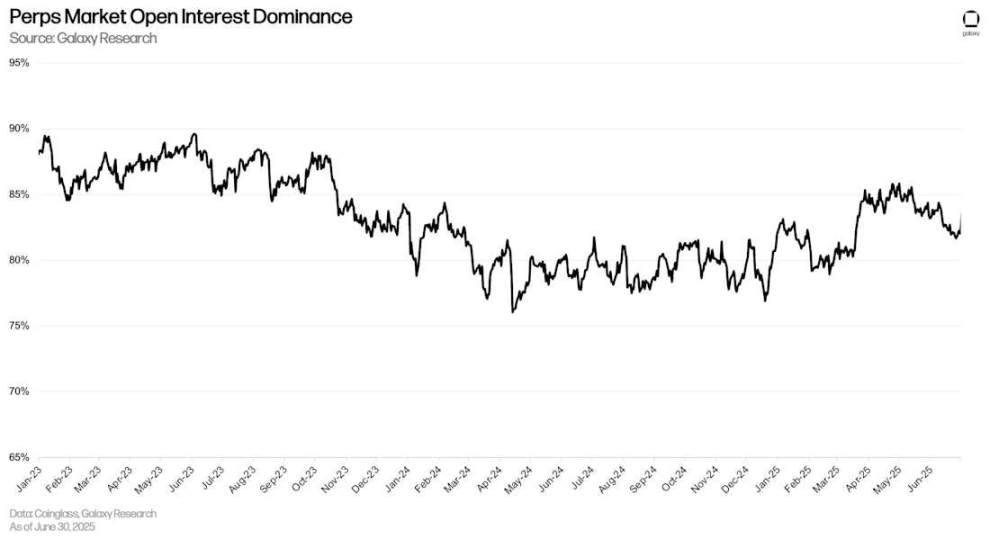
Perpetual Futures Open Interest Share
By open interest, Binance holds the largest share in the perpetual futures market at 20.83%, followed by Bybit (15.41%) and Gate (12.85%). As of the end of Q2, Hyperliquid’s open interest was $7.516 billion, accounting for 6.91% of the perpetual futures market.
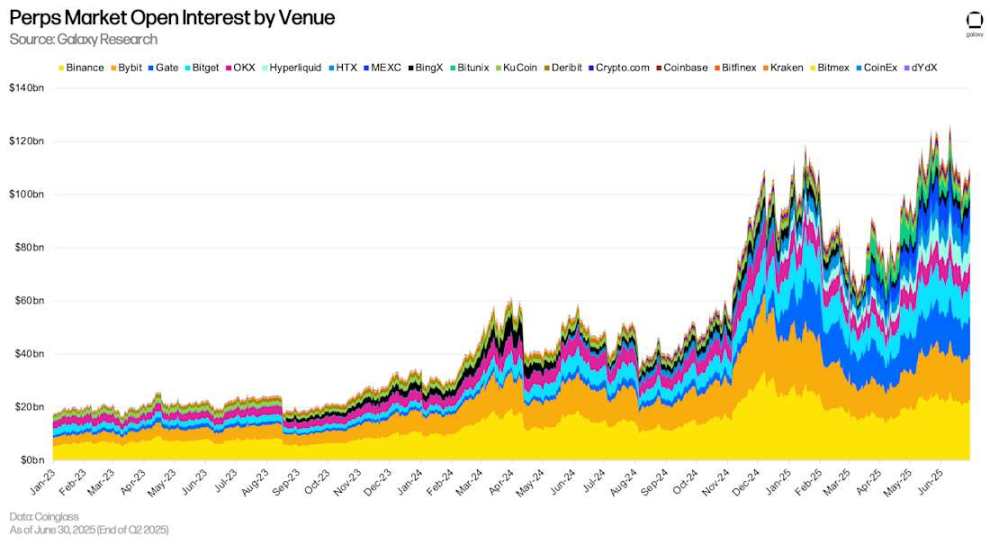
Perpetual Futures Open Interest by Platform
Conclusion
Leverage in the system continued to expand to new highs, with on-chain borrowing setting an all-time record and crypto-collateralized loans reaching multi-year highs. Growth drivers include: the reflexive relationship between borrowing and price appreciation; treasury firms leveraging up as a significant new source of demand; and the expansion of capital-efficient collateral in DeFi. This trend is mirrored in futures markets, where open interest also saw substantial growth.
Looking ahead, continued collaboration among DeFi participants and optimization of new collateral types suggest DeFi lending markets are poised for continued growth in the coming quarters. Meanwhile, CeFi lending also benefits from treasury firm activity and broader market optimism.
Join TechFlow official community to stay tuned
Telegram:https://t.me/TechFlowDaily
X (Twitter):https://x.com/TechFlowPost
X (Twitter) EN:https://x.com/BlockFlow_News