Which cryptocurrency exchanges are about to list on U.S. stock exchanges, and what are their valuations?
TechFlow Selected TechFlow Selected
Which cryptocurrency exchanges are about to list on U.S. stock exchanges, and what are their valuations?
With several cryptocurrency exchanges preparing for上市, it is important for investors to understand the relative valuations of these platforms.
By Tanay Ved, Victor Ramirez, Coin Metrics
Translated by AididiaoJP, Foresight News
Key Takeaways:
-
Kraken, Gemini, and Bullish are planning initial public offerings (IPOs) amid a favorable regulatory environment and clear investor interest in publicly traded crypto asset exposure.
-
Coinbase's 2021 IPO set an industry benchmark. At上市, Coinbase had a $65 billion valuation with 96% of its revenue coming from trading fees. Today, subscription and service revenue accounted for 44% in Q2 2025.
-
Among IPO candidates, Coinbase still leads with 49% of spot trading volume. Bullish and Kraken each hold 22%, rapidly expanding into new services.
-
Not all reported trading volumes are equally valuable. Round-trip transaction analysis reveals inflated activity on some platforms, highlighting the need to assess exchange quality and transparency.
Introduction
For most of cryptocurrency’s history, the U.S. government has been indifferent or even hostile toward the industry. But last week brought positive change.
The President’s Working Group on Digital Assets released a 166-page report outlining the current state of digital assets and proposing policy recommendations for building a comprehensive market structure. Simultaneously, SEC Chair Paul Atkins announced a "Crypto Agenda" in a public speech, aiming to make the U.S. the "global crypto capital" by tokenizing financial markets, streamlining the complex licensing process for crypto businesses, and supporting the creation of financial "super apps" offering multiple services.
The primary beneficiaries of this new regulatory framework are centralized exchanges. Several private centralized exchanges—including Kraken, Bullish, and Gemini—are leveraging this relatively favorable climate to pursue initial public offerings (IPOs). As these companies open up to public investment, it becomes essential for investors to understand their fundamental drivers. This article will deeply evaluate key metrics of these exchanges and highlight important caveats when using exchange-reported data.
The Crypto Exchange IPO Wave
Since Coinbase’s IPO in April 2021, there have been few crypto-related IPOs over the past four years, primarily due to the adversarial relationship between crypto firms and the former SEC administration. As a result, private companies were unable to access public market liquidity, and non-accredited investors could not profit from investing in them. With the Trump administration pledging a friendlier regulatory regime, a wave of new private crypto firms has announced listing plans.
This environment, combined with renewed investor appetite for public market crypto exposure, has sparked some of the most explosive IPOs—such as Circle’s recent public listing. Gemini, Bullish, and Kraken plan to list in the U.S., aiming to seize this opportunity and position themselves as full-stack digital asset providers.
Coinbase’s 2021 IPO
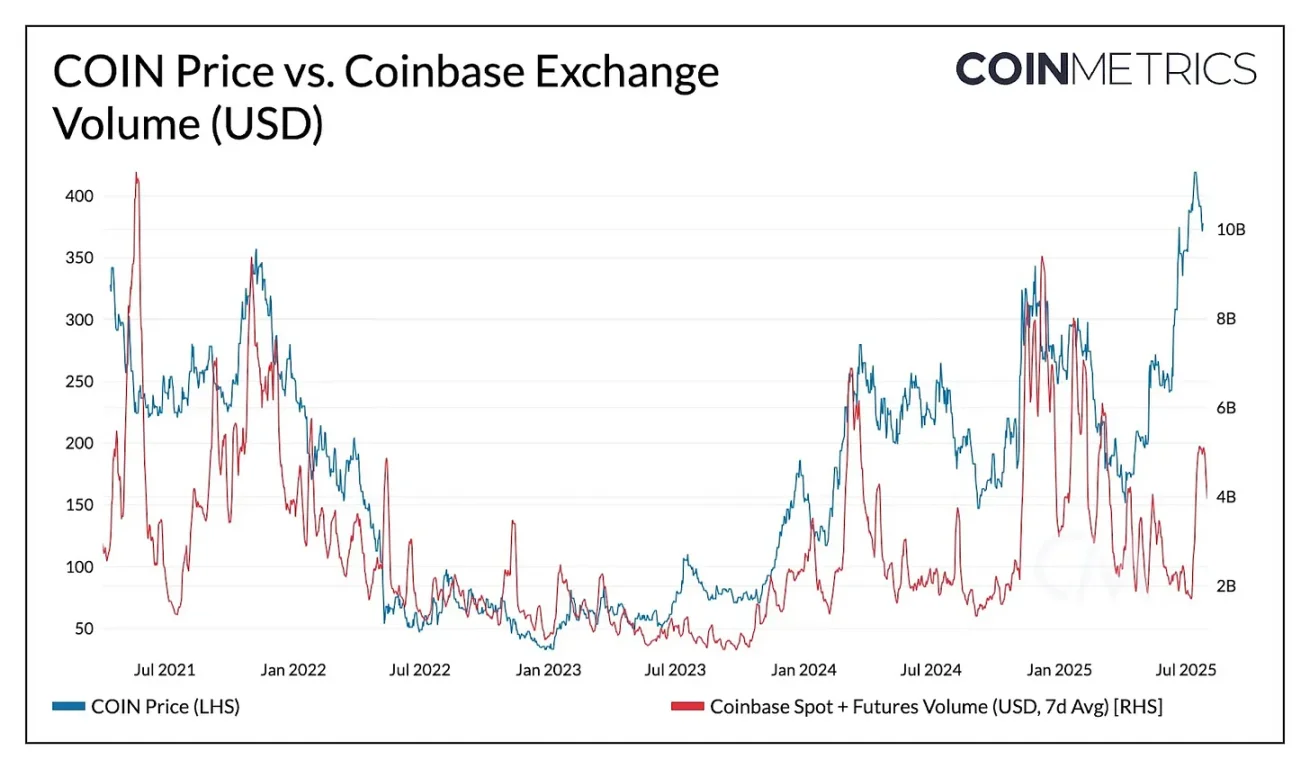
Coinbase’s 2021 IPO provides a useful benchmark for evaluating the investment potential of prospective exchange IPOs. The company went public via a direct listing on Nasdaq on April 14, 2021, with a reference price of $250 per share, implying a fully diluted valuation of $65 billion, and opened at $381. Coinbase’s上市 coincided with the peak of the 2021 bull market, when Bitcoin approached $64,000 and exchange trading volumes exceeded $10 billion.
According to its S-1 filing, Coinbase’s business model was very simple at the time, with the vast majority of revenue derived from trading fees:
“From inception through December 31, 2020, we generated over $3.4 billion in total revenue, primarily from volume-based trading fees charged to retail and institutional customers on our platform. As of December 31, 2020, transaction revenue accounted for more than 96% of our net revenue. We leverage the strength of our transaction business to expand and broaden our platform, launching new products and services through an investment flywheel and growing our ecosystem.”
Source: Coin Metrics Market Data Professional Edition and Google Finance
Today, Coinbase resembles more of a “full-stack exchange.” While trading remains core, its business model has significantly expanded across the entire stack of crypto services. This shift is beginning to reflect in the relationship between COIN’s price and trading volume—once tightly correlated, this link has weakened as the importance of “subscription and services revenue” (including stablecoin revenue (interest from USDC), blockchain rewards (staking), custody income, etc.) has grown:
Coinbase Q1 2021:
-
$1.6 billion in revenue
-
$1.55 billion in transaction revenue (96%)
-
$56 million in subscription and services revenue (4%)
Coinbase Q2 2025:
-
$1.5 billion in revenue
-
$764 million in transaction revenue (51%)
-
$656 million in subscription and services revenue (44%)
-
$77 million in corporate interest income (5%)
Comparative Analysis of Upcoming IPO Exchanges
Using this framework, we present estimated data on valuation, trading volume, and business scope for exchanges preparing for IPO.
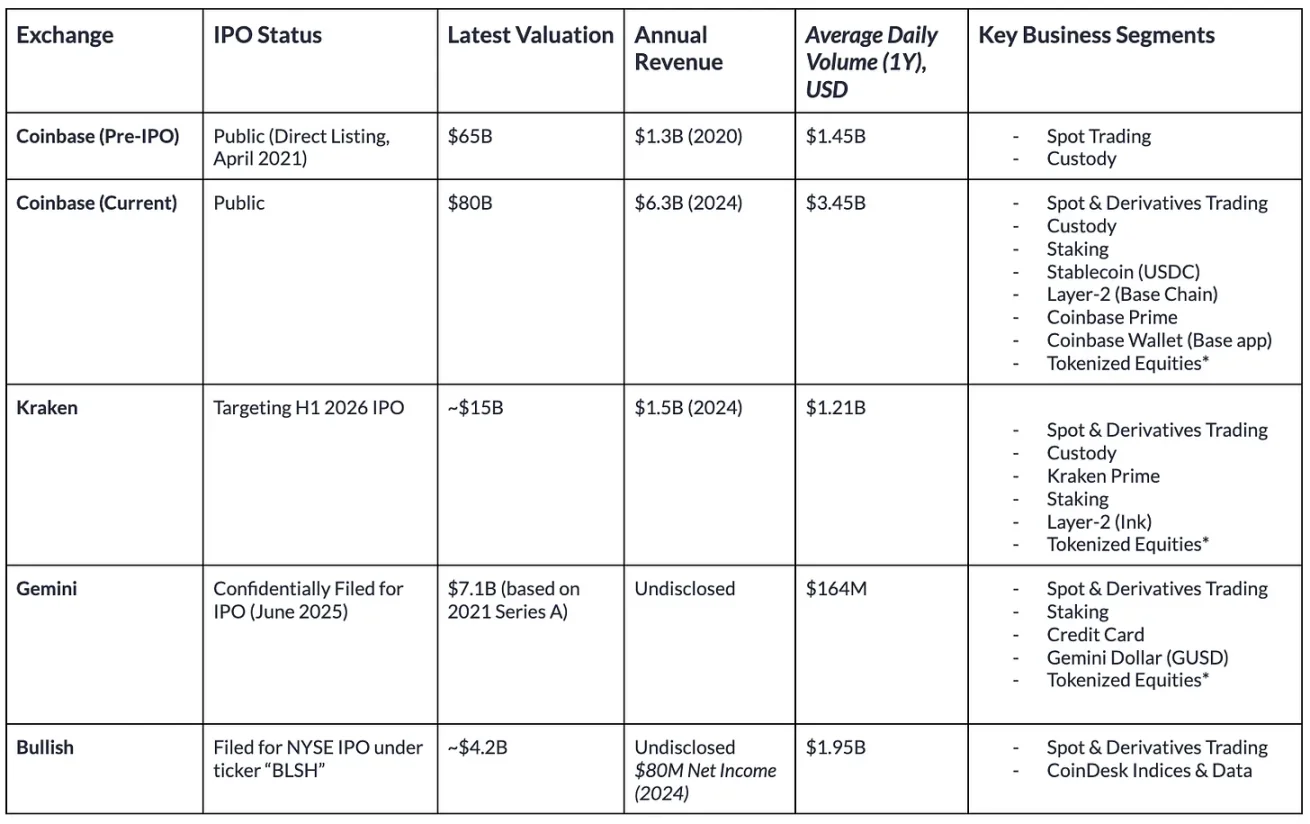
Source: Coin Metrics Market Data Professional Edition and public filings (data as of August 1, 2025)
Although these exchanges offer increasingly similar services, they differ significantly in market influence and scale of trading activity.
Kraken, founded in 2013, has reached a more mature stage. The company has shown strong financial growth, with $1.5 billion in revenue in 2024 (up 128% from 2023) and $412 million in Q2 2025. Kraken has also strategically expanded through the acquisition of NinjaTrader, obtaining a MiCA license in Europe, and entering fields such as tokenized stocks, payments, and on-chain infrastructure (Ink). With a target valuation of approximately $15 billion and 2024 revenue of $1.5 billion, its revenue multiple stands at 10x, slightly below Coinbase’s 12.7x.
In contrast, Gemini is smaller in scale. Its average daily trading volume over the past year was $164 million—the lowest among these exchanges. Gemini’s latest valuation traces back to its Series A round in 2021 at $7.1 billion, with private market estimates around $8 billion. Beyond spot and derivatives trading, Gemini offers staking and credit card products that generate yield on user deposits, and is also the issuer of Gemini Dollar (GUSD), though its circulating supply has declined to $54 million.
Bullish ranks highest in trading activity, with an average daily trading volume of $1.95 billion over the past year. Bullish Exchange is central to its trading and liquidity infrastructure, focusing on institutional clients and regulated in Germany, Hong Kong, and Gibraltar, while actively seeking U.S. licenses. Additionally, Bullish has expanded into information services through the acquisition of CoinDesk. According to its F-1 filing, the company reported a net profit of $80 million in 2024 and a net loss of $349 million. Based on a canceled SPAC deal in 2022, its initial valuation was close to $9 billion, but it is now reportedly seeking a $4.2 billion valuation.
Exchange Trading Volume Trends
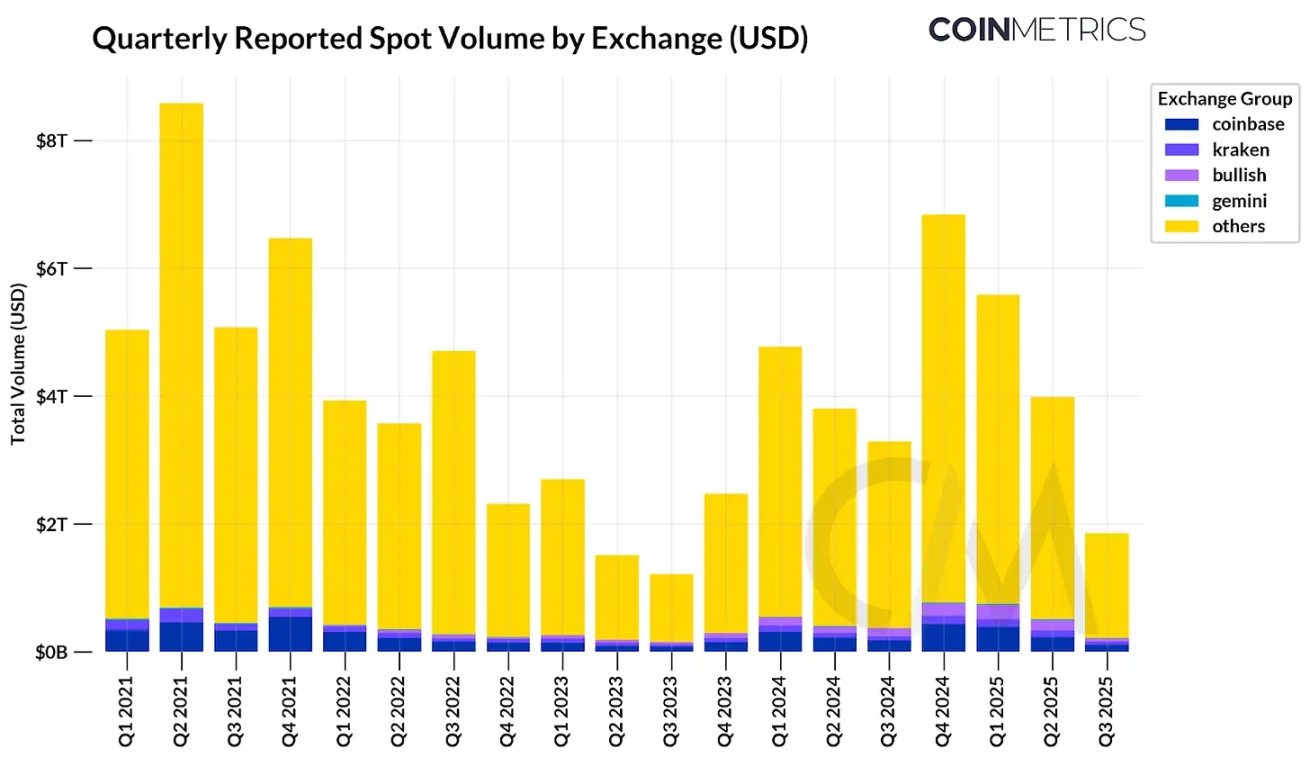
Source: Coin Metrics Market Data Professional Edition
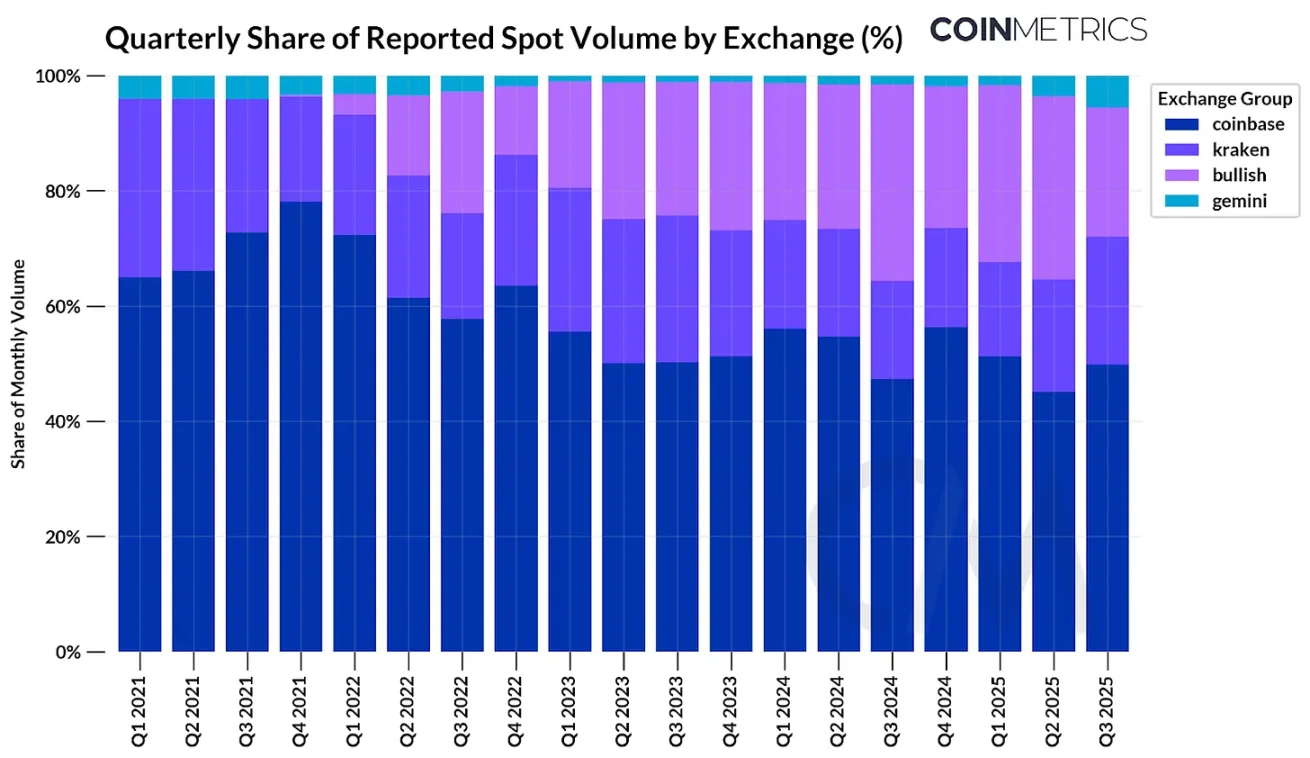
Overall, Coinbase and other upcoming IPO exchanges account for only about 11.6% of reported centralized exchange spot trading volume. Binance alone accounts for 39%, while other offshore exchanges also hold significant shares. Among the exchanges under review, Coinbase holds 49% of spot volume, with Bullish and Kraken each holding 22%. Bullish’s share has steadily increased since its launch in 2022, while Kraken’s market share has slightly decreased amid intensifying competition.
Order Book Trading: Analyzing Exchange Economic Activity
As noted above, trading volume is one of the most predictive indicators for estimating valuations. However, reported volumes can vary significantly across exchanges and may be misleading.
While most major crypto exchanges have cracked down on wash trading, some irregularities persist. Our Trusted Exchange Framework details how to detect anomalous trading activity and evaluates qualitative factors such as regulatory compliance.
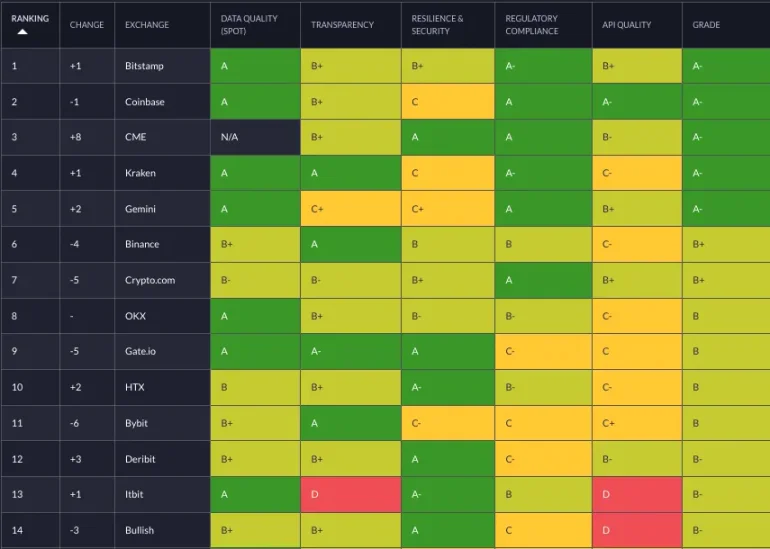
Source: Trusted Exchange Framework
A more robust signal we developed to detect buy-sell transactions is calculating the frequency of round-trip trades. Our testing methodology is as follows:
-
We randomly sampled 144 five-minute intervals from January to June 2025, generating nearly 20 million transactions.
-
For each exchange and interval, select one transaction.
-
If another transaction occurs within 10 transactions or 5 seconds, in the opposite direction, with nearly identical amount and price (<1%), mark both as a round-trip trade.
-
Repeat this process for each transaction. Skip if already marked.
-
Calculate the total volume marked as round-trip trades and divide by the total volume.
In the chart below, we plot transaction samples from several exchanges within one interval, marking suspected round-trip trades. Each gray dot represents a normal trade; green and red markers represent round-trip trades.
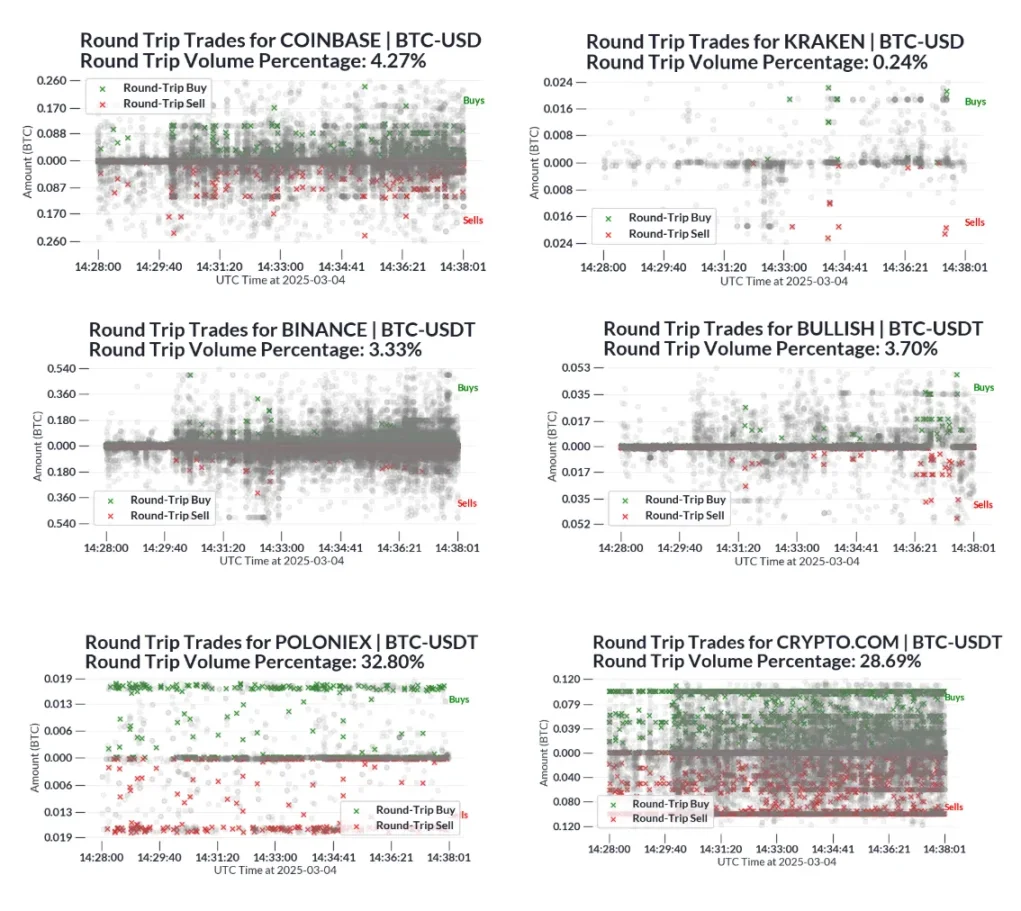
Source: Trusted Exchange Framework
Due to the approximations in this method, we expect some false positives—round-trip trades arising from normal market activity (e.g., market makers facilitating trades by providing liquidity on both sides of the order book). However, compared to industry baselines like Crypto.com and Poloniex, higher-than-average round-trip ratios raise concerns about the reliability of reported trading volumes.
For example: In Q1–Q2 2025, we estimate Crypto.com’s BTC-USD ($201 billion), BTC-USDT ($192 billion), ETH-USD ($165 billion), and ETH-USDT ($160 billion) trading volume totaled approximately $720 billion. Based on the estimated ratio above, roughly $160 billion of volume across these pairs came from round-trip trades.
Conclusion
With several crypto exchanges preparing for上市, investors must understand the relative trading volumes of these platforms. While volume helps estimate transaction revenue (still the largest portion of income), qualitative factors such as business diversification, presence of round-trip trading, and regulatory compliance are crucial in assessing exchange quality. This information can help market participants judge whether valuations are justified.
Four years after its IPO, Coinbase remains in the lead, largely due to diversification into revenue streams such as custody, stablecoins, and Layer-2 fees. However, competition in the exchange market is intensifying. For other exchanges to compete, they must diversify revenue beyond highly sentiment-dependent trading fees. As market structures become clearer, exchanges are being allowed to evolve from trading venues into full-service super apps. How these exchanges seize this opportunity, realize their visions, and replicate the success of past breakout IPOs will be a key development to watch in the coming year.
Join TechFlow official community to stay tuned
Telegram:https://t.me/TechFlowDaily
X (Twitter):https://x.com/TechFlowPost
X (Twitter) EN:https://x.com/BlockFlow_News