Bitcoin experiences wide fluctuations at high levels, with miners enjoying ample profits
TechFlow Selected TechFlow Selected
Bitcoin experiences wide fluctuations at high levels, with miners enjoying ample profits
Bitcoin market showed a wide-range fluctuation this week, with narrow consolidation in the early period and intense battle between bulls and bears later, leading to significantly increased market volatility.
Author: Mengqi
1. Bitcoin Market
From July 19 to July 25, 2025, Bitcoin's price movements were as follows:
July 19: Bitcoin opened with a volatile downward trend, falling from $117,930 to $117,073 before rebounding and rising to $117,912. It then continued its gradual climb, reaching $118,426 before weakening again. In the evening, it briefly dropped to $117,721 before stabilizing once more. The session closed at $118,113, indicating relatively balanced forces between buyers and sellers.
July 20: Bitcoin showed a slightly bullish narrow-range consolidation pattern overall. After opening, it dipped slightly to an intraday low of $117,544, then entered a typical step-by-step upward structure, gradually climbing past $118,117 and $118,287. By the end of the day, it further advanced to $118,731, signaling increasing bullish control.
July 21: Continuing the previous day’s momentum, Bitcoin rose to $118,778 before undergoing a technical pullback and quickly rebounding near $118,557. However, the market suddenly saw heavy selling pressure, plunging to a low of $116,914. Then, driven by strong buying, it experienced a rapid V-shaped reversal—recovering to $118,644 and even briefly breaking above $119,605. Although unable to sustain that high, it pulled back short-term to $118,016 before rallying again toward the close to $119,072, finally settling at $118,377. The day featured intense volatility and fierce battles between bulls and bears, reflecting significant short-term market nervousness.
July 22: Price maintained the prior day’s high volatility. Early in the session, it declined from $117,473 to a low of $116,762 before reversing higher. It moved upward for some time, recovering to $117,804, then fell again to $116,639, forming a double-bottom structure with solid support. In the afternoon, Bitcoin resumed its uptrend, steadily advancing and successfully breaking through the $119,000 mark, peaking at $119,429. Despite a brief pullback in the evening, bulls quickly regained control and sustained strength, closing at $118,956—indicating growing bullish conviction.
July 23: Carrying forward the previous session’s strength, Bitcoin kept rising after the open, hitting a recent peak of $120,204. However, it failed to break decisively through this key psychological level and gradually retreated to $117,915. Bulls and bears then engaged in intense combat, causing choppy trading, with prices dipping as low as $117,474—revealing fierce competition between both sides at elevated levels.
July 24: Bitcoin continued its wide-range consolidation near highs, with frequent shifts in power between bulls and bears during the day. In early trading, prices consolidated between $117,500 and $118,700. Then, bulls pushed higher, forming a brief consolidation phase around $119,000, peaking at $119,274. But upon reaching this local high, strong selling pressure emerged, triggering a sharp drop to $117,523. The market then staged another strong rebound, creating a new daily high of $119,373 late in the session. Prices pulled back slightly before closing, maintaining a highly volatile range—highlighting persistent disagreement within this trading zone.
July 25: Bitcoin retained the prior session’s high volatility, continuing its rebound momentum early on and reaching a high of $119,398. However, this level again acted as short-term resistance, after which the market entered a downtrend, rapidly falling back to around $117,850 and erasing all earlier gains. At the time of writing, Bitcoin was temporarily quoted at $117,859, still confined within the consolidation range. Overall, prices remain within a consolidation zone between $117,500 and $119,500. Without a strong breakout on increased volume, this sideways movement is likely to persist, and traders should remain cautious about sudden reversals.
Summary
This week, Bitcoin exhibited a broad consolidation pattern—starting with tight sideways movement and evolving into intense battles near highs, accompanied by significantly increased market volatility.
Specifically, from July 19 to 20, prices oscillated narrowly around the $118,000 mark, with limited fluctuations—typical of a buildup phase. Starting July 21, volatility intensified, with frequent intraday surges and deep pullbacks, resulting in clear wide-ranging swings. Prices repeatedly tested the $119,000 and $120,000 psychological levels but failed to break through effectively, indicating heavy overhead supply. Meanwhile, downside support remained firm—prices bounced sharply after touching a weekly low of $116,639—showing aggressive accumulation by bulls at critical support levels and intense capital battles.
The weekly high reached $120,204, while the low hit $116,639—a swing of 3.06%. Technically, the high-level consolidation remains intact, and the short-term bias leans moderately bullish. Key attention should be paid to whether the resistance zone between $119,000 and $120,000 can be broken and how well the support area between $117,500 and $116,500 holds. Future direction may depend on changes in trading volume and macroeconomic developments.
Overall, although Bitcoin did not achieve a decisive breakout this week, bullish momentum has started to emerge. A strong volume-driven move above key resistance could trigger a new trending phase. Conversely, a breakdown below critical support might lead to deeper corrections.

Bitcoin price trend (2025/07/19–2025/07/25)
2. Market Dynamics and Macro Background
Fund Flows
1. Capital rotates into altcoins; Bitcoin dominance declines
Market data shows Bitcoin dominance (BTC Dominance) has declined for eight consecutive days, dropping to 61.15% by July 20—below its 2024 annual high of 61.53%. This sustained decline signals the gradual onset of an “altcoin season.”
On July 22, Coingecko data revealed Bitcoin dominance had further slipped to 58.5%, primarily driven by strong performances from major altcoins such as Ethereum (ETH) and Ripple (XRP): ETH gained 25.0% over seven days, XRP rose 20.4%, while SOL and BNB climbed 15.4% and 10.2%, respectively.
Crypto analyst @DaanCrypto noted that most top 100 altcoins have outperformed Bitcoin over the past month—the core driver behind declining dominance.
2. Miners and whales sell heavily; exchange BTC inflows hit multi-week highs
As Bitcoin prices approached historic highs, on-chain data revealed large-scale selling activity:
On July 15, daily exchange inflows surged to 81,000 BTC—the highest since February
Inflows from whale transfers (over 100 BTC per transaction) spiked from 13,000 BTC to 58,000 BTC
Miners simultaneously transferred 16,000 BTC, nearly all destined for exchanges
Ethereum followed a similar trend: On July 16, 2 million ETH flowed into exchanges—the highest level since late February—indicating rising short-term profit-taking sentiment.
3. Various holder groups resume HODLing mode; capital flows into on-chain storage
Despite heightened short-term volatility, on-chain metrics show various types of holders are returning to accumulation behavior. A July 21 report from Glassnode indicated that from small retail investors to mega-whales holding tens of thousands of BTC, nearly all wallet size categories have re-entered “perfect HODL mode.” Whale wallet on-chain activity has returned to December 2024 levels, reflecting strong confidence in medium-to-long-term prospects.
4. Long-term holders increase distribution, but net long-term capital inflow trend remains intact
On July 24, CryptoQuant analyst Axel Adler Jr. pointed out that Bitcoin currently exhibits an abnormally high monthly Capital Divergence Degree (CDD) to annual CDD ratio—reaching 0.25, comparable to levels seen at the 2014 top and during the 2019 correction. This suggests long-term holders (LTHs) are reactivating dormant BTC for potential sale.
This phenomenon implies: experienced investors (especially old hands) are actively distributing holdings; the uptrend faces internal distribution pressure; current price levels have triggered profit-taking among early adopters.
However, Axel emphasized that despite LTH selling pressure: U.S. ETFs continue absorbing funds (see Section 5); treasury-grade capital continues allocating to assets. Therefore, this round of distribution is more likely a signal of slowing short-term gains rather than a fundamental trend reversal.
5. Spot ETFs see continuous inflows
Daily U.S. spot Bitcoin ETF inflow/outflow data this week:
-
July 21: -$131.4 million
-
July 22: -$68 million
-
July 23: -$85.8 million
-
July 24: +$194.2 million

ETF inflow / outflow data image
Despite outflows on certain days, U.S. spot Bitcoin ETFs remain fundamentally strong: On July 20, total on-chain holdings surpassed 1.285 million BTC—6.46% of total supply—with a market value of approximately $151.8 billion.
Meanwhile, Ethereum ETFs performed exceptionally well last week, recording $2.182 billion in net inflows—the highest single-week record ever—and double the previous week’s figure. Bitcoin ETFs also posted $2.385 billion in net inflows, ranking seventh-highest for weekly inflows (fifth two weeks prior). This trend indicates both mainstream asset Bitcoin and alternative mainstream asset Ethereum continue attracting sustained interest and active allocation from institutional and retail investors—further cementing ETFs’ role as a key tool for long-term digital asset investment.
In addition, positive signals emerged from Grayscale. On July 24, Grayscale Investments announced that its Grayscale Bitcoin Mini Trust ETF, listed on the New York Stock Exchange, has exceeded $5 billion in assets under management since its launch on July 31, 2024. As of July 23, AUM reached $5.415 billion, with cumulative BTC holdings totaling 45,721 coins—demonstrating rapid growth. Collectively, ETFs are becoming a major channel for mainstream capital entering the Bitcoin market, providing solid support to overall liquidity and price levels.
Technical Indicators Analysis
1. Relative Strength Index (RSI 14)
According to Investing.com, as of July 25, 2025, Bitcoin’s 14-day RSI stood at 39.963—within the “sell” signal zone. Typically, RSI operates between 30 and 70, with readings below 30 considered oversold and above 70 overbought.
The current RSI near 40 suggests the market is in a weak consolidation phase—bearish momentum prevails, though extreme oversold conditions haven’t materialized. This reflects cautious investor sentiment and lack of strong buying resurgence.
Although RSI hasn’t yet entered oversold territory, a subsequent rise above the 50 threshold would signal weakening bearish momentum and potential bull reclamation of control. Conversely, a drop below 35 would send stronger weakness signals, raising concerns about further downside.
2. Moving Average (MA) Analysis
-
5-day MA (MA5): $119,361
-
20-day MA (MA20): $115,362
-
50-day MA (MA50): $111,003
-
100-day MA (MA100): $100,906
Current market price: $117,480

MA5, MA20, MA50, MA100 data image
The current price trades between MA20 and MA5, suggesting the market is in a short-term corrective consolidation phase:
MA5 > Current Price > MA20: Indicates some short-term momentum slowdown, with the short-term moving average turning downward—reflecting profit-taking pressure.
MA20 clearly above MA50 and MA100: Confirms the medium-term uptrend remains unbroken, with long-term moving averages offering solid support.
If price regains footing above MA5 with expanding volume, short-term momentum may turn bullish. Conversely, losing MA20 could test support near MA50.
The moving averages display a classic bullish alignment, with healthy medium-to-long-term trends intact. As long as price doesn’t fall significantly below MA50, the overall structure remains bullish.
3. Moving Average Convergence Divergence (MACD) Analysis
Per Investing.com, as of July 25, the MACD fast line stood at -76.53. Both MACD lines remain below the zero axis, with the fast line continuing to cross below the slow line—forming a death cross and sending a clear “sell” signal. The histogram is expanding, indicating strengthening downward momentum and bearish dominance.
The widening death cross suggests the short-term downtrend may persist. If the histogram begins contracting and the death cross narrows, it could foreshadow a rebound phase—watch closely for a potential zero-axis crossover.
4. Key Support and Resistance Levels
Support Levels: Current key short-term support levels for Bitcoin are at $117,500, $117,000, and $116,500. Recent price action shows: On July 19, 21, and 22, BTC repeatedly fell near $117,000 and found effective support—indicating strong buying interest in this zone. During sharp drops on July 21–22, prices briefly touched $116,500 but quickly rebounded—confirming this level as a short-term bottom with strong anti-drop effectiveness. On July 24, multiple dips near $117,500 triggered rebounds, validating strong buying willingness and forming a credible short-term defense line. A break below $116,500 would shift focus to lower supports, including the $115,000 psychological level.
Resistance Levels: Current primary resistance zones are $119,000 and $120,000, with $119,000 being a repeated technical barrier in recent sessions. On July 21, 22, and 24, price tested $119,000 multiple times but failed to break through decisively—each approach or brief breakout led to retreats, showing heavy supply. On July 23, it briefly broke $120,000 but failed to hold, quickly retreating—confirming this level remains a key hurdle for bulls. Medium-term, a confirmed breakout above $120,000 could target $121,000.
Comprehensive Assessment
Overall, Bitcoin has consolidated within a $116,500–$120,300 range this week, awaiting a directional breakout. Short-term, rising support levels suggest bulls retain some appetite, but visible resistance persists without a strong breakout. The overall tone is neutral-to-bullish. A volume-backed breakout above $120,000 could challenge $121,000 and potentially ignite a new uptrend. Conversely, a drop below $116,500 risks negative sentiment and a test of $115,000–$114,000 for new support.
Market Sentiment Analysis
1. Sentiment Overview
This week, Bitcoin market sentiment remained generally positive and optimistic. Despite prolonged high-level consolidation and notable volatility, investors broadly demonstrated strong holding confidence and risk appetite. Repeated “roller-coaster” swings reflect intense battles between bulls and bears around key levels.
From July 19 to 20, Bitcoin traded in a narrow range—market sentiment was relatively cautious, with rising观望and no significant capital inflows or outflows—indicating investors preferred to wait for clarity at pivotal levels.
On July 21 and 23, the market saw classic “false breakouts + rapid reversals.” Bitcoin briefly cleared short-term resistance twice only to reverse sharply—highlighting insufficient bullish momentum and swift bear counterattacks, causing temporary sentiment swings. Frequent leveraged fund entries and exits amplified short-term volatility, leading to wild sentiment swings.
Overall, Bitcoin traded within a relatively high wide-range consolidation zone ($116,500–$120,300). While sentiment remains optimistic, the repeated interplay between bulls and bears introduces notable uncertainty. Bullish confidence persists, but lacks a clear breakout catalyst. Bears repeatedly press at key resistance—creating a classic high-level standoff.
2. Key Sentiment Indicator (Fear & Greed Index)
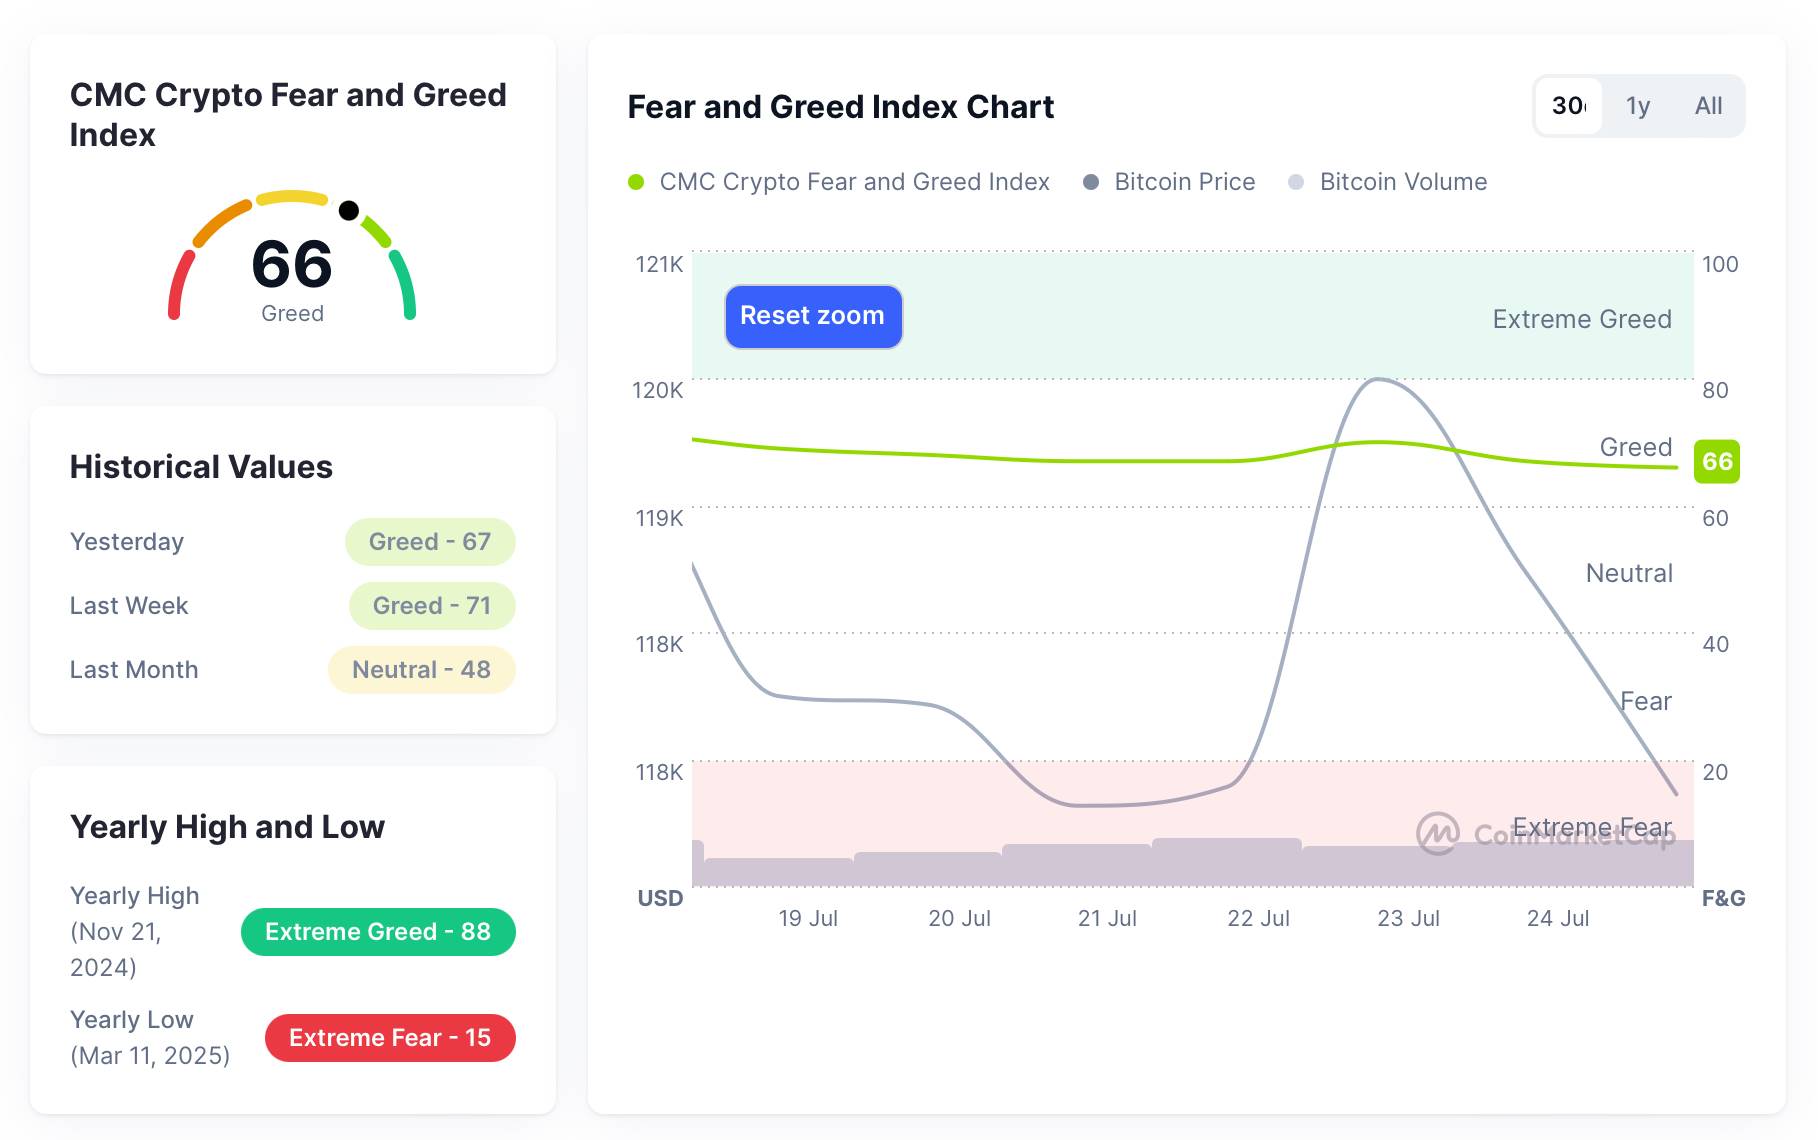
The Fear & Greed Index stood at 66 as of July 25—within the “Greed” range—indicating widespread bullish sentiment and willingness among participants to stay long at elevated prices. Despite large price swings, overall risk appetite remained high, with retail and some institutional investors actively positioning.
Reviewing the week (July 19–24), daily Fear & Greed Index values were: 69 (Greed), 68 (Greed), 67 (Greed), 67 (Greed), 70 (Greed), 67 (Greed). The index stayed consistently within the 67–70 range—exhibiting minimal fluctuation and hovering near the upper edge of the “Greed” zone. This suggests that despite short-term technical pullbacks, sentiment hasn’t suffered real damage. Such a structure often indicates the market may have entered a plateau of elevated sentiment—without fresh upward drivers, a sentiment correction could follow.
Of particular concern: when the Fear & Greed Index stays elevated while price fails to break key resistance zones, the market may accumulate hidden divergence risks. Watch for potential pullbacks due to “overheated sentiment.”
In summary, based on the interplay between sentiment indicators and price action, this week’s Bitcoin market remained in a strong high-level consolidation phase. Investor sentiment is optimistic but shows signs of hesitation at highs and capital rotation. Persistent greed combined with short-term volatility places the market in a highly sensitive critical stage. Next week, if price fails to break and hold previous highs and key psychological levels, sentiment may transition from optimism to caution. Investors should closely monitor volume changes, on-chain fund flows, and macro catalysts to guard against price retracements caused by short-term sentiment swings.
Fear & Greed Index data image
Macro Economic Background
1. Trump’s 'Fed Pressure Campaign'
On July 24, Trump unexpectedly visited the Fed headquarters, criticizing over $700 million in renovation cost overruns as a pretext to pressure Fed Chair Powell for aggressive rate cuts—and hinted at possible personnel changes.
The move was interpreted as interference in central bank independence. While it didn’t immediately trigger severe dollar turmoil, it clearly increased policy uncertainty—boosting demand for safe-haven assets like Bitcoin.
2. Powell’s Speech and Key Economic Data Combo
On July 22, Powell reiterated at a European conference: “The Fed will remain data-driven and won’t be swayed by political motives,” implying rate cuts won’t be influenced by current pressures.
From July 23–24, a wave of key data—including existing home sales, new home starts, manufacturing and services PMIs, and earnings from about 112 companies—was released. If core inflation data comes in weaker than expected, it could reignite market expectations for rate cuts—channeling capital into Bitcoin.
3. China’s Economic Recovery Boosts Global Risk Appetite
On July 21, China’s Q2 GDP grew 5.2% year-on-year—above market expectations—reviving global risk appetite and driving capital into risk assets.
At the same time, easing trade tensions, along with choppy consolidation in U.S. equities, have gradually shifted capital toward crypto assets.
4. Capital Rotation Trend: Bitcoin’s Safe-Haven Role Emerges
On July 22, latest analysis showed Bitcoin’s correlation with traditional stock markets (S&P, Nasdaq) has dropped to around 0.2—capital flows into crypto when stocks pull back.
Since early July, Bitcoin has gained 3.5%, maintaining a market cap between $3.4–4 trillion. Weakness in U.S. equities provided short-term upside momentum.
5. Traditional Finance Embraces Crypto Ecosystem Further
On July 22, JPMorgan Chase reportedly considered including crypto assets (BTC/ETH) in its credit collateral system—marking a larger-scale institutional entry.
This shift is seen as a signal of institutional adoption, helping reduce crypto market volatility and deepen market depth.
6. Massive ETF Capital Inflows
As of July 23, U.S. spot Bitcoin ETF net inflows had surpassed $54.8 billion by mid-July, with two consecutive days of over $1 billion in daily inflows in early to mid-July.
Such capital inflows provide solid price support and explain the recent rally.
3. Hash Rate Changes
From July 19 to July 25, 2025, Bitcoin network hash rate fluctuated as follows:
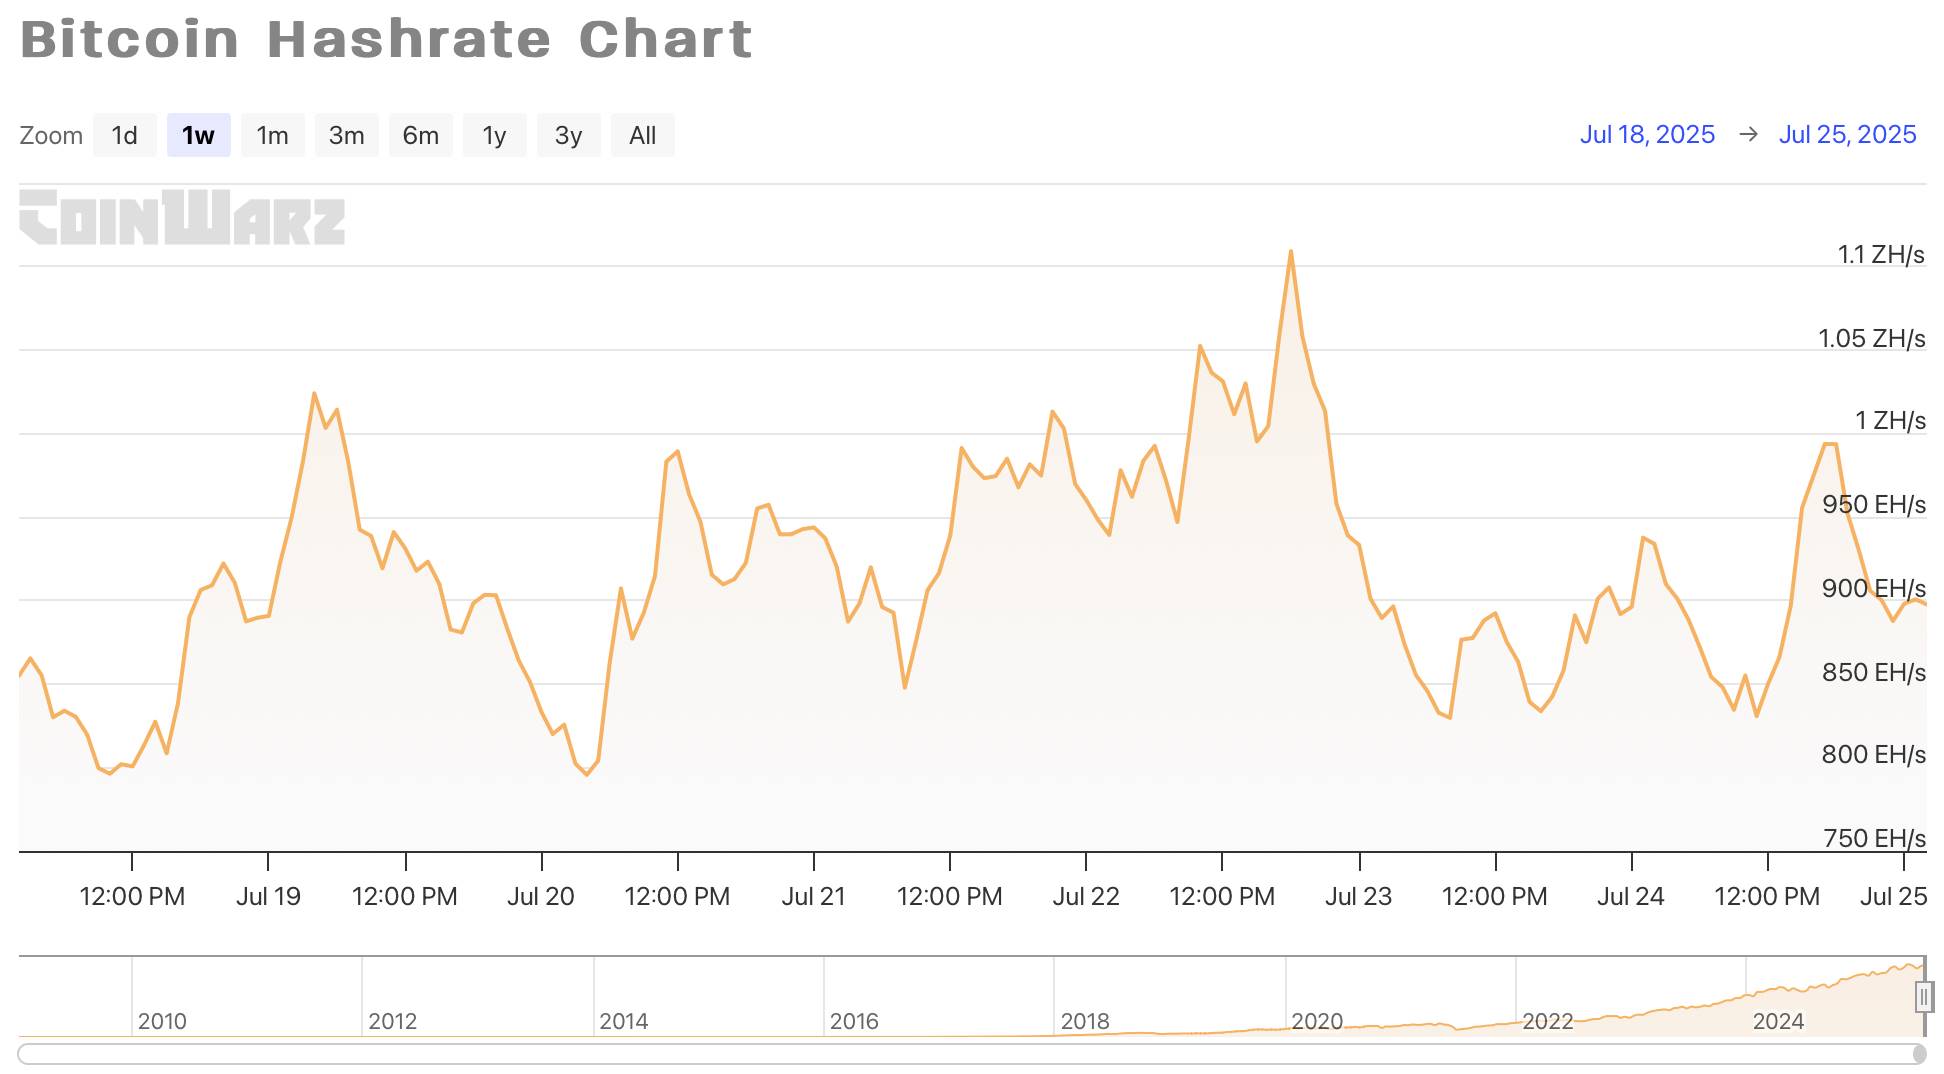
On July 19, the global hash rate first rose, climbing from 890.76 EH/s to 1.0240 ZH/s (i.e., 1,024.0 EH/s), then gradually declined, ending the day at 833.26 EH/s—suggesting miners may have conducted short-term power-downs or maintenance after high-load operation. On July 20, the hash rate steadily recovered from a low of 795.58 EH/s to 989.33 EH/s. Though it briefly pulled back to 909.64 EH/s, it closed at 943.78 EH/s—showing an overall recovery trend. On July 21, hash rate volatility intensified—plunging to 847.81 EH/s before rapidly rebounding, reaching 975 EH/s at noon and peaking at 1.0131 ZH/s in the evening—indicating quick miner recovery following temporary power or environmental restoration.
On July 22, the hash rate dipped slightly to 939.25 EH/s before gradually climbing to 992.62 EH/s and 1.0524 ZH/s—peaking at 1.1092 ZH/s, the week’s highest. However, it couldn’t sustain this level and sharply retreated, closing at 933.24 EH/s—suggesting large fluctuations may relate to intermittent miner farm operations. On July 23, the hash rate continued its pullback, plunging intra-day to 829.70 EH/s—returning to early-week lows—indicating miners may still face operational cost or external power challenges. It briefly recovered to 892.35 EH/s at midday, then dipped again, though the pace slowed. In the evening, hash rate stabilized and slowly climbed to 937.62 EH/s—signaling network hashrate repair.
On July 24, the hash rate dipped again in early hours to 830.78 EH/s before beginning a clear recovery, reaching an intra-day high of 993.70 EH/s in the afternoon. However, this level wasn’t sustained and later retreated to 887.72 EH/s. The overall trajectory showed partial recovery.
Between July 19 and 25, 2025, Bitcoin’s global hash rate showed an initial "volatile rise followed by a high-level drop." During the first half of the week (July 19–22), hash rate generally climbed, with lower troughs rising—reflecting improving network stability and resumption of large mining farms. The peak occurred on July 22, reaching 1.1092 ZH/s. However, this high wasn’t sustained and soon saw a sharp decline—possibly linked to strategic miner shutdowns, electricity price fluctuations, or environmental changes. In the second half (July 23–24), hash rate plunged to early-week lows, bottoming at 829.70 EH/s, but then gradually stabilized and recovered—reaching 993.70 EH/s on July 24. Despite a final pullback, the overall pattern showed volatile recovery—indicating the network’s resilience and miners’ flexible response to changing conditions.
Overall, this week’s hash rate movements reflect miners’ sensitivity and adaptability. On one hand, external factors like power costs and climate cause strong short-term volatility in hashrate. On the other, attractive prices drive rapid recovery—showing miners’ strong intent to maintain output. If external conditions stabilize, hash rate is expected to gradually return to higher levels.
Bitcoin network hash rate data
4. Mining Revenue
According to YCharts data, Bitcoin miners' daily total revenue (including block rewards and transaction fees) this week was: July 19: $55.14 million; July 20: $55.35 million; July 21: $55.85 million; July 22: $56.70 million; July 23: $52.38 million. Overall, daily miner income fluctuated between $52 million and $57 million—more stable compared to last week. Despite a slight dip on July 23, the range remained narrow—reflecting a relatively stable environment of block generation and transaction activity.
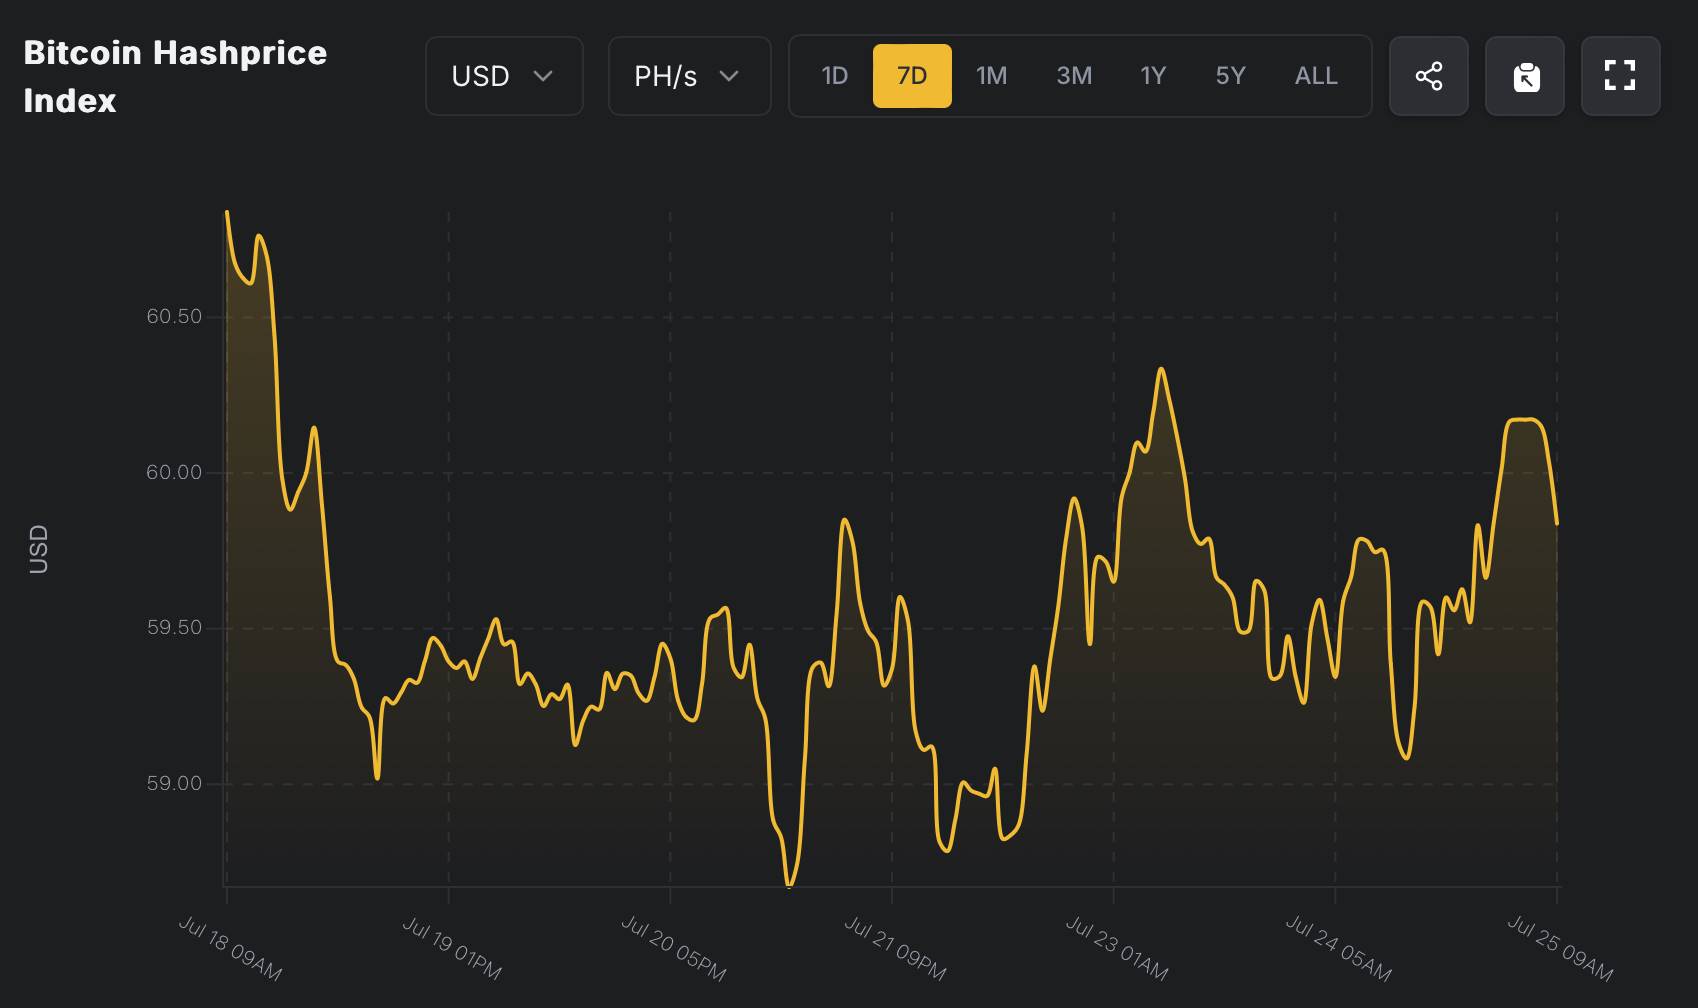
From the perspective of daily revenue per unit of hashrate (Hashprice), Hashrate Index data showed Hashprice remained stable this week. At the time of writing on July 25, Hashprice stood at $59.65 per PH/s/day. This week, Hashprice was generally stable, showing a mild upward trend. Its lows gradually rose—indicating improved unit efficiency and slightly better mining returns.
July 23 marked the weekly high, with Hashprice reaching $60.33 per PH/s/day—showing short-term recovery momentum in mining profitability. On July 25, Hashprice was $60.10 per PH/s/day—second-highest of the week. Overall, Hashprice fluctuated minimally this week—indicating a relatively stable phase where miner revenue structures didn’t undergo drastic changes. On a monthly scale, current Hashprice sits at the median of the past 30 days, with price volatility converging over the past two weeks—suggesting the market is emerging from earlier turbulence toward normalization. On a quarterly basis, Hashprice is at a medium-high level over the past three months—still acceptable for most efficiently run miners, supporting continued commitment to hashrate investment.
This steady improvement in Hashprice relates to slowing growth in network-wide hash rate. With competitive pressure not significantly rising and Bitcoin price remaining high, unit mining returns have seen phased recovery—favorable for boosting short-to-medium-term mining activity.
Hashprice data
5. Energy Costs and Mining Efficiency
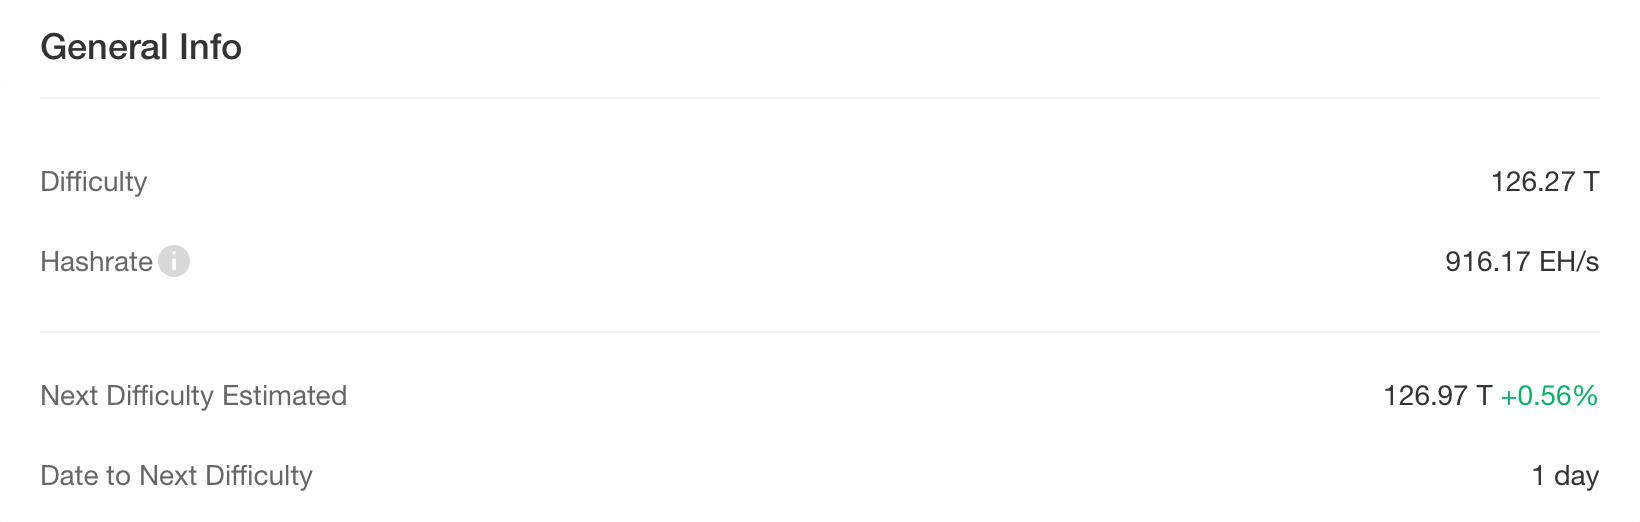
According to CloverPool, as of July 25, 2025, Bitcoin’s global hashrate had risen to 916.17 EH/s, with mining difficulty at 126.27 T. The next difficulty adjustment is expected on July 26, with an estimated increase of about 0.56%—raising difficulty to 126.97 T. This reflects miners’ ongoing optimism about network prospects and rising competitive intensity.
Bitcoin mining difficulty data
From a cost perspective, according to MacroMicro’s latest model, the average production cost as of July 20 was approximately $95,333—compared to a spot price of $117,300, yielding a cost-to-price ratio of about 0.81. Latest data from July 23 showed a cost of ~$94,905 and a spot price of ~$118,755—cost ratio of 0.80—maintaining within the 0.80–0.81 range. This cost ratio implies miners enjoy an average gross margin of about 20%. Additionally, the Puell Multiple remains between 1.38–1.39—block reward value exceeds the annual average—indicating relatively attractive miner revenues. Moreover, daily issuance from July 19–24 remained stable at 437–469 BTC, with total market cap between $2.33–2.39 trillion—ensuring steady supply-demand balance and stable price-cost relationships.
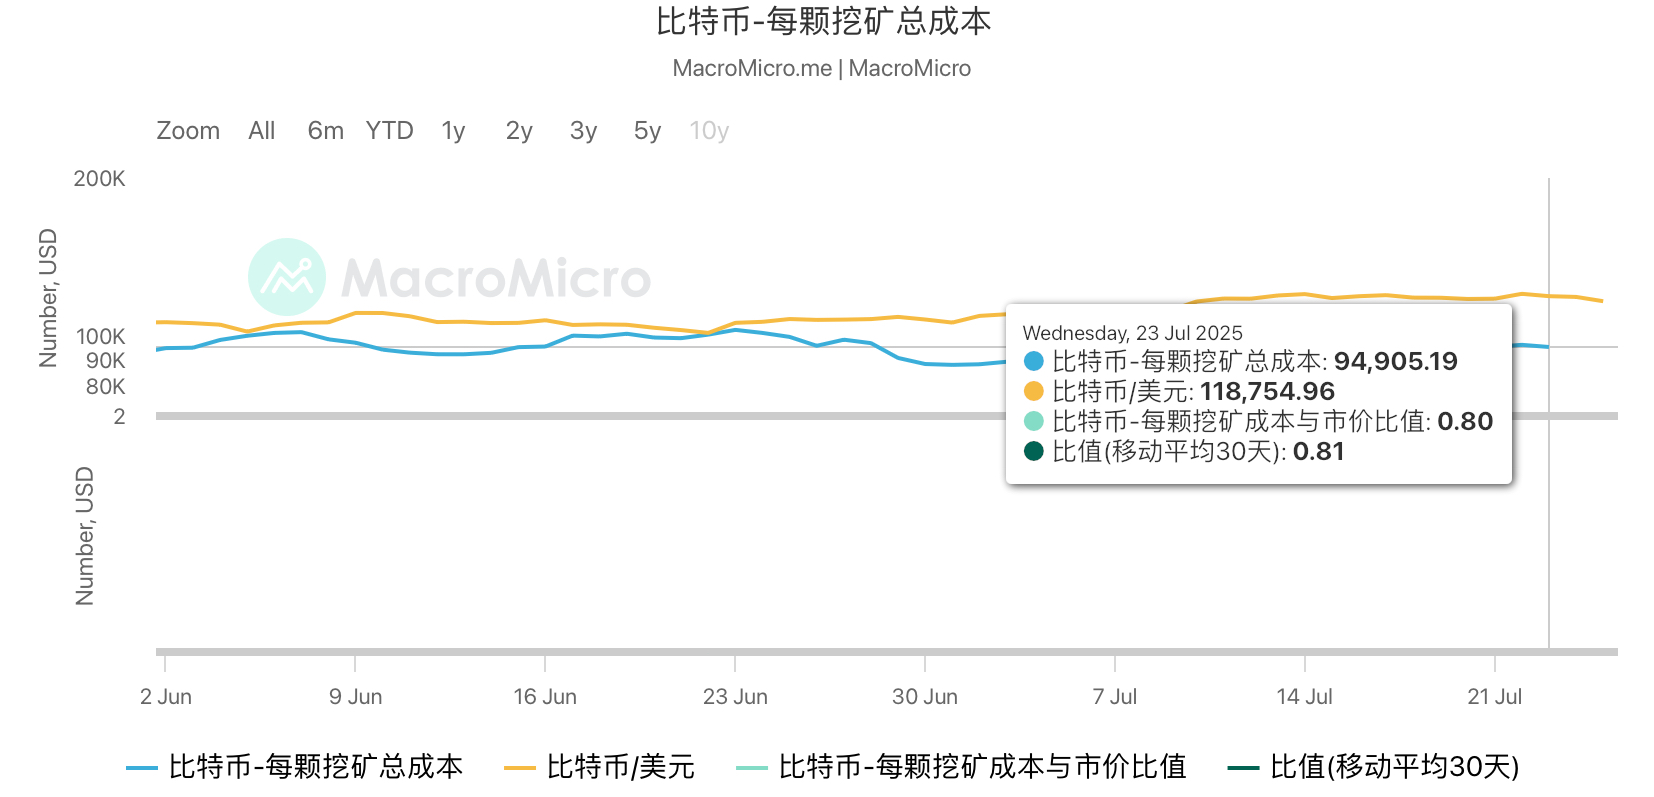
Total mining cost per Bitcoin data
This week, Bitcoin mining remained profitable. Although unit production costs rose slightly, high spot prices kept the cost-to-price ratio near 0.80—leaving miners with roughly 20% profit margins and ample cash flow. Rising global hashrate and expected difficulty increases reflect strong miner confidence and intensifying industry competition. However, as mining difficulty hits new highs, high-energy, low-efficiency mining operations face elimination pressure. Future profitability will hinge on Bitcoin price trends and miners’ ability to optimize energy efficiency or relocate to low-electricity-cost regions. Overall, the mining sector runs stably in the short term—but remains exposed to risks from energy cost fluctuations and market volatility.
6. Policy and Regulatory News
IMF confirms El Salvador’s Bitcoin holdings unchanged; purchases align with agreement commitments
On July 20, El Salvador’s finance minister and central bank governor confirmed to the International Monetary Fund (IMF) that the government has not purchased additional Bitcoin since signing a funding agreement in February 2025—keeping its Bitcoin holdings unchanged, with relevant wallet addresses provided to the IMF for monitoring. On July 24, the IMF further stated that Bitcoin accumulation by El Salvador’s Strategic Bitcoin Reserve Fund complies with plan conditions—total BTC in government wallets remains unchanged, fulfilling agreement commitments. These statements contrast with President Bukele’s claim of “buying 1 Bitcoin daily.” The IMF clarified that Bitcoin balance growth merely reflects internal consolidation—not a violation of agreement terms.

Related Images
7. Mining Industry News
Brazilian miners warn retaliatory tariffs on U.S. could bring $1 billion in losses
On July 22, Brazil’s mining industry warned that if the government imposes retaliatory tariffs in response to U.S. President Trump’s threatened 50% tariff starting August 1, it would result in severe economic consequences.
Raul Jungmann, head of Brazil’s mining association (Ibram), said that if Trump carries out the threat and Brazil responds with equivalent measures, the mining sector could face up to $1 billion in additional annual costs. Brazilian mining executives are considering engaging with U.S. firms to push the Trump administration back to negotiations.
Bitcoin miner Mawson fires CEO over alleged fraud and misconduct
On July 22, The Miner Mag reported that Bitcoin mining and hosting company Mawson Infrastructure has fired its CEO and President Rahul Mewawalla and removed him from the board—citing breach of fiduciary duties and fraudulent conduct. Mawson has filed a lawsuit in Delaware Chancery Court seeking damages.
Mewawalla had previously received a $2.5 million bonus and 1.2 million restricted shares for “high performance,” with his salary raised to $1.2 million. In response, he denied any wrongdoing, highlighting that under his leadership, company revenue grew 36% and gross profit rose 35%.
In addition, Mawson has recently been involved in litigation with NYDIG and its parent Stone Ridge over custody disputes involving over 20,000 miners worth $30 million.

Related image
Russian official: State should confiscate crypto from illegal miners
On July 23, Russian Public Chamber member and policymaker Yevgeny Masharov said authorities should be empowered to seize cryptocurrencies from illegal or quasi-legal Bitcoin miners. Masharov believes this proposal would deter “gray” miners by making illegal mining unprofitable.
He added that illegal miners in many regions place immense strain on power grids, and if adopted, this measure would relieve pressure—“especially in energy-scarce regions.”
8. Bitcoin Related News
Global Corporate Bitcoin Holdings (Weekly Update)
1. El Salvador (Nation):
According to mempool data on July 20, El Salvador’s national Bitcoin holdings surpassed 6,200 BTC, now standing at 6,242.18 BTC—worth approximately $736 million. This marks the country’s continued execution of its “national Bitcoin policy,” steadily accumulating digital asset reserves.
2. UK Vaultz Capital
On July 21, UK-listed company Vaultz Capital announced it acquired 20 additional bitcoins, bringing its total BTC holdings to 70 after this week’s purchase. The company has recently accelerated its Bitcoin allocation as part of its digital asset strategy.
3. Europe The Blockchain Group
Per an official announcement on July 21, European-listed firm The Blockchain Group bought 22 BTC this week—investing about €2.2 million. Latest figures show its total Bitcoin holdings have reached 1,955 BTC, with a year-to-date holding return of 1,373.2%—demonstrating strong investment performance.
4. U.S. Sequans Communications
On July 21, U.S.-listed Sequans significantly increased its Bitcoin holdings by 1,264 BTC—worth about $150 million—raising its total from 1,053 BTC to 2,317 BTC, making it one of the largest Bitcoin acquirers among U.S. public companies this week.
5. U.S. Genius Group
On July 21, U.S.-listed Genius Group announced another 20 BTC purchase, raising its total holdings to 200 BTC. The company has consistently increased its BTC position in recent years to enhance asset diversification.
6. Australia Monochrome (IBTC Spot ETF)
Data disclosed on July 22 showed that Australia’s Monochrome IBTC spot Bitcoin ETF held 954 BTC as of July 21—worth approximately AUD 175 million at market prices—indicating continued institutional inflows into the spot Bitcoin market.
7. Canada Belgravia Hartford
On July 24, official announcement revealed Canadian firm Belgravia Hartford purchased 25 BTC, bringing its total holdings to 40.8 BTC.
Public Company Bitcoin Treasury Updates (This Week)
1. U.S. public company Aether Holdings to raise $40 million to buy Bitcoin
On July 19, Aether Holdings announced plans to raise $40 million—most of which will be used to purchase Bitcoin as part of its financial reserve strategy. At publication, the company’s market cap was $158 million.
2. Swedish public company H100 Group AB completes private placement to advance Bitcoin treasury strategy
On July 21, H100 Group AB completed a private placement raising about $1.3 million to advance its Bitcoin treasury strategy.
3. Indian public company Jetking expands Bitcoin reserves
On July 21, Jetking’s board approved a private placement to raise INR 1.15 billion—primarily to increase Bitcoin holdings, fund general operations, and support Bitcoin education initiatives.
4. U.S. public company Profusa signs $100 million financing deal and launches Bitcoin reserve strategy
On July 21, Profusa (Nasdaq: PFSA) signed an equity credit agreement with Ascent Partners to raise up to $100 million—intended to purchase Bitcoin as a core asset.
5. Trump Media Tech Group’s Bitcoin reserves reach $2 billion
On July 21, Trump Media Tech Group (DJT.O) announced its Bitcoin reserves have reached $2 billion and will continue acquiring Bitcoin and related assets.
6. K Wave Media partners with Galaxy Digital to advance Bitcoin strategy
On July 22, K Wave Media (Nasdaq: KWM) announced a strategic partnership with Galaxy Digital—having already acquired 88 BTC and secured nearly $1 billion in institutional funding.
7. EV company Volcon buys 280 BTC for the first time, completes $500 million private placement
On July 22, U.S.-listed Volcon bought 280.14 BTC for the first time and completed a private placement of over $500 million—to fund its Bitcoin strategy deployment.
8. Mexican real estate group Grupo Murano plans $10 billion Bitcoin treasury
On July 22, Grupo Murano announced a $1 billion investment in Bitcoin—with plans to build a $10 billion Bitcoin asset reserve within five years.
9. Swedish company Fragbite Group buys Bitcoin for the first time
On July 22, Fragbite Group announced its first Bitcoin purchase of approximately 4.3 BTC—launching its corporate Bitcoin treasury strategy.
10. Japanese textile company Kitabo plans to buy $5.4 million in Bitcoin
On July 22, Japan’s Kitabo announced plans to acquire ¥800 million (~$5.4 million) in Bitcoin as part of its new financial strategy.
11. Japanese public company Metaplanet’s Bitcoin holdings grow 66x in one year, reaffirming Bitcoin treasury strategy
On July 23, Metaplanet CEO Simon Gerovich stated on social media that the company held only 246 BTC a year ago—now holding 16,352 BTC, a 66-fold increase. Metaplanet will firmly advance its Bitcoin treasury strategy established 15 months ago and continue striving toward the “1% Club.”
12. Canadian public company Matador secures $100 million funding for Bitcoin treasury development
On July 23, Canadian-listed Matador announced securing $100 million in funding to advance its Bitcoin treasury construction plan.
13. Canadian public company Planet Ventures plans to raise CAD 5 million to buy more Bitcoin
On July 23, Canadian-listed Planet Ventures announced plans to raise up to CAD 5 million (~$3.7 million) via convertible debt to further increase Bitcoin holdings and strengthen its Bitcoin treasury position.
14. Swedish public company Hilbert Group secures $15.8 million financing deal to buy Bitcoin
On July 23, Swedish firm Hilbert Group signed a structured financing agreement with LDA Capital worth 150 million SEK (~$15.8 million). Funds will be drawn flexibly over 36 months to gradually increase Bitcoin holdings. Hilbert will continue advancing its Bitcoin treasury strategy.
15. Canadian public company Sixty Six Capital adds 16.02 BTC via ETF
On July 24, Canadian-listed Sixty Six Capital announced it indirectly acquired 16.02 BTC by purchasing 114,000 units of Bitcoin ETF BTCC.B—bringing its total holdings to 148.8 BTC. The company clearly positions itself as a “Bitcoin treasury + crypto investment firm” and plans to convert ETF-held BTC into physical BTC whenever feasible.
16. Nativo Resources announces adoption of Bitcoin as fiscal reserve strategy
On July 24, London-listed Nativo Resources (LON:NTVO) announced adoption of a digital asset fiscal policy—allocating part of its cash flow and financing proceeds to hold Bitcoin. The company views BTC and gold as complementary inflation-hedging reserve assets and has partnered with Copper.co for custody. The board stated that despite price volatility and regulatory risks, Bitcoin will remain one of its core fiscal tools.
17. Satsuma raises $135 million, setting UK Bitcoin treasury financing record
On July 24, Satsuma Technology successfully raised £100 million (~$135 million) to establish a corporate Bitcoin treasury. If fully converted to BTC, it would become the UK’s second-largest corporate Bitcoin holder. The current record is held by The Smarter Web Company with 1,600 BTC.
18. Strategy raises funding target to $2 billion to buy more Bitcoin
On July 24, market reports indicated Strategy (formerly MicroStrategy) has increased its fundraising target from $500 million to $2 billion for Bitcoin purchases. Earlier, on July 22, Strategy announced an IPO of 5 million STRC shares, with proceeds intended for Bitcoin acquisition and other corporate uses.
Tim Draper: Macro factors will weaken Bitcoin halving cycle impact
On July 20, Tim Draper, founder and partner at venture capital firm Draper Associates, said in an interview that macroeconomic factors—including USD depreciation—will diminish the influence of Bitcoin’s halving cycle. Since 2009, Bitcoin’s boom-and-bust cycles have stemmed from this halving mechanism.
“The dollar will disappear in the next 10 to 20 years,” Draper said in the interview. “The world is changing, and we’re witnessing it. We are undergoing a major leap in human civilization,” he added.
Join TechFlow official community to stay tuned
Telegram:https://t.me/TechFlowDaily
X (Twitter):https://x.com/TechFlowPost
X (Twitter) EN:https://x.com/BlockFlow_News