Interview with DeFi Report Founder: 10 Charts Reveal the Prelude to Ethereum's Bull Market, Institutional Capital Could Be the Biggest Driver
TechFlow Selected TechFlow Selected
Interview with DeFi Report Founder: 10 Charts Reveal the Prelude to Ethereum's Bull Market, Institutional Capital Could Be the Biggest Driver
The market's trust and confidence in Ethereum are continuously strengthening.
Compiled & Translated: TechFlow
Guest: Mike Nadeau, Founder of DeFi Report
Host: Ryan Sean Adams
Podcast Source: Bankless
Original Title: 10 Bullish ETH Charts
Release Date: July 17, 2025
Key Takeaways
Ethereum's momentum continues to build—but is the real bull market only just beginning?
Mike Nadeau from DeFi Report joins us to dive deep into Ethereum’s Q2 fundamentals and shares 10 of the most bullish charts from his latest report.
We’ll explore whether institutional demand could be the key driver behind this rally, how ETF flows and treasury holdings are accelerating the trend, and whether Ethereum remains undervalued despite recent gains.
We'll also examine the Genius Bill, stablecoin growth trends, on-chain real-world assets (RWA), and key on-chain metrics that could fuel Ethereum’s next bull run.
Highlights Summary
-
An early rotation of capital from Bitcoin to Ethereum appears to be underway—and this trend may persist longer and have deeper implications.
-
With support from the Genius Bill, all major banks will likely launch their own stablecoin strategies.
-
Market trust and confidence in Ethereum continue to strengthen.
-
Ethereum now holds $7.5 billion in assets, a figure expected to grow exponentially. Stablecoins and potentially tokenized stocks in the future will be primary drivers of this growth.
-
Crypto markets are highly reflexive—sometimes the price of ETH itself becomes the catalyst. Rising ETH prices attract more assets on-chain, bring in more users, and improve other fundamental metrics.
-
Key Data: Active loans on Ethereum up 98%; on-chain RWA annual growth at 200%; AUM on Ethereum at an all-time high; CEX ETH balances at historic lows
Introduction
Ryan:
ETH prices are rising—we’re sharing 10 of the most bullish Ethereum charts today. We're joined by Mike Nadeau, who just released the Q2 Ethereum Quarterly Report. We've selected five of the most bullish charts from it for detailed discussion.
ETH is currently trading at $3,225. While still far below its all-time high, it's also below December last year’s $4,100. Still, Ethereum has shown solid upward momentum recently.
Do you think this momentum can be explained by Q2 fundamentals? Are you optimistic about the market?
Mike:
I believe so. I hope so. We just held our earnings call yesterday. During that call, we focused purely on data, not opinions. Today, I want to go deeper into what the data means and offer some forward-looking analysis.
Ryan:
A lot happened this week. The national debt issue felt particularly tense. Yet, we noticed something striking: Ethereum rose on days when Bitcoin fell. This happened multiple times this week—a phenomenon I haven’t seen in a long time. In this cycle, I don’t recall anything similar. Occasionally, Bitcoin might rise slightly while Ethereum gains more, but even that was rare. But earlier this week—possibly yesterday, Monday, or Tuesday—Bitcoin dropped 2% over 24 hours while Ethereum gained about 4%. That’s extremely unusual.
Mike:
This is a very significant shift—it’s exactly the trend I’ve been watching. I was one of the first to notice this, and many predicted a shift in the ETH/BTC ratio early on. Now it feels like we’ve truly bottomed out. As you said, we’re at a five-year low. I’ve never seen Bitcoin drop while Ethereum rises 4% or 5%. So for me, this is the signal I’ve been waiting for. It seems to mark an early rotation phase where capital from Bitcoin begins flowing into Ethereum—an effect that could last longer and deepen further.
Peter Thiel Buys 9.1% Stake in Tom Lee’s ETH Treasury Company
Ryan:
Interestingly, institutions appear to be leading this trend—or at least institutional inflows may be driving ETH’s price. Yesterday I saw news that Peter Thiel recently acquired a 9.1% stake in Tom Lee’s East Treasury company. Many know this firm trades under MNR ticker—it essentially functions as an Ethereum treasury. Peter Thiel disclosed holding nearly 9%. I believe this significantly impacts current market momentum. So today, we’re discussing some of the most bullish charts—likely among the most representative from your ETH Q2 report. The report includes other notable data points too, like declining revenue, lower fees, and rising L2 usage. I recommend checking those to get a full picture of Ethereum’s overall performance.
Institutional Adoption of Stablecoins
Ryan:
Let’s discuss institutional stablecoin adoption using some charts. I think this story starts with stablecoins. Tom Lee calls stablecoins the “ChatGPT moment” for crypto—he talks about it almost daily on CNBC. When you look at Ethereum’s stablecoin supply chart, what do you see? This is our first chart analyzing Ethereum today.
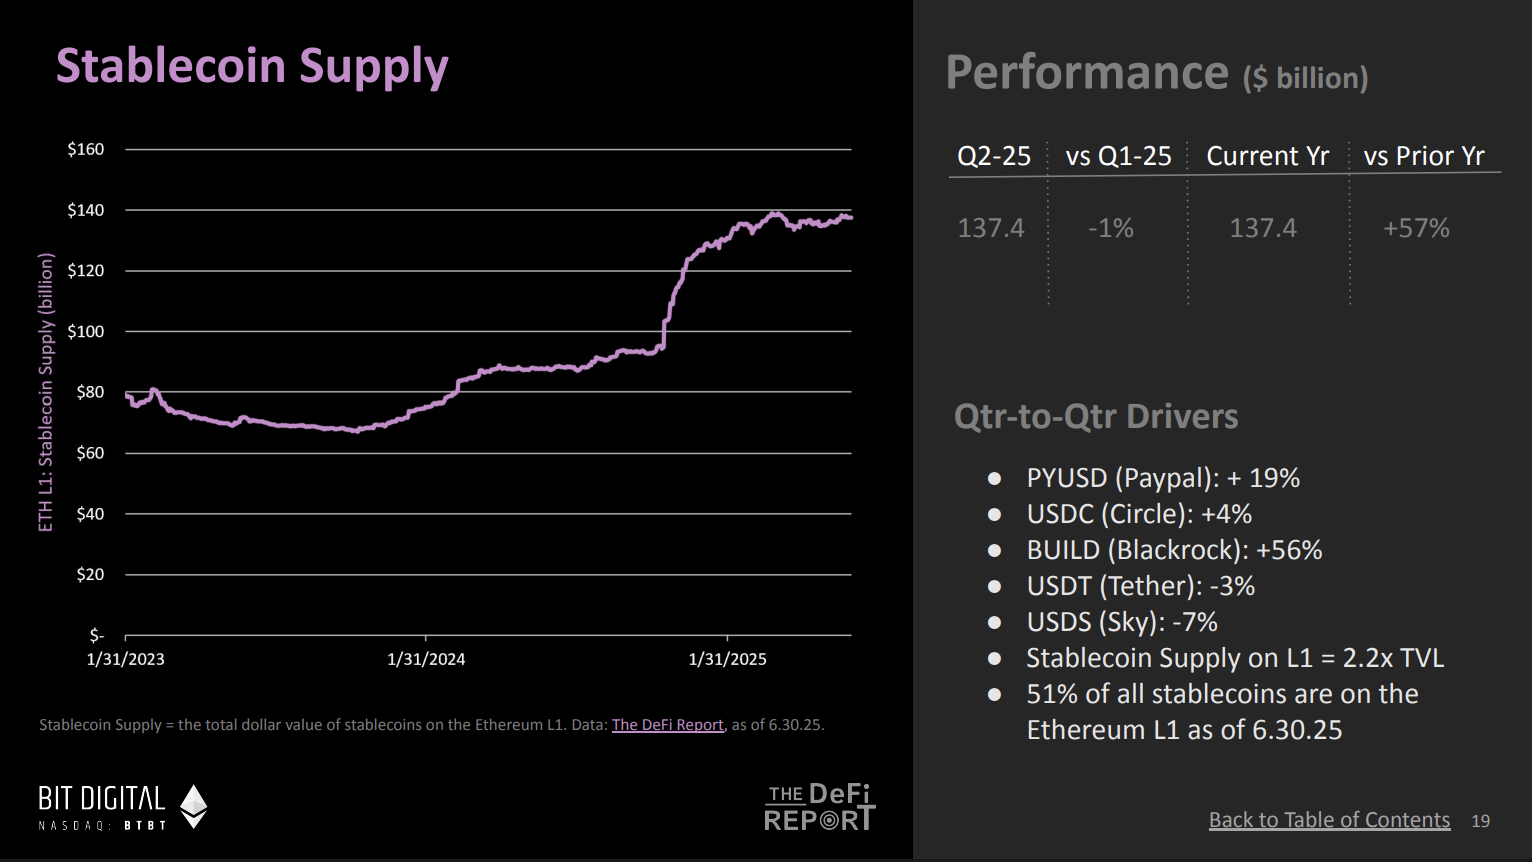
(Chart source: The ETH Report - DeFi Report)
Mike:
Yes, it’s refreshing to hear Tom Lee openly discussing stablecoins on CNBC. He’s highly respected in finance and sees stablecoins as a pivotal moment for crypto. I believe they’re a crucial part of the Ethereum ecosystem.
We’re seeing around 95% likelihood this year for the passage of the Genius Bill related to stablecoins. The general consensus is that it will pass this summer. This would be a major milestone for Ethereum and the broader crypto market.
The concept of stablecoins is easy to grasp. Anyone familiar with crypto understands their potential, and their impact is now entering mainstream awareness. I’m currently writing a report analyzing the bill’s potential effects and what it means for fintech companies. We’re already seeing nearly every fintech company preparing to launch their own stablecoin, and banks may lead the charge. This will profoundly affect e-commerce payments and global financial inclusion. Bitcoin was originally seen as the tool for these goals, but I believe stablecoins are the optimal solution for financial inclusion. I spent five weeks in Buenos Aires, Argentina last year. In the U.S., people may not fully grasp the need for stablecoins due to low inflation. But in Argentina, stablecoins are already essential to daily life.
I see this as a massive opportunity. From the chart, stablecoin supply shows a long-term upward trend. Though it stabilized in Q2, I expect rapid growth once the Genius Bill passes.
Ryan:
The chart shows stablecoin supply on Ethereum reached ~$140B by end-Q2. This represents most of the stablecoin supply, and you predict further increases.
About the Genius Bill, Trump called it “Crypto Week.” I think they aim to pass and push this bill within the week. Though Congress faced early resistance, Trump is actively persuading remaining party members to ensure passage. So this bill may pass not just this summer, but possibly this week. If passed, it would further boost stablecoin supply on Ethereum. Last night I also saw news: Jamie Dimon—the well-known crypto skeptic—said JP Morgan is considering doubling down on stablecoin investments. His exact words: “I don’t fully understand why people use these things, but we’ll go big in this space.” Similar sentiment. We’re now seeing PayPal, Circle, BlackRock, and crypto-native firms like Tether all pushing stablecoin development. I believe with the Genius Bill, all major banks will launch their own stablecoin strategies.
Mike:
Completely agree. I expect Stripe may also launch its own stablecoin. With this bill, another area to watch is payroll. How do we get everyone a crypto wallet and start using stablecoins? I think some form of mandatory mechanism may be needed. Payroll could be that mechanism. If we can accelerate payment cycles beyond traditional weekly or biweekly models, that would be a breakthrough.
We can observe changes in this space over the next one to two years. But stablecoins must reach everyone and circulate on-chain. I believe this will significantly boost economic activity on Ethereum. Currently, 51% of stablecoins in crypto are on Ethereum L1, with another 4–5% on L2s. So overall, about 55% of stablecoins are in the Ethereum ecosystem. This is a pivotal moment—we’re even seeing major retailers like Walmart discussing launching stablecoins. This signals massive growth potential, with the Genius Bill acting as a catalyst. Looking back at the 2021 cycle, a stablecoin-related bill passed OCC review, followed by Ethereum’s bull run. So the Genius Bill could again become a key market catalyst.
Active Loans on Ethereum Up 98%
Ryan:
I suspect institutions deploying stablecoins may also buy Ethereum (ETH) as part of their strategy within the Ethereum ecosystem. This chart shows activity on Ethereum and its L2s—and it’s highly significant. This chart displays active loans on Ethereum, now at an all-time high. Why does this matter?
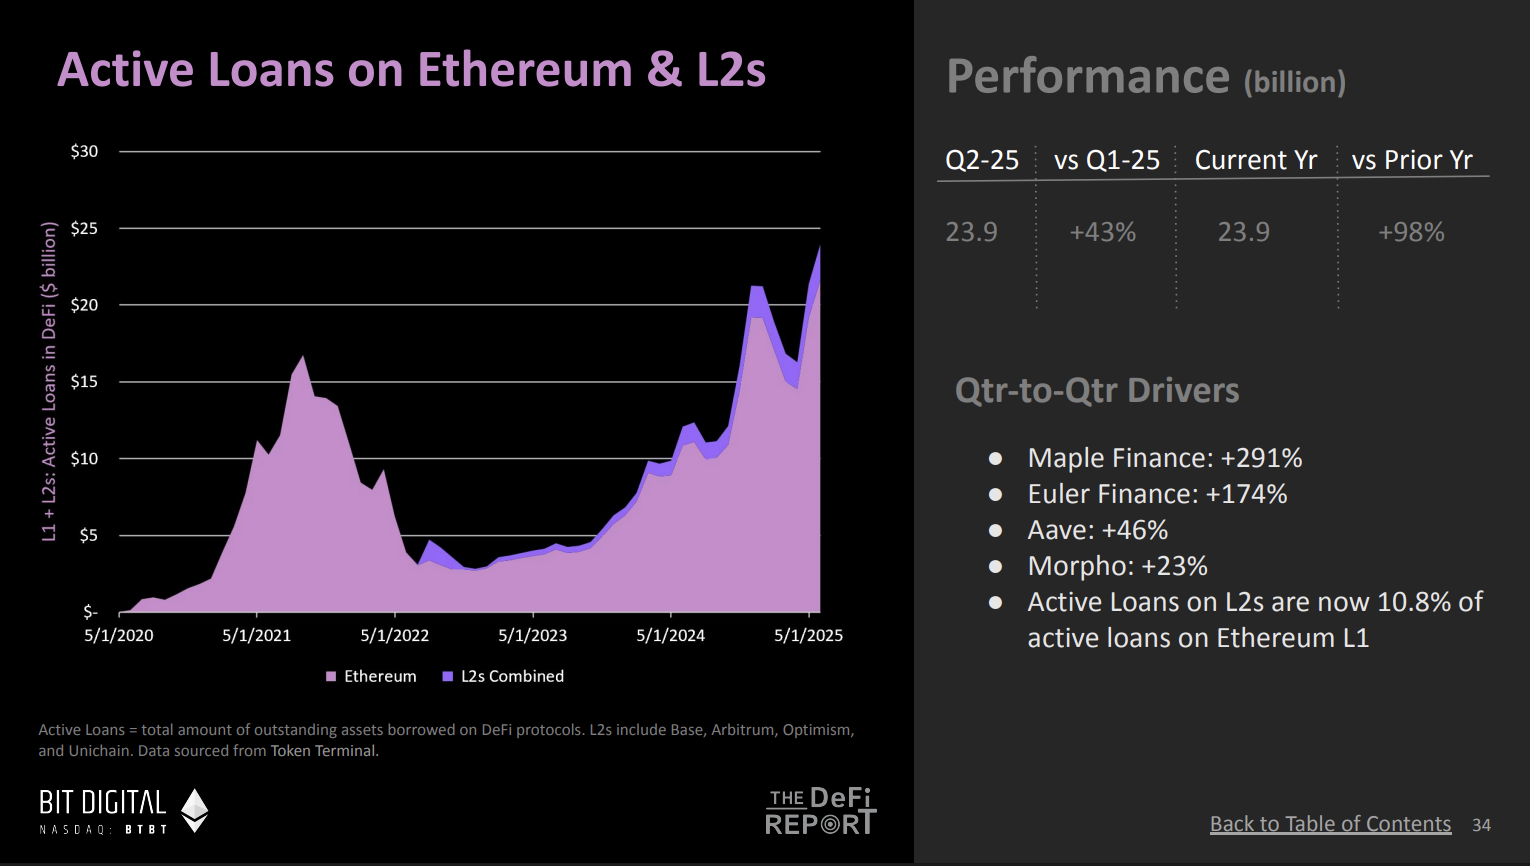
(Chart source: The ETH Report - DeFi Report)
Mike:
This is critical because it shows growing market trust and confidence in Ethereum. We’re also seeing Ethereum staking hit record highs, with staked supply as a share of circulating supply rising continuously. This reflects not just confidence in the Ethereum protocol, but growing interest in accessing DeFi and using collateral. We may also be observing more re-collateralization loops—reusing collateral to increase leverage—indicating significantly increased activity in the Ethereum ecosystem.
To me, this chart signals rising demand to access DeFi, use collateral, and take on associated risks. The data reflects a five-year trend, now surpassing the previous cycle’s peak. I expect this number to keep climbing this cycle.
Ryan:
Active loans on Ethereum grew 98% year-over-year. This growth is important not just numerically, but because it ties closely to corporate treasury strategies. Billions of dollars are now fueling competition among public treasury firms to acquire more Ethereum assets. It’s not just billions—many of these firms are actively deploying ETH as a productive asset across Ethereum and its broader ecosystem. This trend could trigger a “late-stage boom” in DeFi—where large-scale institutional inflows drive rapid expansion. Think of these treasury firms as actively managed funds—where do their yields come from? First, staking offers low-risk returns. Beyond that, they may use decentralized lending protocols like Aave. So I see this as a highly compelling narrative.
On-Chain RWA Annual Growth Reaches 200%
Ryan:
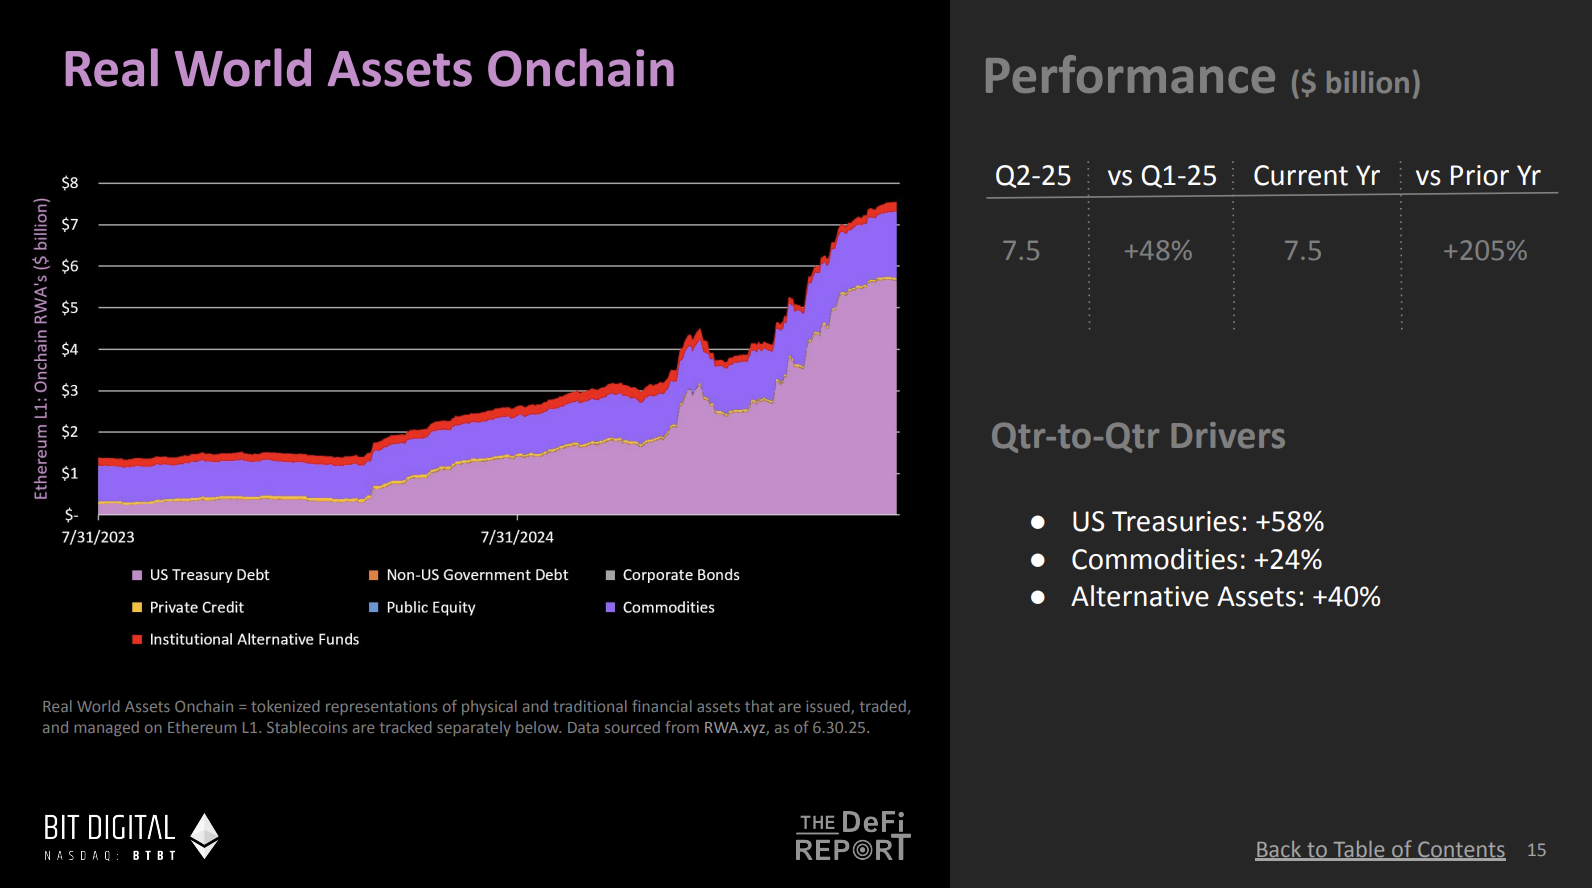
On-chain real-world assets (RWA) are another key pillar of Ethereum’s institutional adoption. We’ve observed hockey-stick-style growth since last year—very strong momentum. Currently, on-chain RWA growth on Ethereum stands at 205%. What does this reflect?
(Chart source: The ETH Report - DeFi Report)
Mike:
This chart is highly meaningful—it shows increasing migration of assets to Ethereum. Current asset value on Ethereum is $7.5 billion, a figure poised for explosive growth. In my view, stablecoins and potentially tokenized stocks in the future will be the main drivers. Notably, firms like Robinhood have already begun building within the Ethereum ecosystem.
Moving assets on-chain is the first critical step—making them liquid on-chain is the next, more important phase. Successfully bringing more real-world assets on-chain will further boost active loans and DeFi growth. As more assets and collateral enter DeFi, users can optimize capital efficiency, enhancing overall ecosystem prosperity.
I see a feedback loop here: As more assets move on-chain, more capital flows into DeFi, more assets serve as collateral, affecting gas fees and further influencing Ethereum’s burn mechanism. The burn mechanism reduces ETH supply by burning part of transaction fees, optimizing the ecosystem. Ultimately, this loop accelerates ecosystem growth.
Crypto markets are highly reflexive—sometimes the price of ETH itself becomes the key driver. Rising ETH prices attract more assets on-chain, bring in more users, and improve other fundamentals. This contrasts with traditional finance, where fundamentals typically precede asset movement. This is the trend I anticipate, especially observing ETH’s price action over the past month and its positive impact on fundamentals.
Ryan:
Regarding real-world assets, it’s fascinating to consider how large this could grow on Ethereum. We’re still in very early stages—though the growth from near zero to $7B is impressive, it remains negligible compared to total real-world assets. Consider Treasuries, stocks—markets worth tens of trillions. Ethereum’s potential here is just beginning to unfold.
AUM on Ethereum Reaches All-Time High
Ryan:
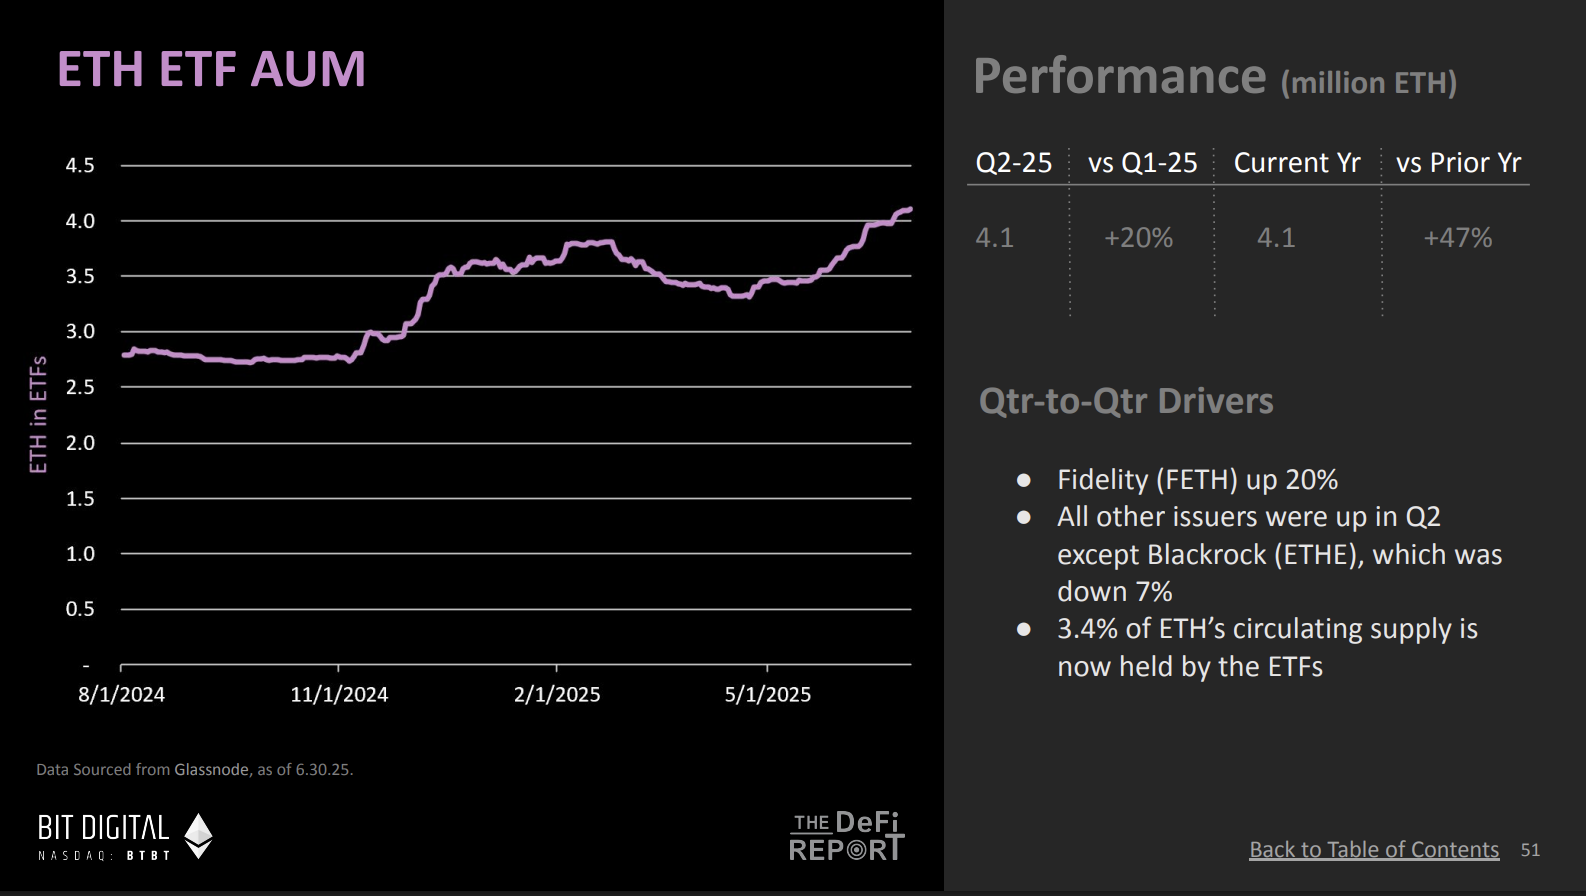
We’ve covered the first three bull-market charts. Now let’s look at the fourth—one showing Ethereum’s asset management. Recently, we’ve seen strong inflows into Ethereum. By quarter-end, AUM on Ethereum actually hit an all-time high, correct?
(Chart source: The ETH Report - DeFi Report)
Mike:
Exactly. Data as of June 30 shows Ethereum AUM reached 4.11 million ETH—3.4% of total supply. Two weeks later, it rose to 3.8%, with total ETH held in ETFs now at 4.6 million.
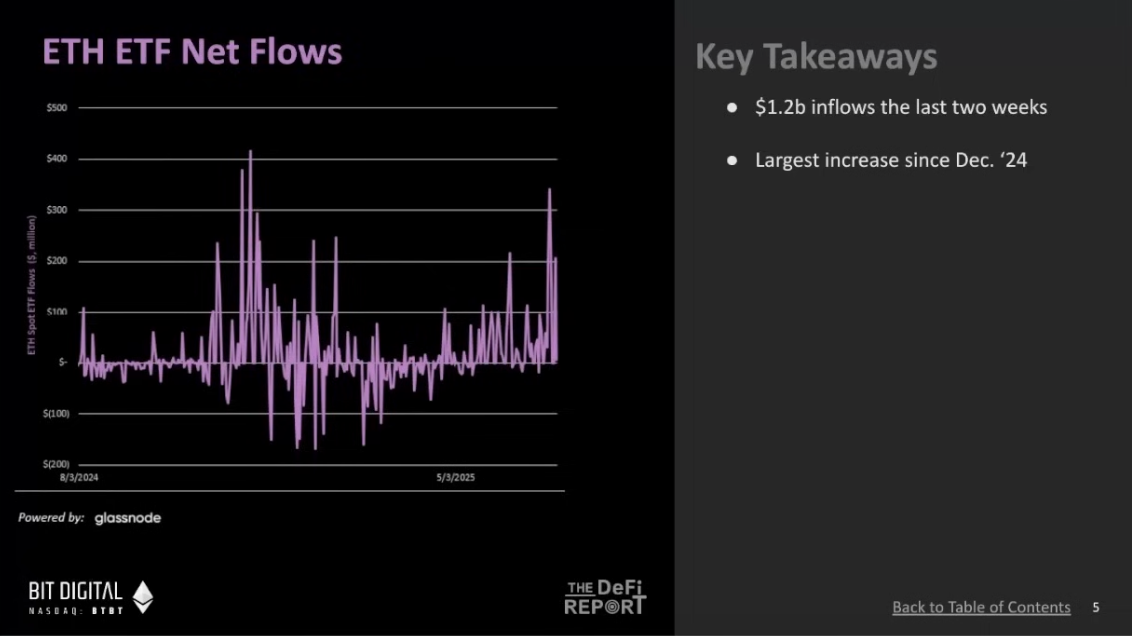
ETFs are performing exceptionally well. Here’s some data: Since launch, net inflows into Ethereum ETFs have reached $5.7B—20% of Bitcoin’s inflow scale. Bitcoin’s net inflow stands at $50B. Many were optimistic about Bitcoin ETFs, expecting $5–10B in first-year inflows. Ethereum has already exceeded that. Total AUM in Ethereum ETFs is now ~4.6M ETH, worth ~$13B. In recent weeks alone, inflows added another $1.2B. Looking at the net inflow trend, we’re approaching Q4 last year’s levels—the ETF performance is truly impressive.
(Chart source: The ETH Report - DeFi Report)
Ryan:
Institutional interest in Ethereum appears to be growing rapidly. Tom Lee has said Ethereum could be the “next Bitcoin”—he’s trying to prove that case. What if Bitcoin ETF inflow patterns repeat with Ethereum?
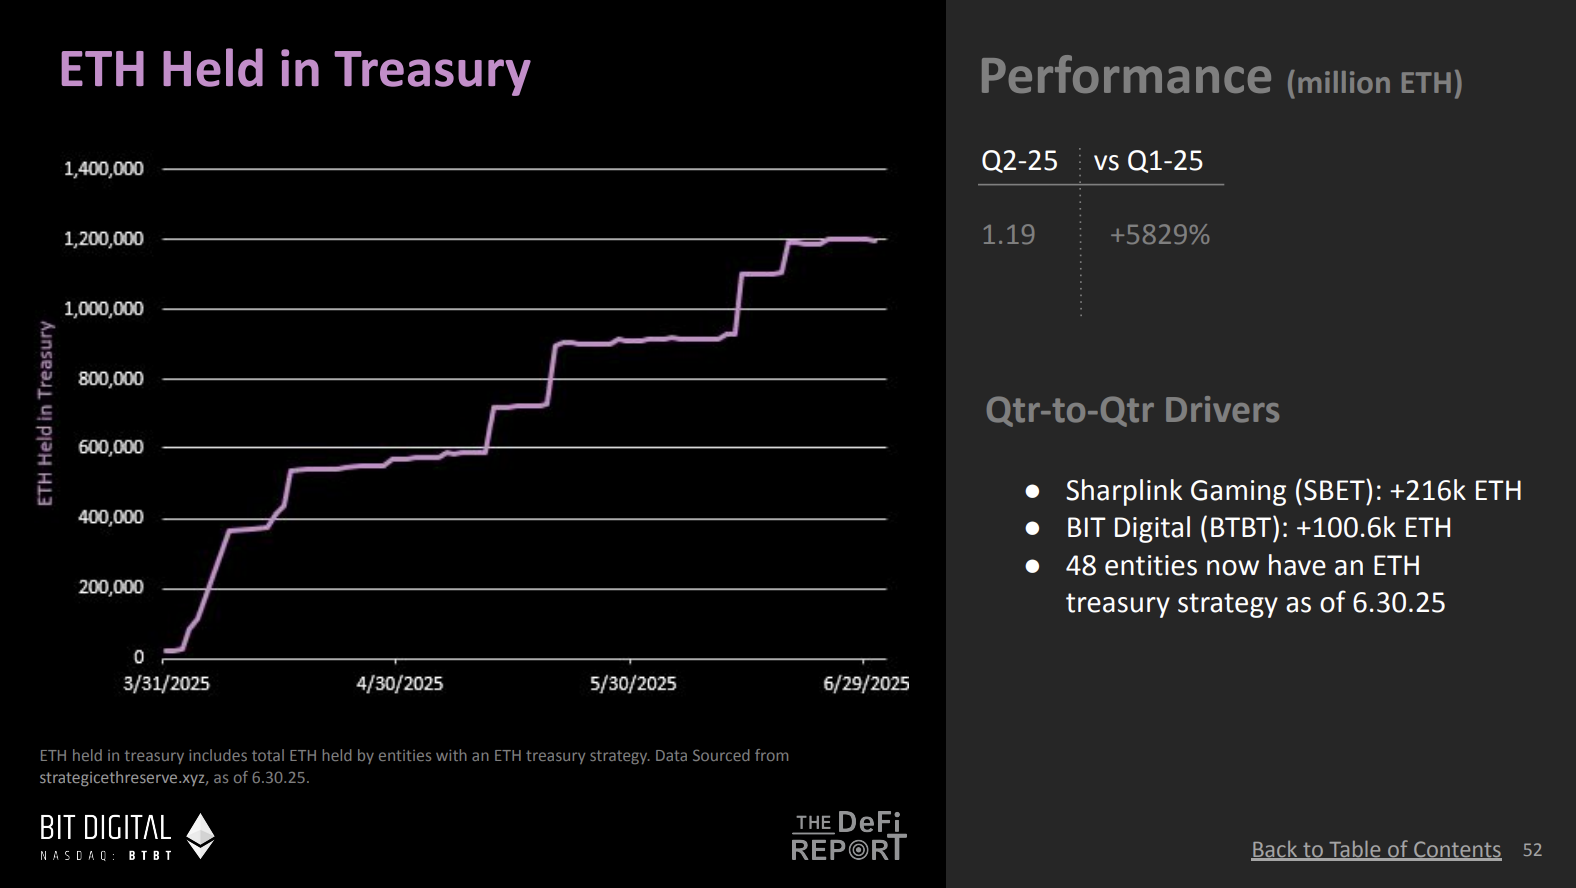
This was a Q2 trend, but momentum continues into Q3: the amount of Ethereum held in corporate treasuries. If I understand correctly, this holding has grown nearly 6,000%. Most are public treasuries, accessible to investors via U.S. capital markets.
(Chart source: The ETH Report - DeFi Report)
Mike:
This trend clearly gained visibility thanks to Tom Lee. For example, Bit Digital added ~100K ETH while selling all their Bitcoin. That’s highly noteworthy. You also see figures like Joe Lubin appearing on CNBC promoting Ethereum—essentially marketing the token.
This is very important. I don’t think it’s widely discussed yet. Bitcoin had this earlier—Michael Saylor appeared daily on TV and podcasts telling Bitcoin’s story while buying aggressively. Now we’re seeing Ethereum’s community doing the same. This market shift can’t be ignored—I see it as another bullish signal.
Ryan:
I believe this shift shows Ethereum striving to overcome barriers and become a Bitcoin-like store of value. Bitcoin took over a decade to break through. That transformation was largely complete by 2020 when Michael Saylor began large-scale buying and convincing others. Perhaps Ethereum is undergoing a similar process.
(Chart source: The ETH Report - DeFi Report)
Mike:
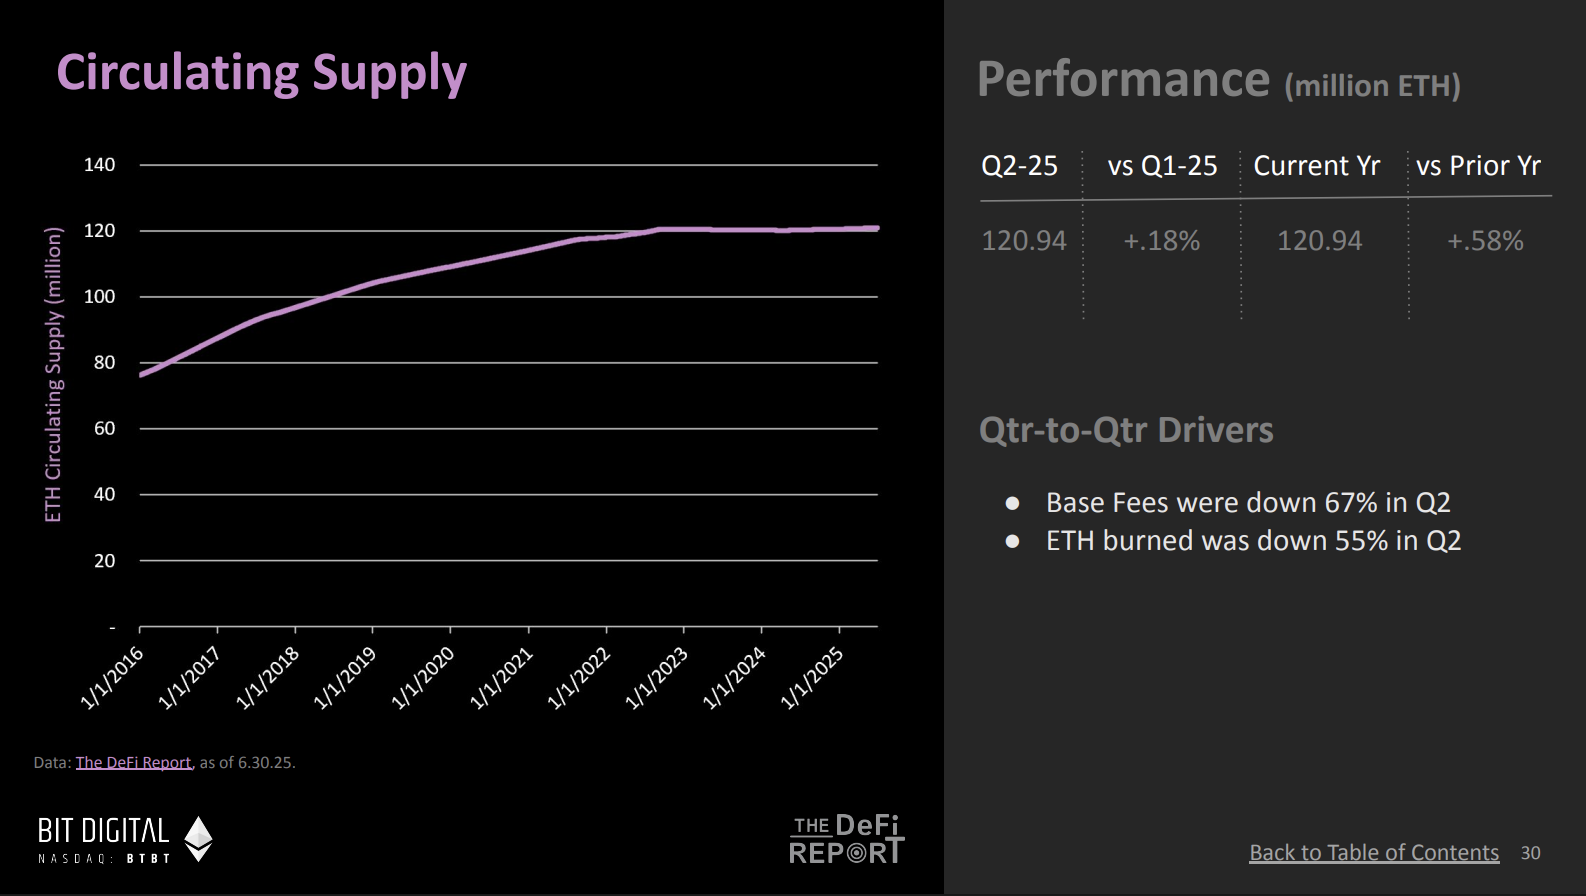
As you mentioned, Ethereum’s potential as a store of value is a key investment thesis—and its supply dynamics are closely tied to this. For example, in Q2 this year, Ethereum’s circulating supply grew only 0.18%, while block fees dropped 80%. Through fee burning and base fee burns, Ethereum’s burn mechanism effectively offset part of issuance—these two factors together drive Ethereum’s deflationary economics.
From my view, this is actually a bullish signal. Despite a significant drop in on-chain economic activity—especially amid gas optimization efforts—Ethereum’s supply growth remained below Bitcoin’s inflation rate. Even with reduced activity and ongoing network upgrades, Ethereum’s supply dynamics show strong advantages.
You realize that even with major on-chain activity drops and network upgrades, supply growth hasn’t exceeded Bitcoin’s issuance. That’s interesting—because now you have a store-of-value asset that looks like Bitcoin, but we know Ethereum generates yield. And these ETFs—I believe some apps will launch by year-end allowing partial yield distribution to ETF holders. So this is intriguing: maybe you already own Bitcoin and invested in Bitcoin ETFs. Now you see this setup and may want to reallocate some assets to capture yield—if this product becomes available. So I find the store-of-value aspect compelling because it combines well with yield, which Bitcoin lacks.
Ryan:
As investors gradually grasp this, the trend becomes highly attractive. Bitcoin has a fixed supply of 21M, while Ethereum’s annual issuance is fixed but somewhat variable, with a maximum issuance rate no higher than 1.45%. On an annualized basis, that’s roughly 0.45%—below Bitcoin’s current issuance rate of ~0.85%. By comparison, other stores of value like gold typically have annual issuance between 1% and 1.5%, depending on gold prices. That contrast is also fascinating.
Also, I’d remind everyone—if you missed the 2021 bull cycle, Ethereum’s monetary policy wasn’t mature then. That was pre-Merge, when people had limited understanding of its future policy and issuance. Looking back, the Merge actually occurred after the summer 2022 market crash. Since the Merge completed in September 2022, Ethereum’s issuance and monetary policy have become more stable and refined. While Ethereum’s monetary policy isn’t yet as widely understood as Bitcoin’s, it may become clearer as this cycle progresses. Plus, Ethereum’s supply dynamics provide long-term advantages—like reducing supply to optimize the ecosystem.
43% of ETH Supply Locked in Smart Contracts, CEX ETH Balances at Historic Lows
Ryan:
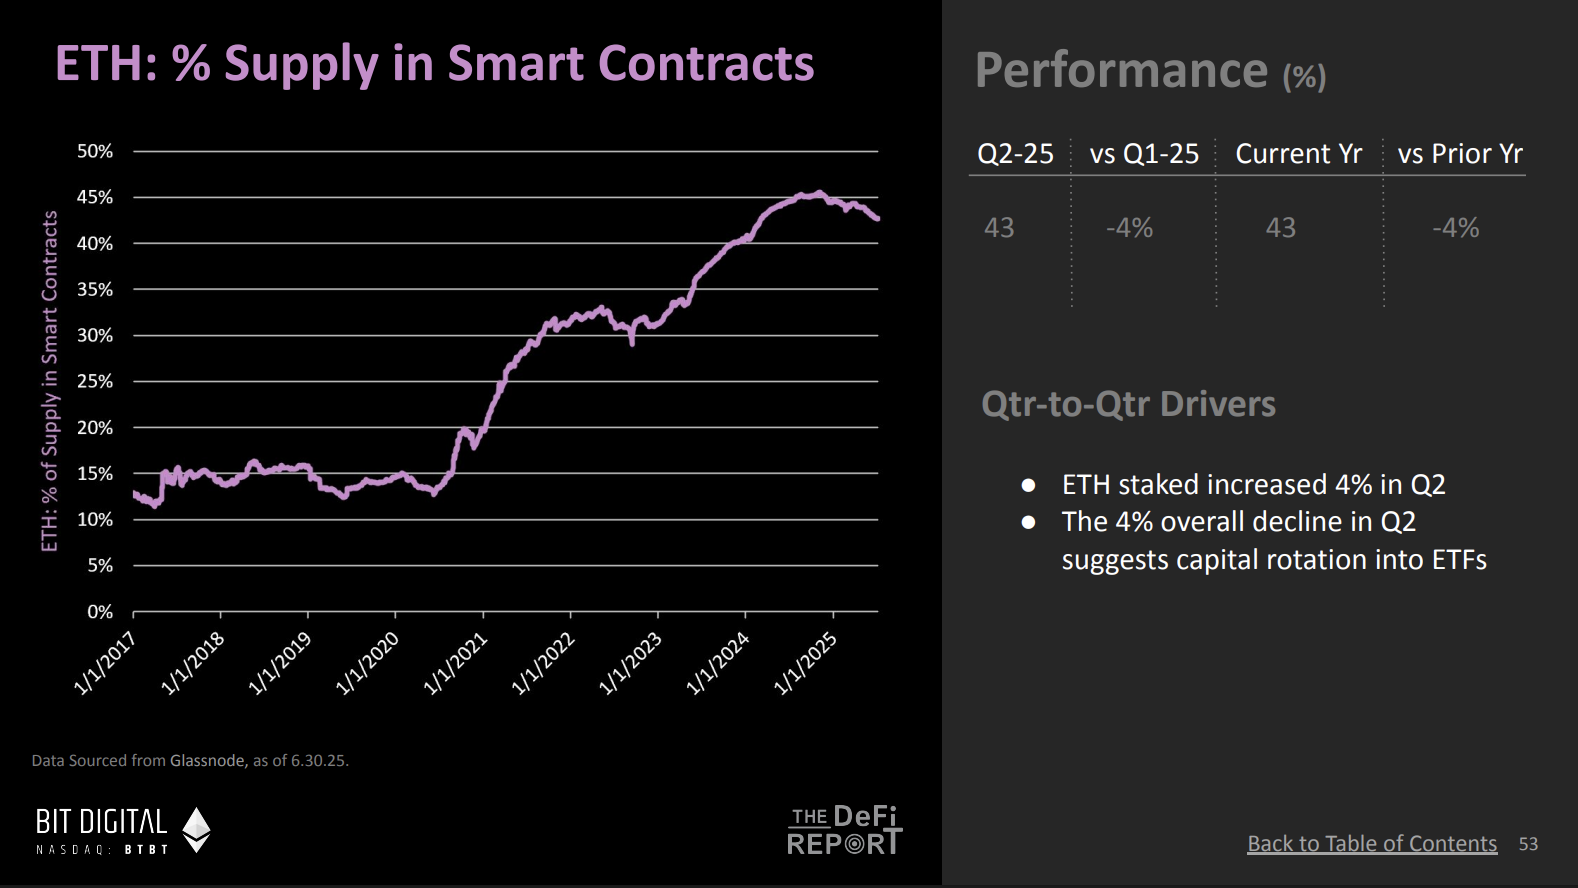
Here’s a coincident indicator for Ethereum supply, revealing an interesting trend. This shows the percentage of ETH supply locked in on-chain smart contracts. Though slightly down from the past two years, the long-term trend is upward. What does this indicate?
(Chart source: The ETH Report - DeFi Report)
Mike:
Yes, this indicates about 43% of ETH supply is currently locked in smart contracts—meaning 43% of on-chain supply is active. When this line rises steadily over time, it usually signals growing user confidence in depositing assets into DeFi, staking contracts, and protocols. So I see this as a bullish sign indicating increasing on-chain use cases. I expect this ratio to grow further.
Ryan:
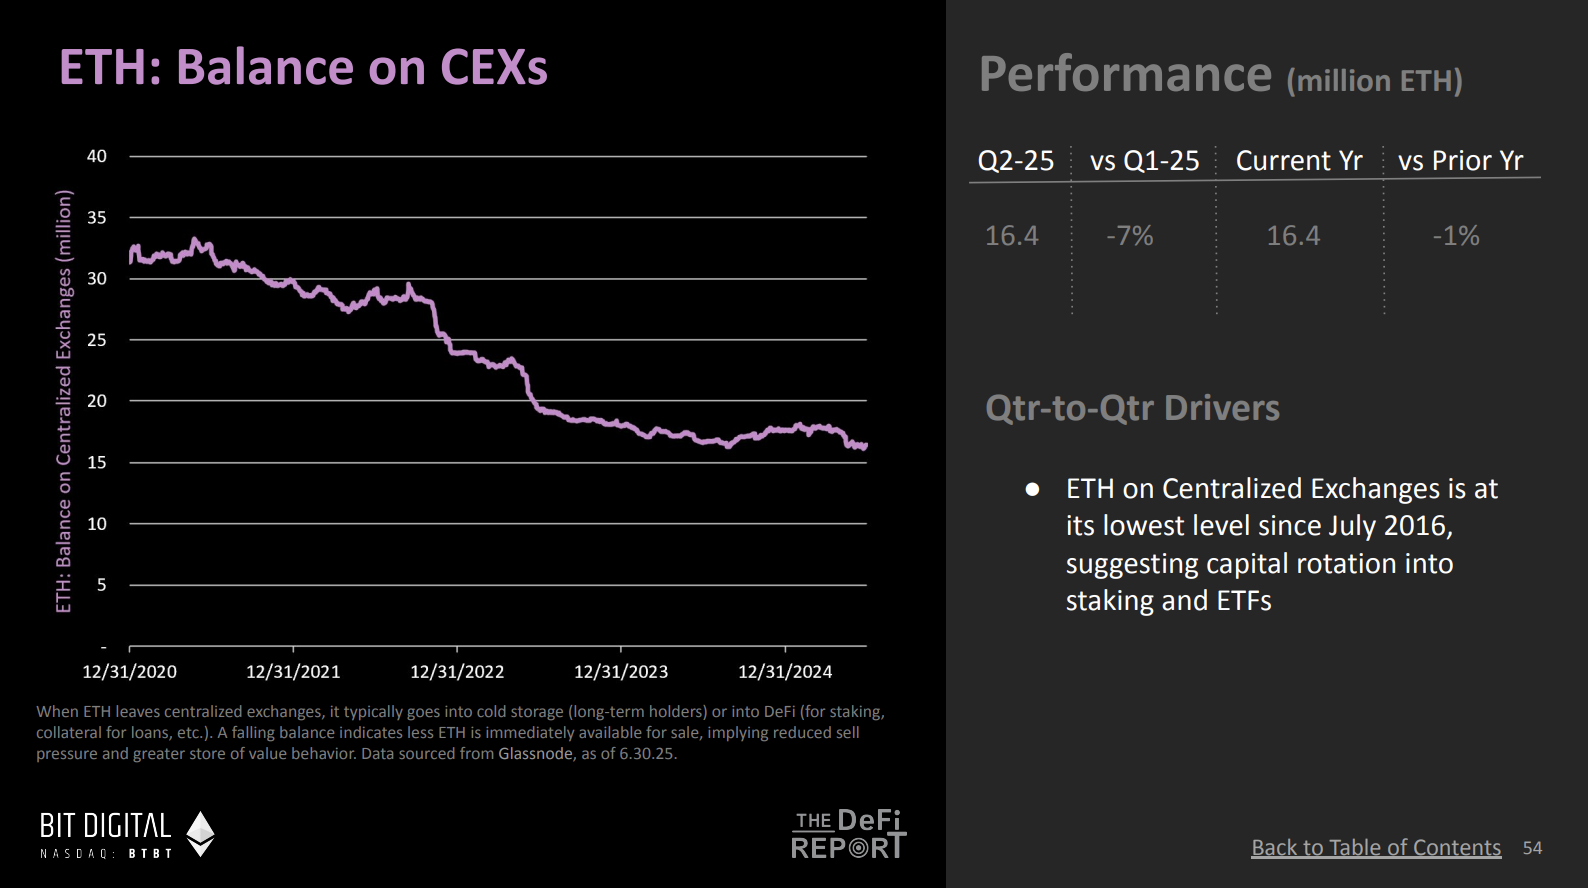
Another related chart shows ETH balances on centralized exchanges are nearly at historic lows—the lowest in eight years. This suggests Ethereum supply is moving from exchanges onto the chain.
(Chart source: The ETH Report - DeFi Report)
Mike:
This actually complements the prior chart, reflecting a trend of assets moving from centralized exchanges to on-chain. Users aren’t just transferring assets on-chain—they’re depositing them into staking contracts. To me, this shows capital deployment on-chain, suggesting users are longer-term holders or increasingly viewing ETH as a store of value. If this trend continues, sellable supply on centralized exchanges will shrink.
Ryan:
So, summarizing the current bullish case: First, we’re seeing rising institutional adoption of Ethereum—driven by demand from stablecoins and real-world assets, a trend likely to accelerate under the Genius Bill. Second, institutional demand is emerging—seen in Ethereum inflows and treasury allocations—and expanding through advocacy by figures like Tom Lee and Joseph Lubin. Additionally, Ethereum’s supply dynamics are stronger than before, with reinforced monetary policy and ultra-low issuance. Finally, growing ETH lockup in smart contracts and increasing outflows from centralized exchanges further support the bullish outlook.
ETH Dropped Below 200-Day MA, Hitting Historic Low
Ryan:
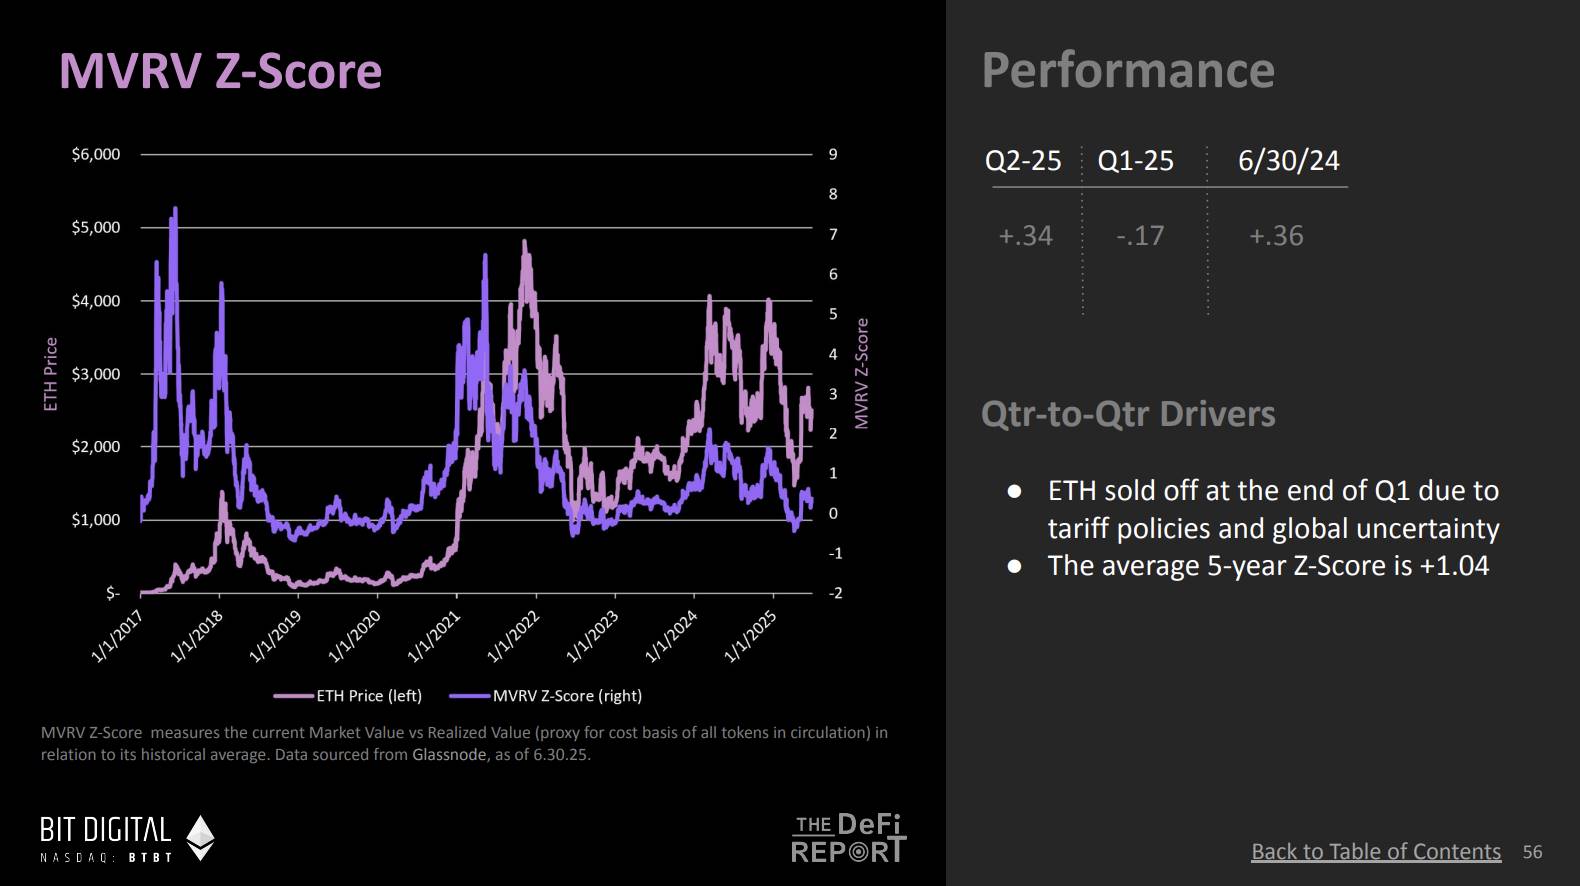
This brings us to the question on every investor’s mind: Is now a good time to buy? Prices were around $1,500 months ago, now nearing $3,000. Did people miss the ideal entry point? What’s a fair market value for this asset? What does the MVRV Z-Score tell us?
(Chart source: The ETH Report - DeFi Report)
Mike:
The MVRV metric measures Market Value to Realized Value ratio—we used Glassnode’s data. Glassnode’s analysis focuses on on-chain wallet data, excluding ETFs or exchange-held assets. It calculates the cost basis of tokens in these wallets and compares it to the network’s historical average cost basis.
At quarter-end, the MVRV Z-Score was ~0.3, indicating how far current price is from historical standard deviation—the five-year average being ~1. So at quarter-end, the asset looked fairly priced. Recent weeks saw price gains, lifting the MVRV Z-Score to 0.8, close to the five-year historical norm. But as the chart shows, this metric highlights ideal buying opportunities well, and during overheated markets, market value often far exceeds the network’s historical average cost basis. So even at current levels, historically speaking, this remains a favorable price range.
Ryan:
So the current MVRV Z-Score is 0.8, and 1.04 is the five-year historical average, right? We’ve also seen this score exceed 1 during bull markets—reaching 2 or even 3. At what level would you say MVRV starts signaling market overheating? We’re not there yet, but would a score of 2 or 3 signal irrational exuberance?
Mike:
I think it requires looking at multiple factors, with MVRV being one. We also track the 200-week moving average—a key reference. Right now, with MVRV Z-Score at 0.8 and strong price gains over the past 2–3 months, short-term indicators may suggest slight overheating, so we might see a pullback. But long-term, current prices remain within fair value range.
We also monitor the 200-week MA. Typically, when price approaches this line, the market bottoms. Earlier this year, during a sharp selloff, we even dipped below the 200-week MA—hitting a historic low.
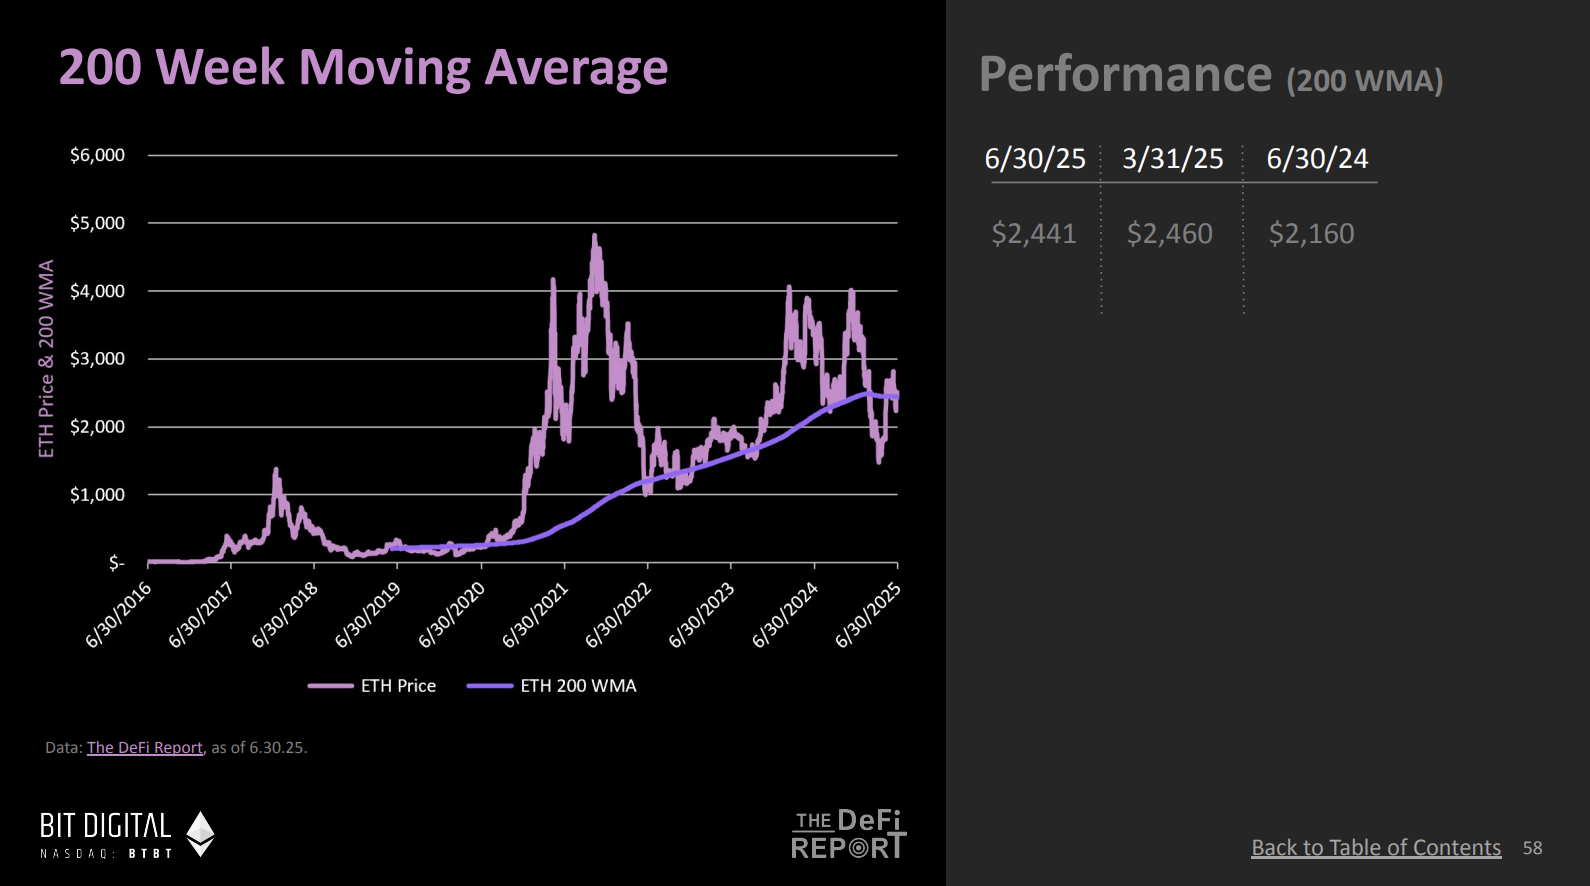
(Chart source: The ETH Report - DeFi Report)
Ryan:
Price fell below the 200-week moving average.
Mike:
Yes, it did. This was the largest drop below the 200-week MA ever—appearing as a generational buying opportunity. Price rebounded from there and is now just above the 200-week MA—currently around $20,500. Though price is starting to drift slightly away, as the chart shows, in bull markets price usually runs far above this purple line—and we haven’t reached that stage yet.
Market Cap vs. TVL Comparison and Bull Market Data Model
Ryan:
Another key metric is market cap versus TVL. I think this isn’t getting enough attention. Why should investors care about it?
(Chart source: The ETH Report - DeFi Report)
Mike:
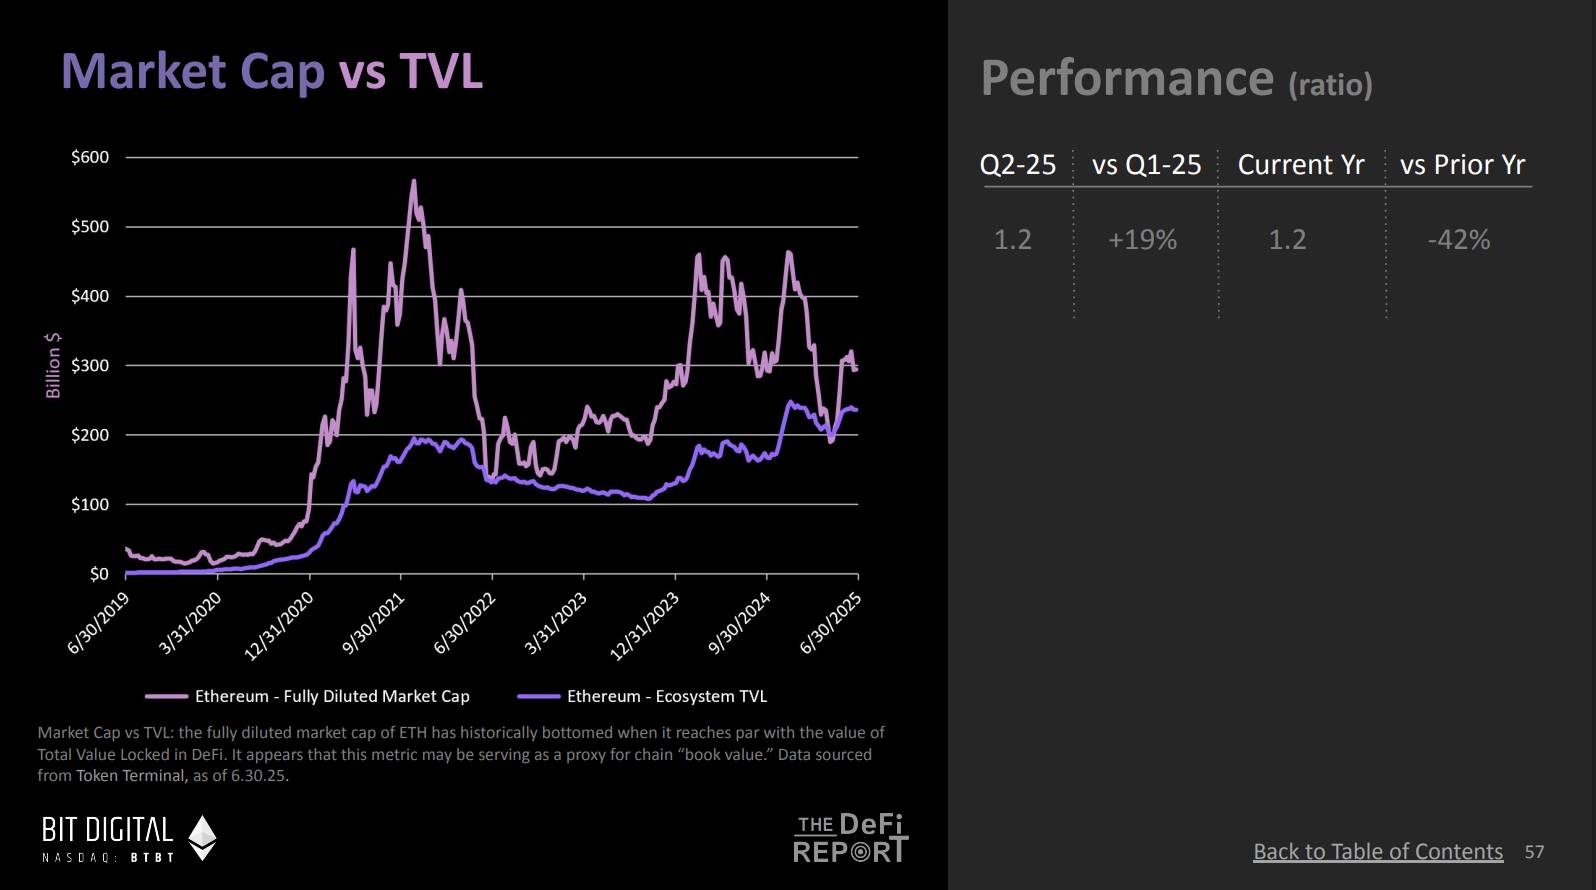
This is a highly valuable metric—thanks to Token Terminal for the data. It reflects the ecosystem’s total value locked (TVL), covering not just DeFi TVL but also stablecoin locked value. So it’s a more comprehensive figure for assessing blockchain ecosystem health.
We observe that during bear markets, market value typically falls back to the ecosystem’s TVL level. This resembles traditional finance’s “book value”—the intrinsic value of an asset. We’ve tried to understand such comparative metrics in DeFi, and market cap vs. TVL acts like the blockchain equivalent of “book value.” Interestingly, whenever price returns to this so-called “book value” (TVL), the market often rebounds strongly.
Ryan:
I ran some bull-market math on Twitter—assuming Ethereum’s TVL could grow to $1T, while current market cap is ~$300B. Do you think this is possible?
Mike:
Given current trends, such growth is possible.
Ryan:
Considering stablecoins’ rapid growth, this is entirely plausible. Assume stablecoin TVL reaches $500B, RWA TVL hits $100B, and all crypto-native assets appreciate—we can easily model $1T. Multiply that by a higher TVL multiple, say 2.5, and ETH could reach $20,000. That’s the logic of this model.
Of course, we can’t yet know exactly how much TVL will land on Ethereum, but this model tells a compelling story. Especially the market cap vs. TVL ratio—this purple line could become a key metric this bull run.
Mike:
Indeed fascinating. As stablecoins flood the market, they lay the foundation for bear markets. So continuously tracking market cap vs. TVL will be crucial. It’s also a great way to think about potential valuation—as more assets enter the blockchain ecosystem, on-chain value could grow substantially.
ETH L2 Performance and Yields, Bear vs. Bull Comparison
Ryan:
Mike, I have one more question. Your report contains other charts telling different stories—though we didn’t cover them today. Overall, how would you interpret them—bullishly or bearishly?
In the report, I noticed Ethereum’s fee revenue—including MEV (Maximal Extractable Value)—is generally declining. Compared to the last bull cycle, Ethereum’s actual revenue has decreased. Partly due to Petra upgrades expanding block space supply. While L1 hasn’t changed much, L2 block space has grown significantly. But this caused L2 yields to fall short of expectations. Some argue L2 scaling “siphons” usage, business, MEV, and fees from Ethereum’s mainnet—creating a “parasitic effect.” Viewed this way, it could be bearish—declining assets and real revenue might concern Ethereum’s outlook.
Yet, a more bullish view holds that these upgrades actually improved Ethereum’s network efficiency and productivity. We see clear L2 usage growth—not just rising active addresses and transactions, but also increasing user counts and transaction frequency. Though users pay less in fees, that may be positive—lower fees attract more users, strengthening EVM’s network effects. These effects could translate into greater future revenue and broader adoption of ETH as a store of value. This optimistic view sees L2 strategy working—wider adoption compensates for lower revenue, attracting more users and advancing ETH’s store-of-value narrative.
When prices rise, people say “the bull case is right”; when ETH drops to $300, they ask “did the entire L2 concept fail?” How do you see this? Weighing the bullish and bearish views on L2 data versus Ethereum revenue—what’s your take?
Mike:
This is a crucial topic. I believe Ethereum’s roadmap is progressing as planned. L2 growth and value are evident. Why did Coinbase launch an L2 now? Because it benefits their business. Same with Robinhood—their choice validates L2’s value.
To me, Ethereum isn’t a traditional commercial venture, but it is a product requiring broad adoption. As long as it meets market needs, it achieves “product-market fit”—a critical milestone. Every entrepreneur knows: first achieve product-market fit, then adjust pricing and build competitive moats. Ethereum is in this phase. With widespread L2 adoption, if Ethereum can serve these L2s well and build strong network effects, I believe the market will self-correct over time.
So my view is: though current revenue is down, Ethereum is in a transition phase. Maintaining product-market fit opens paths to adjust pricing and enhance value later. We may dedicate a future discussion to native rollups—a topic worth deeper exploration. The key lies in execution by the Ethereum Foundation and community—finding balance so sufficient value flows back to Ethereum while validating ETH holders’ interests.
Ryan:
We may still be in the early stages of an ETH price rotation—though that’s uncertain. Price hasn’t reached levels to confirm it yet, so we’re still in observation mode.
Join TechFlow official community to stay tuned
Telegram:https://t.me/TechFlowDaily
X (Twitter):https://x.com/TechFlowPost
X (Twitter) EN:https://x.com/BlockFlow_News