Chart Analysis of Bitcoin: How Will the Market Evolve?
TechFlow Selected TechFlow Selected
Chart Analysis of Bitcoin: How Will the Market Evolve?
Institutional adoption remains the core driving force.
Authors: Jose Antonio Lanz, Guillermo Jimenez
Compiled and edited by: BitpushNews

Bitcoin continues to power through key resistance levels, surging past the historic high of $116,000. This breakout is injecting fresh momentum into the market, sparking intense debate among traders about where price might head next. This article breaks down Bitcoin's technical outlook using chart analysis.
Macro Backdrop
As the S&P 500 and Nasdaq Composite Index close at record highs for the third time in four trading sessions, and gold futures climb above $3,370 per ounce, risk assets are receiving broad-based buying support amid the Federal Reserve’s patient monetary policy stance.
Bitcoin’s upward momentum also aligns with robust U.S. employment data—June’s nonfarm payrolls rose by 147,000 (versus an expected 110,000). Although strong jobs data initially sparked rate hike concerns that pushed Bitcoin below $109,000, the market quickly absorbed the selling pressure and propelled price to a new local high.
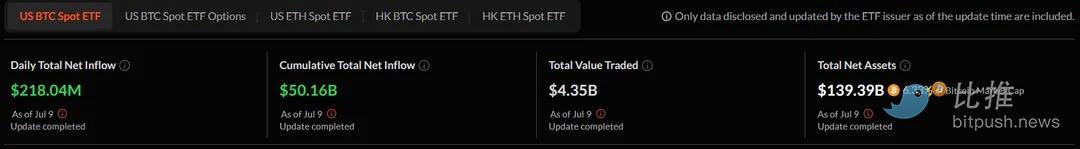
Institutional adoption remains the core driver. July has already seen Bitcoin ETFs surpass $50 billion in cumulative inflows. This sustained institutional demand provides critical support during any pullback, validating Bitcoin’s evolution from a speculative asset to a legitimate portfolio allocation.
The synergy between technical breakouts and institutional accumulation leaves traders wondering: now that Bitcoin has cleared the final hurdle into uncharted territory, where does it go from here?
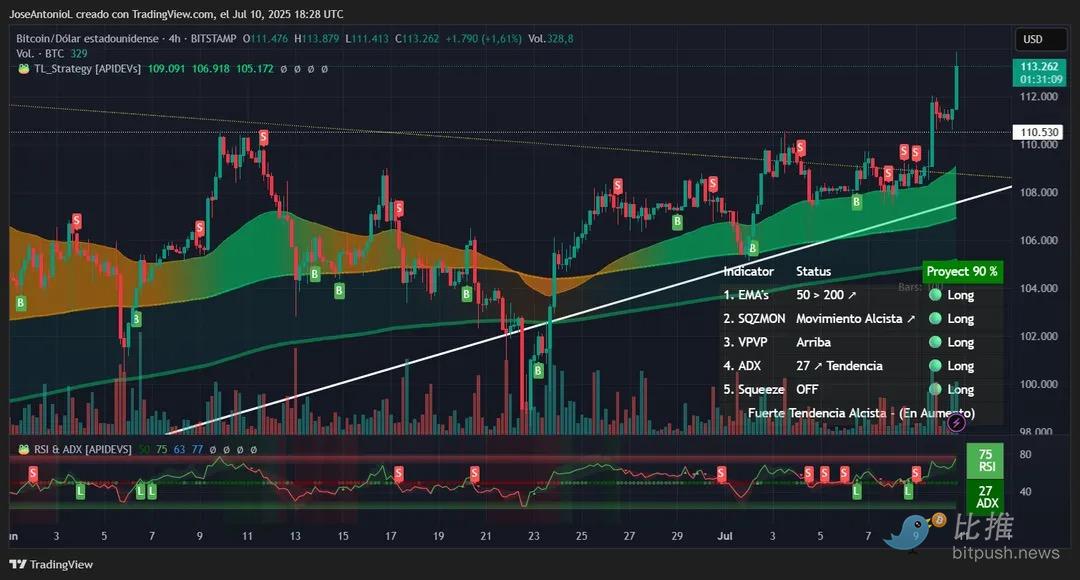
Bitcoin Chart: Dual Breakout Targets Final Resistance
Bitcoin recently surged to $113,000, marking the beginning of a new all-time high zone. This represents a decisive technical breakout of two major patterns that had been suppressing price for weeks.
The 4-hour chart shows a clean break above a symmetrical triangle pattern, while the daily chart reflects smaller volatility and slightly weaker bullish momentum—typical after prolonged consolidation. Still, such a large candlestick leaves little doubt. The breakout confirmation is clear enough to shift nearly all key indicators to bullish within intraday timeframes.
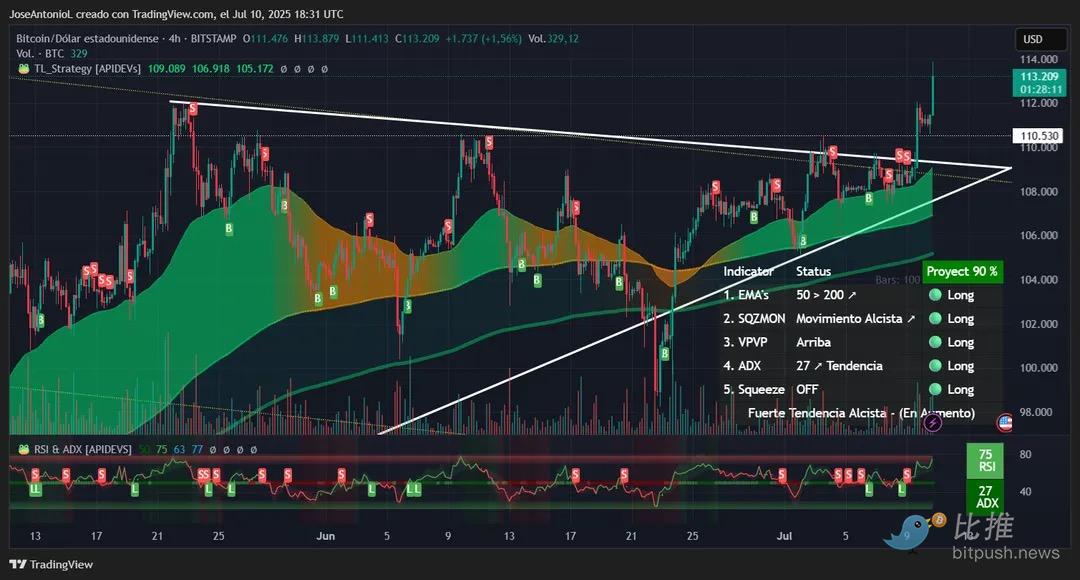
Chart source: TradingView
On the 4-hour chart, the Average Directional Index (ADX) stands at 27—typically confirming a trending market. ADX measures trend strength regardless of direction. When it crosses above 25, it signals momentum traders that a sustainable trend is forming, often triggering systematic buying from trend-following strategies.
However, the Relative Strength Index (RSI) at 75 indicates Bitcoin is entering overbought territory. Think of RSI as a market thermometer—when readings run too high, they often signal a need for cooling off. This may suggest a near-term pullback after the sharp rally. That said, Bitcoin has previously maintained bullish momentum at even higher RSI levels.
The Daily Bollinger Band Squeeze Momentum Indicator shows a “closed” state, indicating the recent release of compressed volatility aligns with prior analysis. This implies the initial breakout phase has been priced in, and traders should prepare for either continued upside or consolidation at current levels.
Overall, price is sending bullish signals. While further upside remains likely, the small-bodied candles seen during pullbacks suggest any correction would not threaten the broader trend.
The daily chart also reveals a bullish structure: Bitcoin has broken free of a descending bearish channel that had capped prices since May’s peak (marked by the yellow line in the chart above). A potential bullish support line (white line) appears to be forming, anchored by April’s correction low and June’s bottom. If confirmed, Bitcoin could consolidate near this support, preserving bullish momentum and turning $110,000 into a new floor by month-end.
Daily RSI stands at 67—indicating healthy momentum without reaching the overbought zone above 70. This suggests room for further gains. The reading tells traders that buying pressure remains strong but hasn’t yet reached extreme levels typically associated with corrections.
Daily ADX at 12 indicates the trend is still developing, not yet dominant enough to qualify as a defined regime—shorter timeframes often contain noise. Though below the 25 threshold for strong directional movement, a low ADX post-breakout often signals calm before acceleration. Traders interpret this as an accumulation phase preceding the next impulsive leg up.
Moving average analysis shows Bitcoin firmly above both the 50-period and 200-period exponential moving averages (EMAs) across multiple timeframes. The widening gap between these EMAs—a phenomenon known as moving average divergence—typically signifies a strong trend and acts as dynamic support during pullbacks.
Key Levels
-
Immediate Support: $110,197 (breakout retest level)
-
Strong Support Zone: $105,000–$108,700 (support line)
-
Target Resistance: $115,000 (based on measured move from triangle breakout and Fibonacci extensions)
Bitcoin Outlook
The confluence of technical breakout, institutional capital flows, and favorable macro conditions supports continued bullish momentum following Bitcoin’s historic resistance breach. However, technically oriented traders should monitor whether the daily ADX can rise above 25 to confirm trend strength, while watching for potential RSI bearish divergences if new highs fail to materialize.
Looking ahead, July may bring heightened volatility for Bitcoin: policies like the Trump administration’s "Great Beautiful Act" could expand the U.S. deficit by $3.3 trillion—historically bullish for scarce assets like BTC. Additionally, the White House’s July 22 deadline for its cryptocurrency executive order report approaches, which may include updates on a strategic Bitcoin reserve and serve as a potential catalyst.
Join TechFlow official community to stay tuned
Telegram:https://t.me/TechFlowDaily
X (Twitter):https://x.com/TechFlowPost
X (Twitter) EN:https://x.com/BlockFlow_News