Will Bitcoin's New All-Time High Herald the Arrival of Altseason?
TechFlow Selected TechFlow Selected
Will Bitcoin's New All-Time High Herald the Arrival of Altseason?
Market liquidity and short-selling pressure still require attention, with uncertainty in the short-term trend.
Author: White55, Mars Finance
With Iran and Israel reaching a ceasefire and U.S. stocks hitting new highs, sustained institutional buying drove Bitcoin's net inflows to a record high last week, potentially fueling a new upward trend that could push the cryptocurrency to an all-time high. Bitcoin rose over 6% last week, signaling strong buying interest around the $100,000 level. Bulls are now attempting to consolidate their dominance by maintaining prices above $108,000.
However, it's important to note that weekend liquidity is typically lower, so any breakout should be viewed with caution. Sellers are expected to return on Monday and attempt to keep prices within the $100,000 to $111,980 range.
Bitcoin’s strength has triggered buying interest in several altcoins, which have rebounded from their respective support levels. If Bitcoin reaches a new all-time high, some altcoins may attempt to break through resistance levels and extend their recovery momentum.
Bitcoin Price Prediction
Bitcoin has been trading between its moving averages and a downward trendline. Buyers are trying to push the price above the downtrend line, but bears are holding their ground.
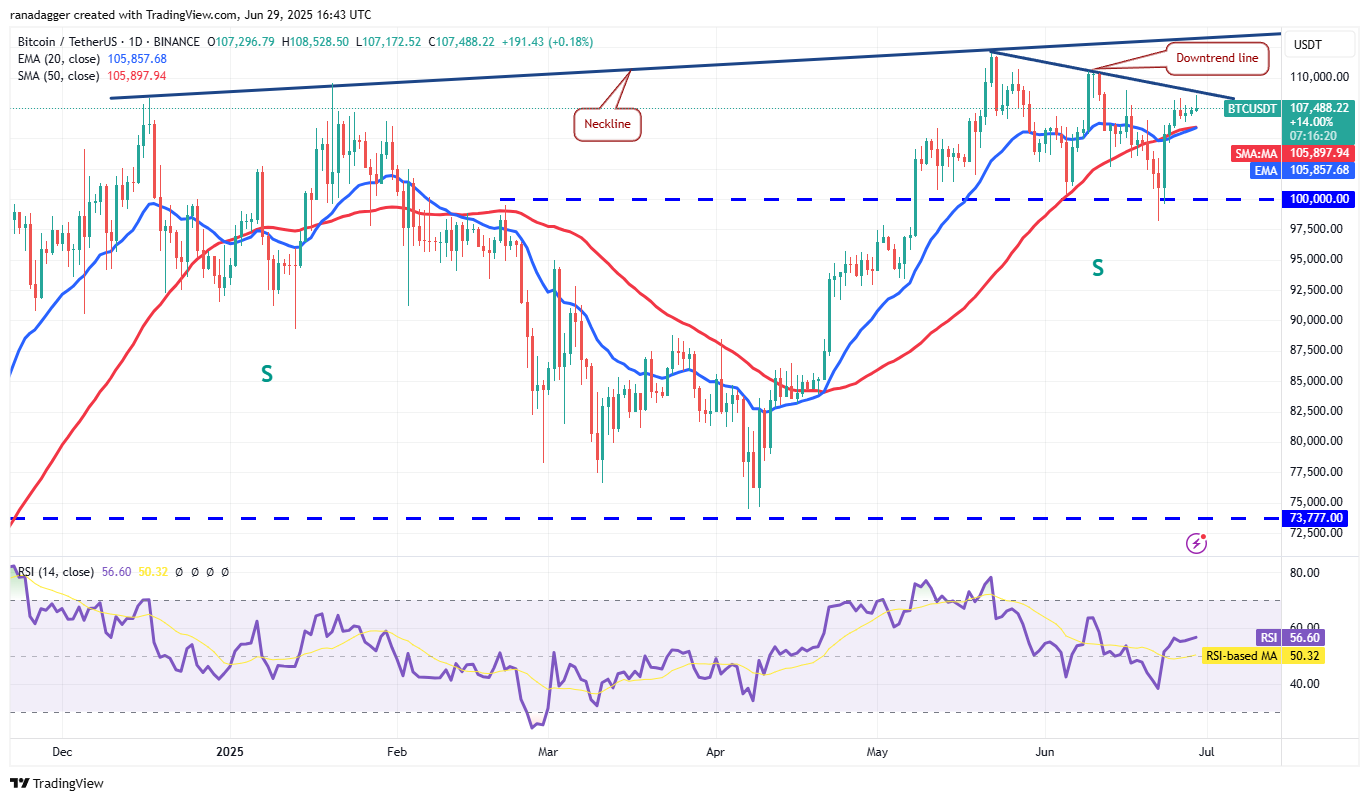
BTC/USDT Daily Chart. Source: TradingView
The moving averages are gradually turning upward, and the Relative Strength Index (RSI) is in positive territory, suggesting bulls have a slight edge. If buyers manage to push the price above the downtrend line, the BTC/USDT pair could surge to $110,530, followed by a further advance toward $111,980.
Sellers are expected to mount strong resistance between the downtrend line and the neckline of a potential inverse head-and-shoulders pattern. However, if buyers forcefully break through, the pair could rally toward $150,492.
If the price reverses from the downtrend line and falls below the moving averages, this bullish outlook would be invalidated in the short term. That would open the door for a drop to $102,500, and potentially further down to $100,000.

BTC/USDT 4-Hour Chart. Source: TradingView
The pair bounced off the 20-day exponential moving average (EMA), but bulls failed to overcome resistance above the downtrend line. If the price continues to decline and breaks below the 20-day EMA, it suggests bulls are losing control. The pair could then fall to the 50-day simple moving average (SMA), a critical level to watch. A breakdown below the 50-day SMA could accelerate selling pressure, pushing the pair toward $100,000.
On the upside, bulls must push and sustain the price above the downtrend line to signal strength.
HYPE Price Prediction
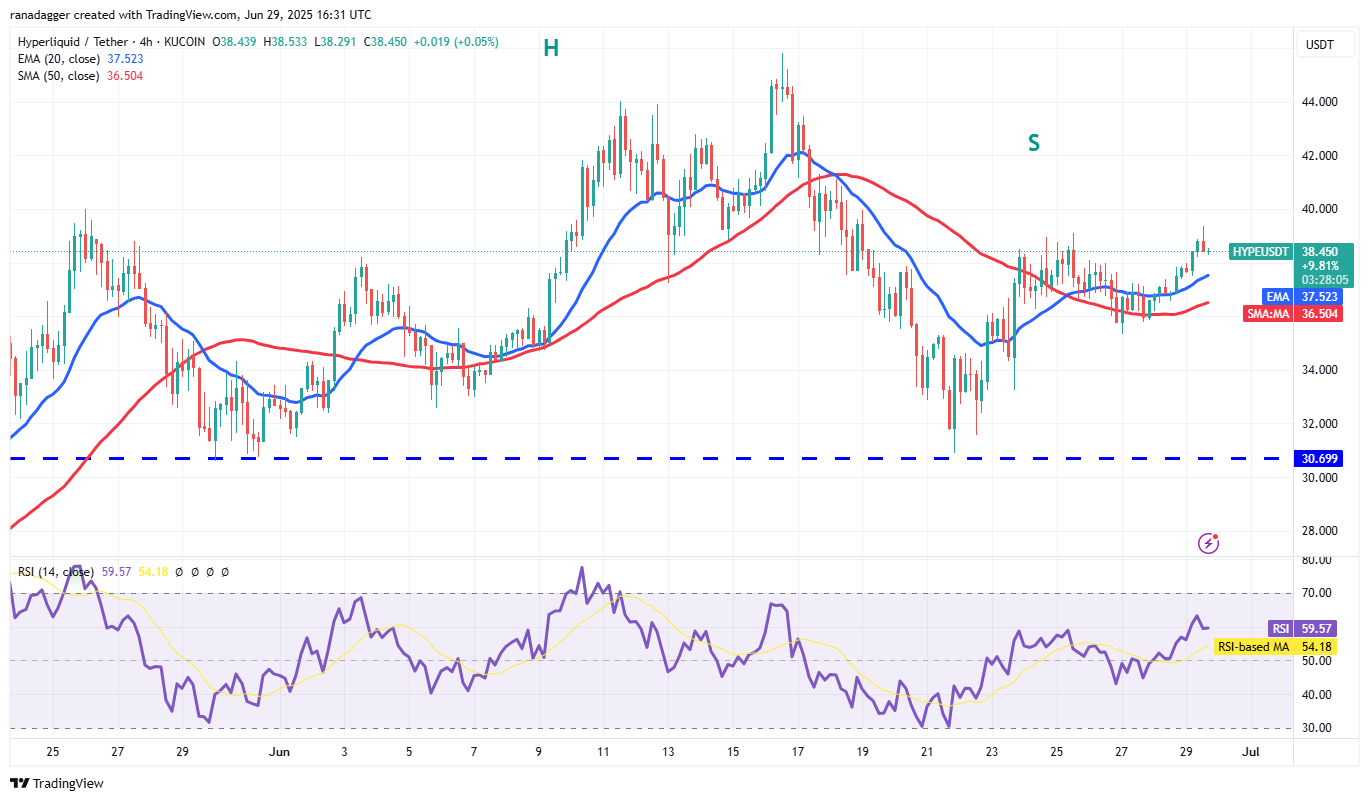
Hyperliquid (HYPE) dropped below the 20-day MA ($37.14) on Thursday, but bears failed to maintain the lower levels. This indicates buying interest emerges on every minor dip.

HYPE/USDT Daily Chart. Source: TradingView
Bulls pushed the price back above the 20-day MA on Saturday. Resistance lies at $39.12, and if bulls break above it, the HYPE/USDT pair could surge to $42.50. Buyers are likely to face significant resistance between $42.50 and $45.80.
Conversely, if the price drops and breaks below the 20-day MA, it suggests bears are active at higher levels. The pair could then fall to the 50-day MA ($34.42). A breakdown and close below the 50-day MA might lead to a drop toward $30.69.
HYPE/USDT 4-Hour Chart. Source: TradingView
The pair found support at the 50-period SMA, and bulls are attempting to push the price above recent resistance at $39.12. A successful breakout could drive the pair to $41, followed by $42.50.
To the downside, the first support is the 20-day MA, followed by the 50-day MA. Breaking below these moving averages would indicate weakening bullish momentum. The pair could then fall to $33.25, followed by the strong support at $30.69.
BCH Price Prediction
Bitcoin Cash faced selling pressure at the $500 level, but a positive sign is that bulls did not give up much ground to the bears.
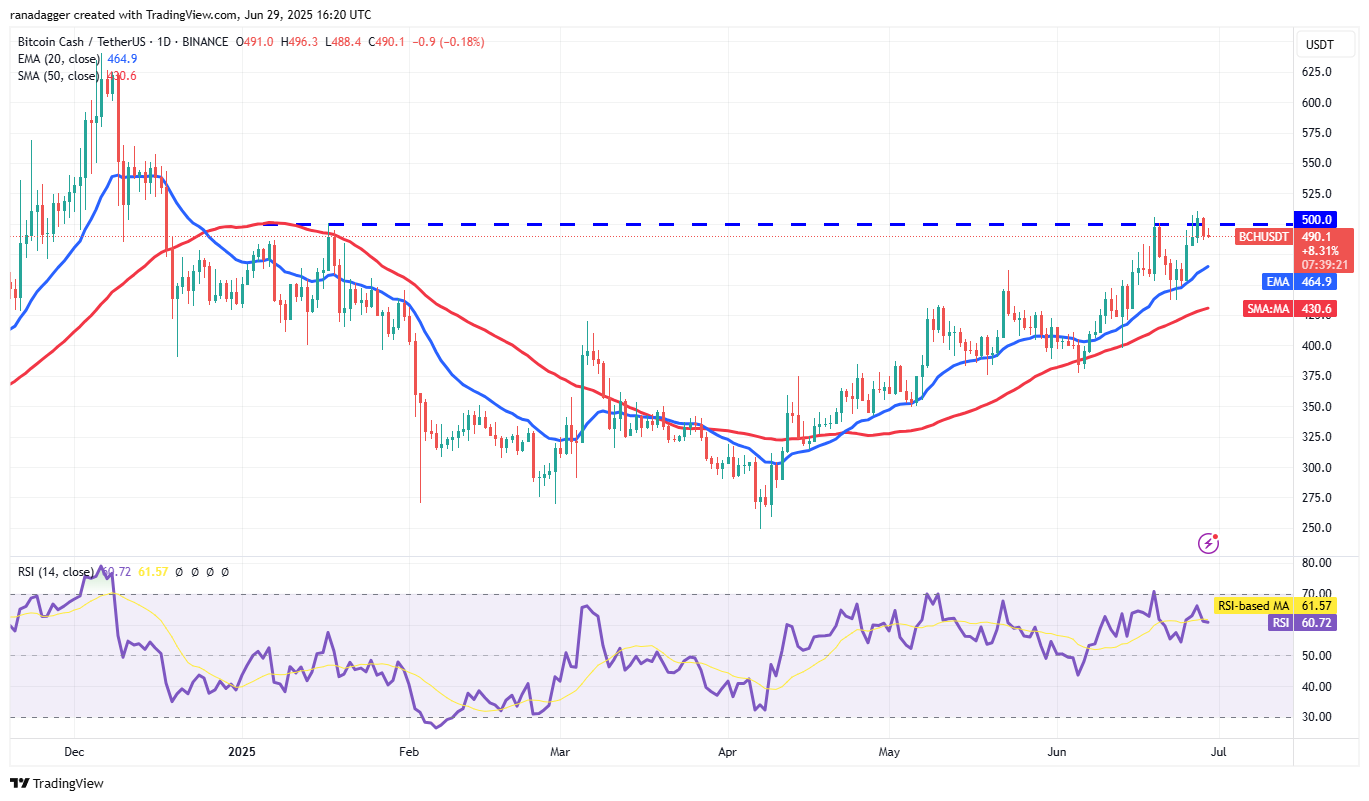
BCH/USDT Daily Chart. Source: TradingView
The upward-sloping moving averages and RSI in positive territory suggest bulls are in control. This increases the likelihood of a breakout above $500. If achieved, the BCH/USDT pair could surge to $550. Bears will likely try to halt gains near $550, but if bulls remain dominant, the pair could reach $625.
On the downside, the first support is at the 20-day MA ($464), followed by the 50-day MA ($430). A break below the 50-day MA would indicate bears are regaining control.
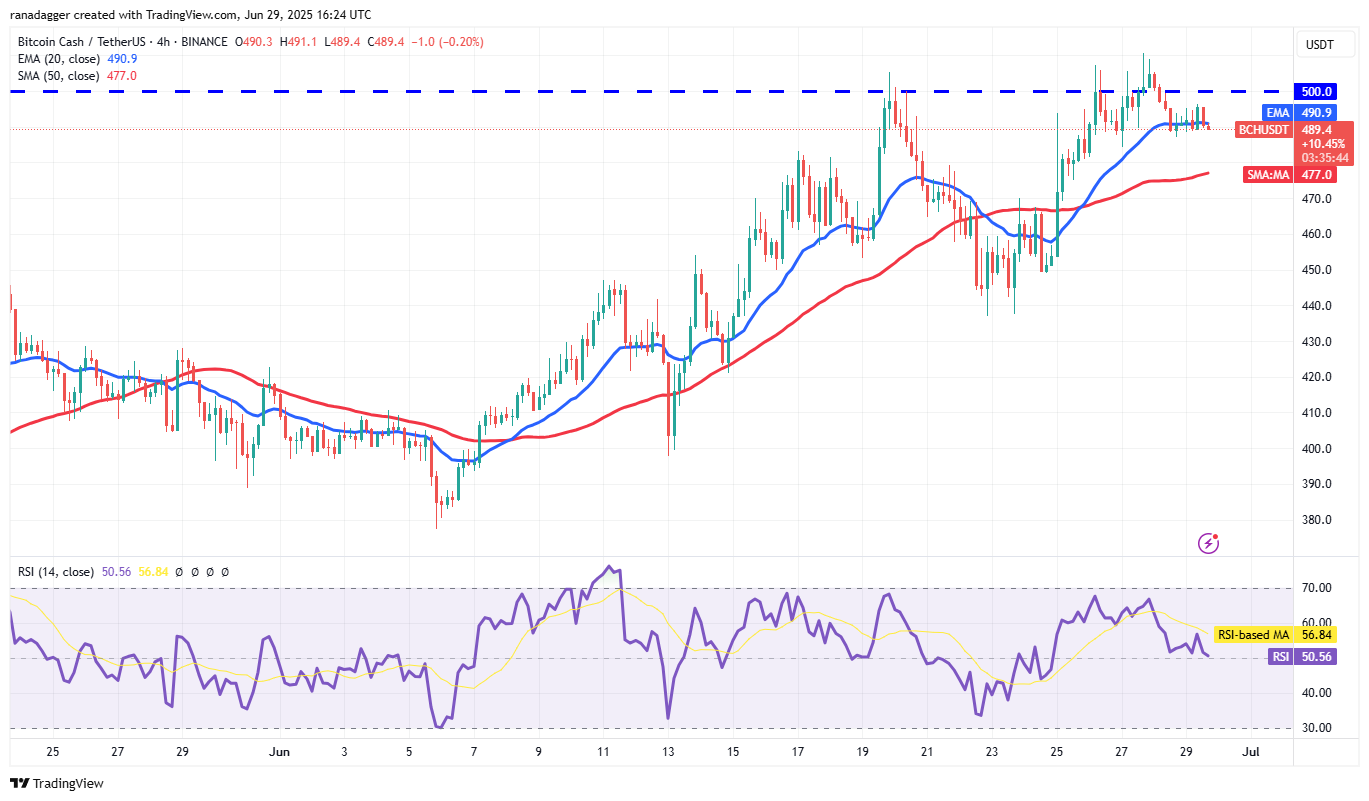
BCH/USDT 4-Hour Chart. Source: TradingView
Bulls are trying to maintain the price above the 20-day MA on the 4-hour chart. If successful, the pair may retest the $500 resistance. Momentum could strengthen further above $511.
Conversely, if the price breaks and sustains below the 20-day MA, it suggests bulls are taking profits. This could lead the pair to the 50-day MA, where bulls may step in again.
Chainlink Price Prediction
Chainlink has held steady above the 20-day EMA ($13.27) in recent days, indicating bulls are maintaining pressure.
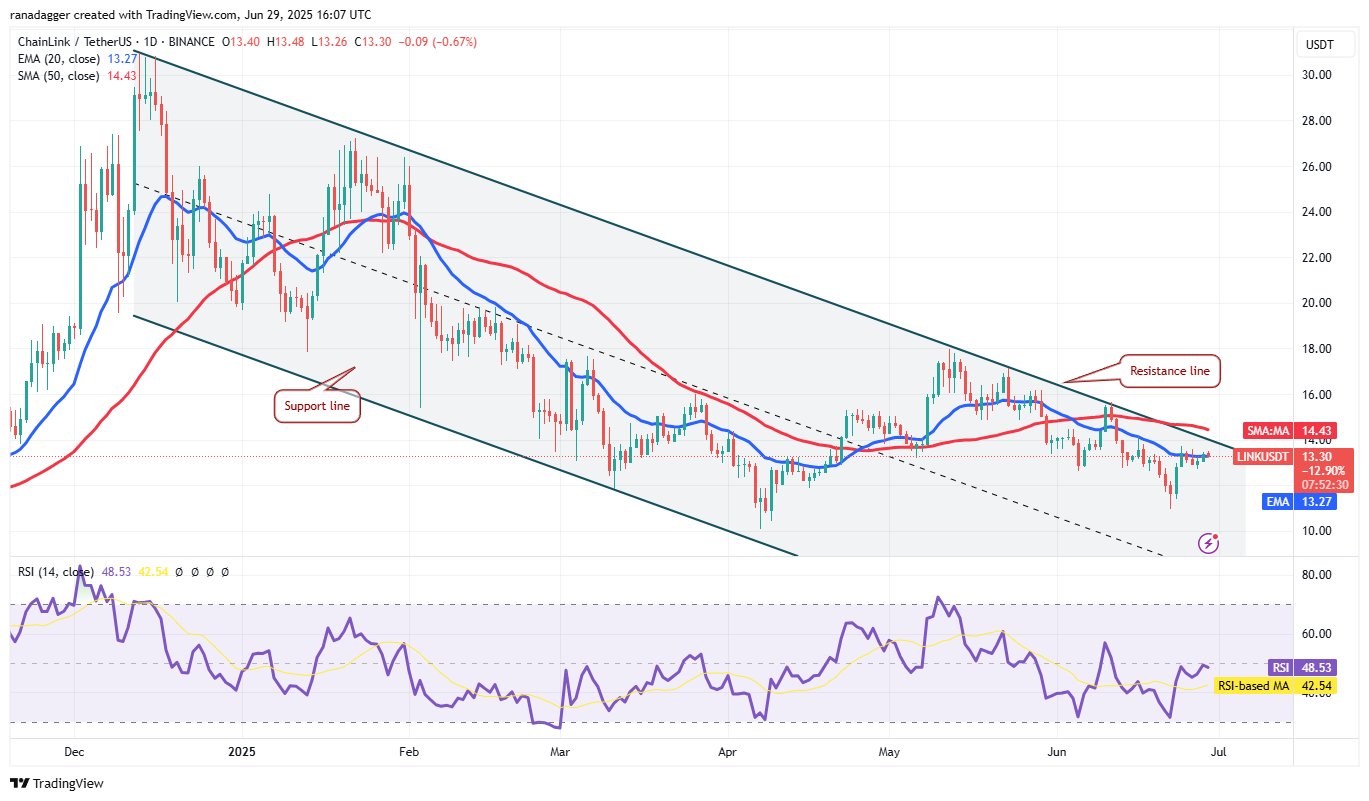
LINK/USDT Daily Chart. Source: TradingView
If the price breaks and sustains above the 20-day MA, the LINK/USDT pair could rise to the 50-day MA ($14.43). Bears are expected to defend the 50-day MA aggressively, as a break above could signal a trend change. Then, the pair may climb toward $18.
Conversely, if the price sharply declines from current levels or the 50-day MA, it suggests bears are selling into rallies. A drop below $12.73 could keep the pair within a descending channel for some time.
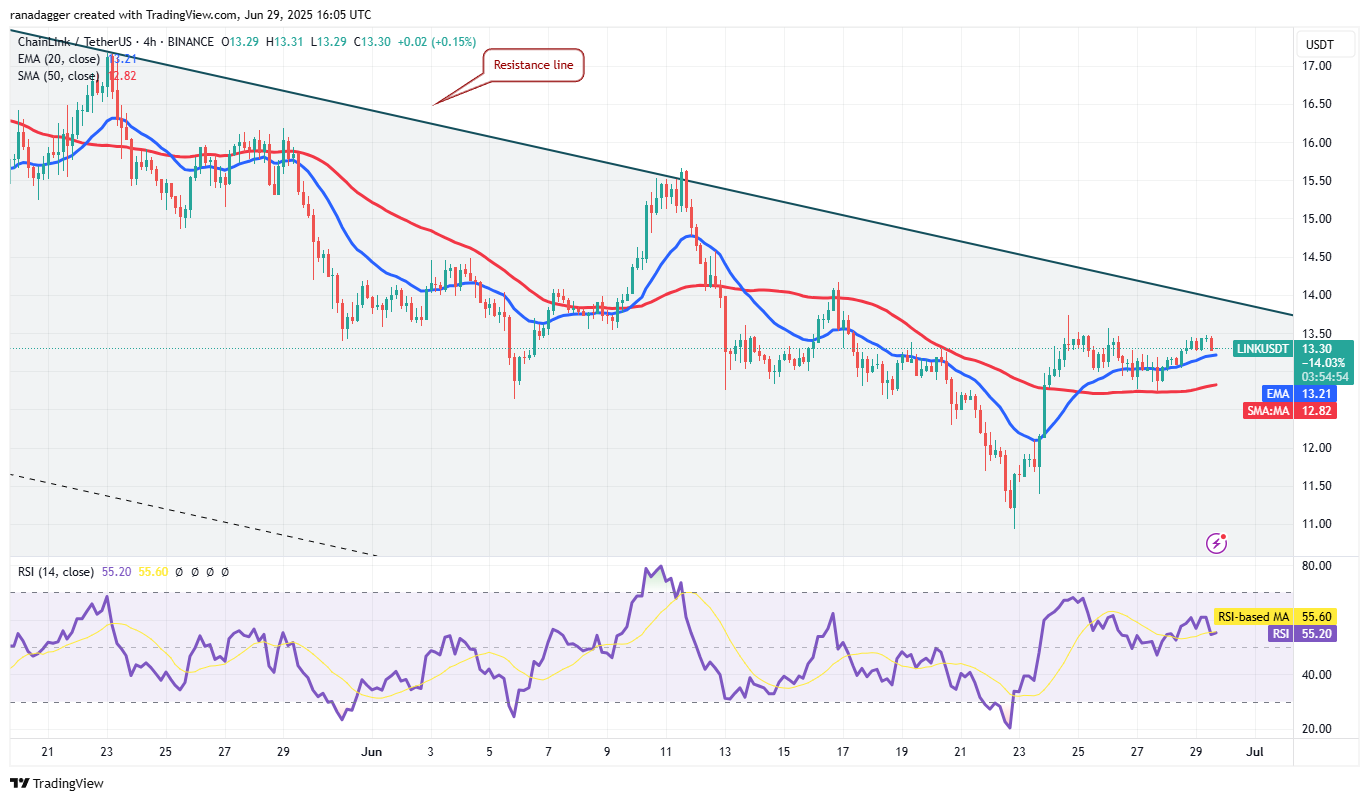
LINK/USDT 4-Hour Chart. Source: TradingView
Bulls are attempting to push the price above the resistance line, but bears are actively defending the $13.50 level. If the price drops and breaks below the 20-day MA, it indicates weak demand at higher levels. The pair could then fall to the 50-day MA.
Conversely, a strong bounce off the 20-day MA suggests optimistic market sentiment. The pair may rise to the resistance line—a key level to monitor. A breakout above this line could propel the pair toward $15.50.
Sei Price Prediction
Sei gained momentum after breaking above the 50-day MA ($0.21) on Monday and rising above the $0.29 resistance on Tuesday.
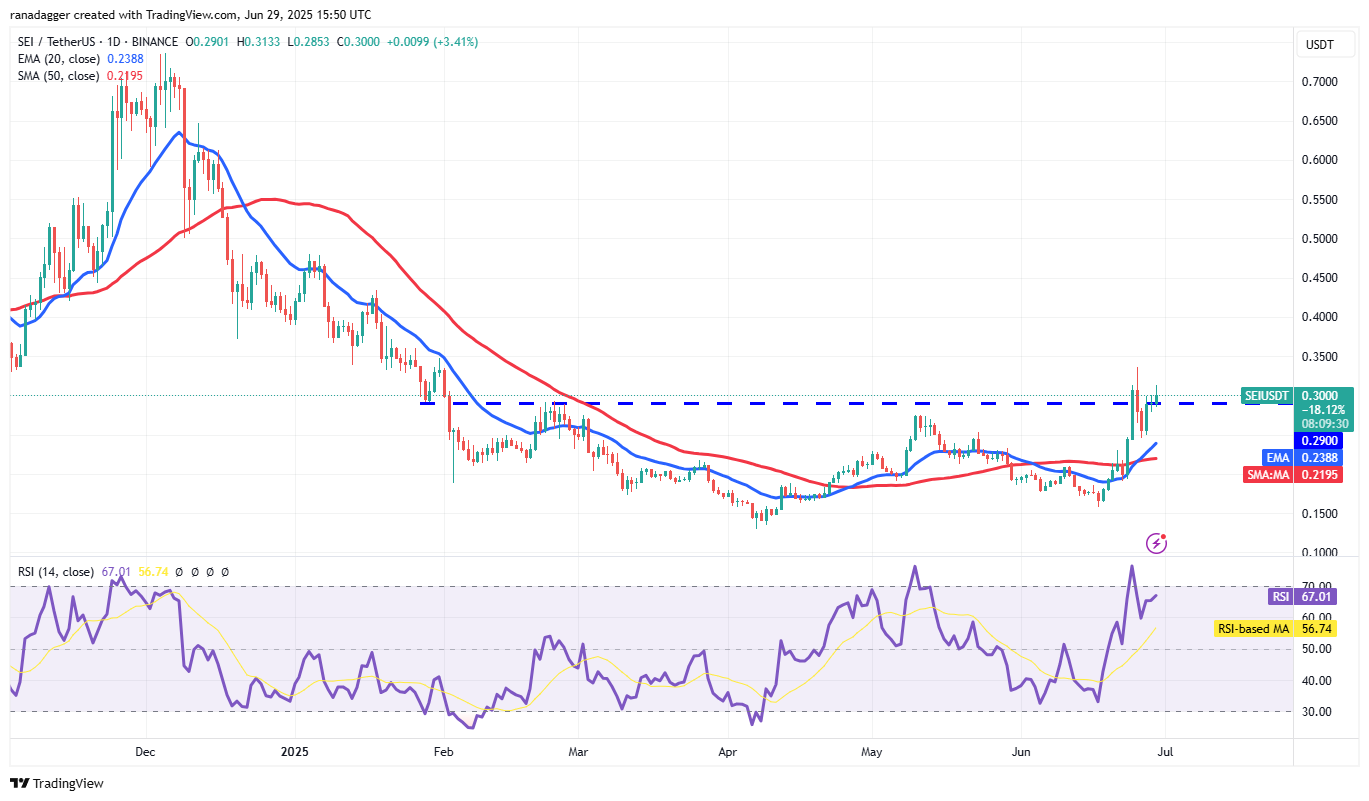
SEI/USDT Daily Chart. Source: TradingView
However, buyers failed to hold the gains, and the price dropped below $0.29 on Wednesday. A bullish sign is that bulls pushed the price back above $0.29. The 20-day MA ($0.23) has begun to turn up, and the RSI is in positive territory, suggesting the path of least resistance is upward. The SEI/USDT pair could rise to $0.35, and later to $0.43.
If the price drops and breaks below the 20-day MA, this optimistic view would be invalidated in the short term. That could pull the pair down to $0.19, and possibly further to $0.15.
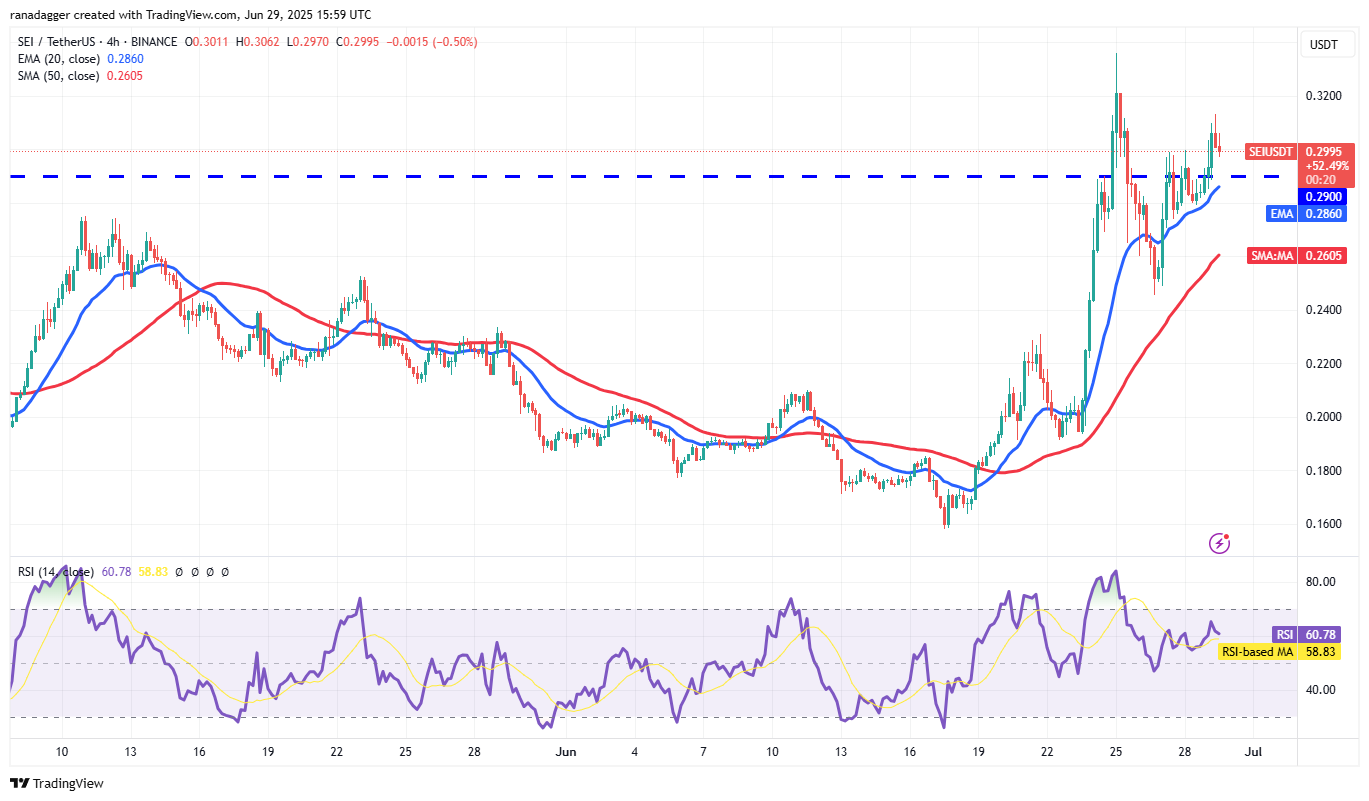
SEI/USDT 4-Hour Chart. Source: TradingView
Both moving averages are trending up, and the RSI is in positive territory, indicating buyer dominance. If the price holds above $0.30, the pair could rise to $0.33.
Sellers may have other plans. They will likely try to pull the price below the 20-day MA. If they succeed, the pair could fall to $0.27, then to the 50-day MA. Buyers are expected to strongly defend the 50-day MA, as a deeper correction could delay the resumption of the uptrend.
Join TechFlow official community to stay tuned
Telegram:https://t.me/TechFlowDaily
X (Twitter):https://x.com/TechFlowPost
X (Twitter) EN:https://x.com/BlockFlow_News