

Fidelity Report: Multiple On-Chain Indicators Suggest ETH Is Undervalued
TechFlow Selected TechFlow Selected
Fidelity Report: Multiple On-Chain Indicators Suggest ETH Is Undervalued
Fidelity Digital Assets analysis indicates that multiple on-chain metrics show ETH's price has bottomed and is undervalued.
Author: Biraajmaan Tamuly
Translation: TechFlow
Key Takeaways:
-
A report from Fidelity Digital Assets indicates that multiple on-chain metrics suggest ETH is trading below its fair value.
-
The BTC/ETH market cap ratio has returned to mid-2020 levels.
-
Active addresses on Ethereum's Layer 2 networks have reached a record high of 13.6 million.
New data from Fidelity Digital Assets suggests a cautiously optimistic outlook for Ethereum, indicating that its poor performance in the first quarter may present an opportunity. According to their latest Signals Report, ether (ETH) declined by 45% in the first quarter, erasing gains it had achieved following the U.S. election and peaking at $3,579 in January.
ETH experienced a death cross in March, with its 50-day simple moving average (SMA) falling 21% below the 200-day SMA, reflecting bearish momentum. However, Fidelity noted that short-term pain could eventually turn favorable for ether.
The investment firm highlighted that the MVRV Z-Score (a measure comparing market value to realized value) dropped to -0.18 on March 9, entering the "undervalued" zone. Historically, such levels often mark market bottoms, suggesting ether appears "cheaper" relative to its "fair value." The Net Unrealized Profit/Loss (NUPL) ratio also fell to 0, indicating a state of "capitulation," where unrealized profits equal losses, implying holders are in a neutral position.
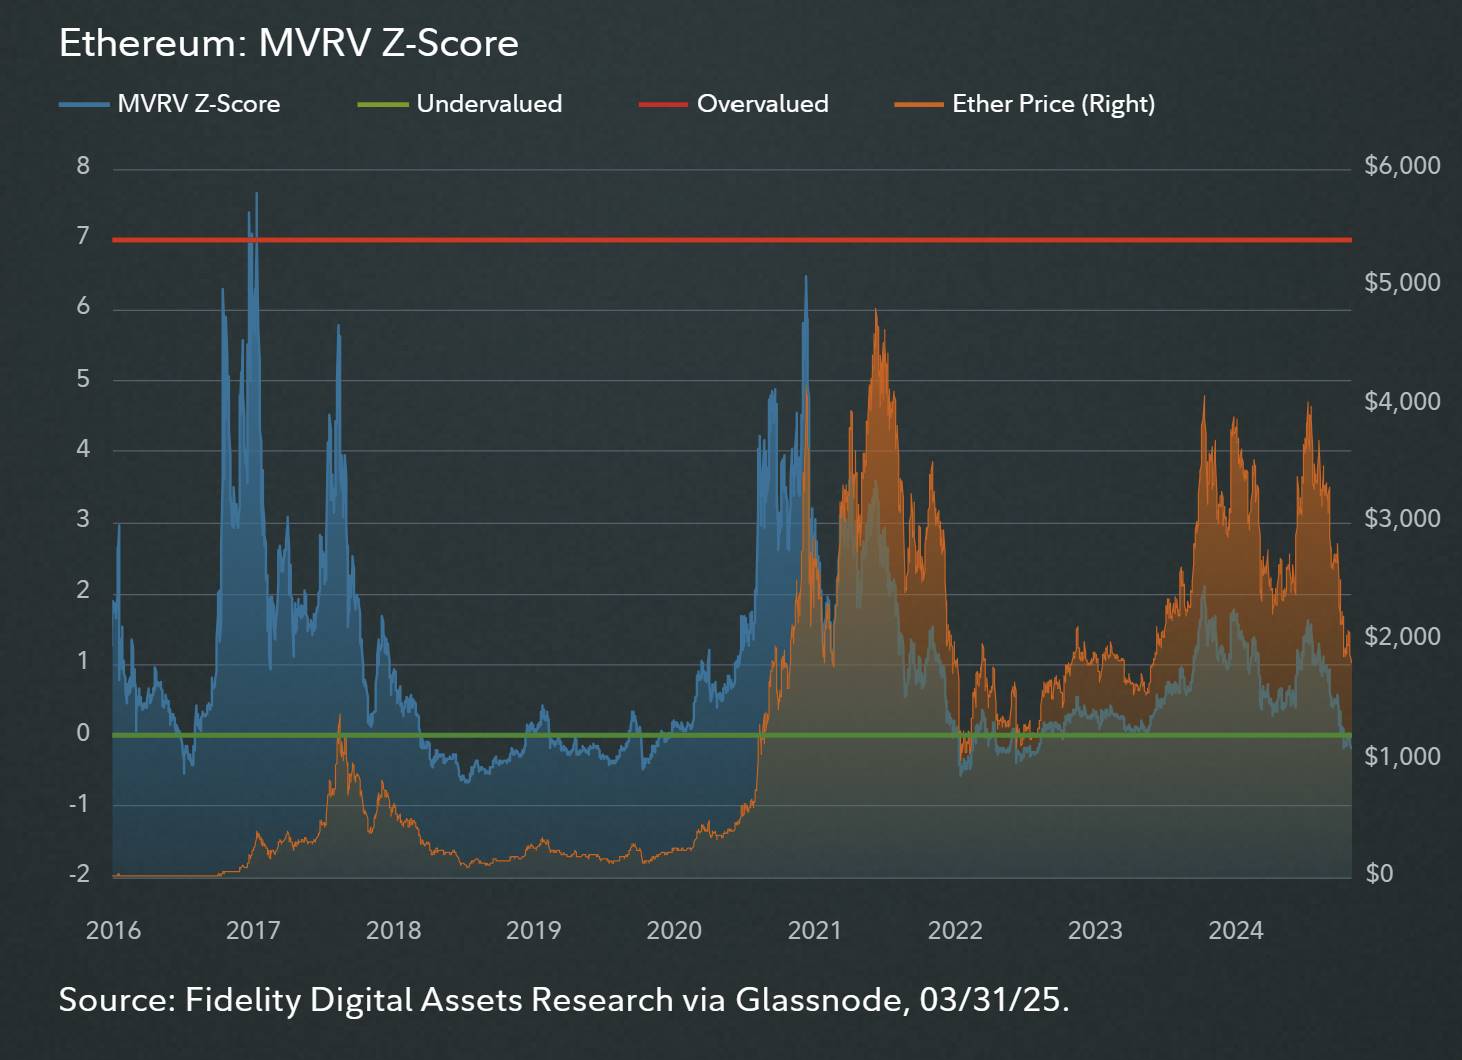
Ethereum's MVRV Z-Score
Source: Fidelity Digital Assets Signals Report
The realized price of ETH averages $2,020, about 10% above current levels, showing that holders face unrealized losses. While this trend appears bearish, the firm noted that the realized price only declined slightly by 3%, compared to the 45% price drop, suggesting that short-term holders have sold off while long-term holders remain committed, potentially stabilizing the underlying price.
However, the company emphasized that in 2022, despite ETH prices falling below realized levels, it continued to decline further before any rebound occurred.
Fidelity also cited the Ethereum-to-Bitcoin market cap ratio at 0.13—levels last seen in mid-2020—and noted it has now been declining for 30 months.
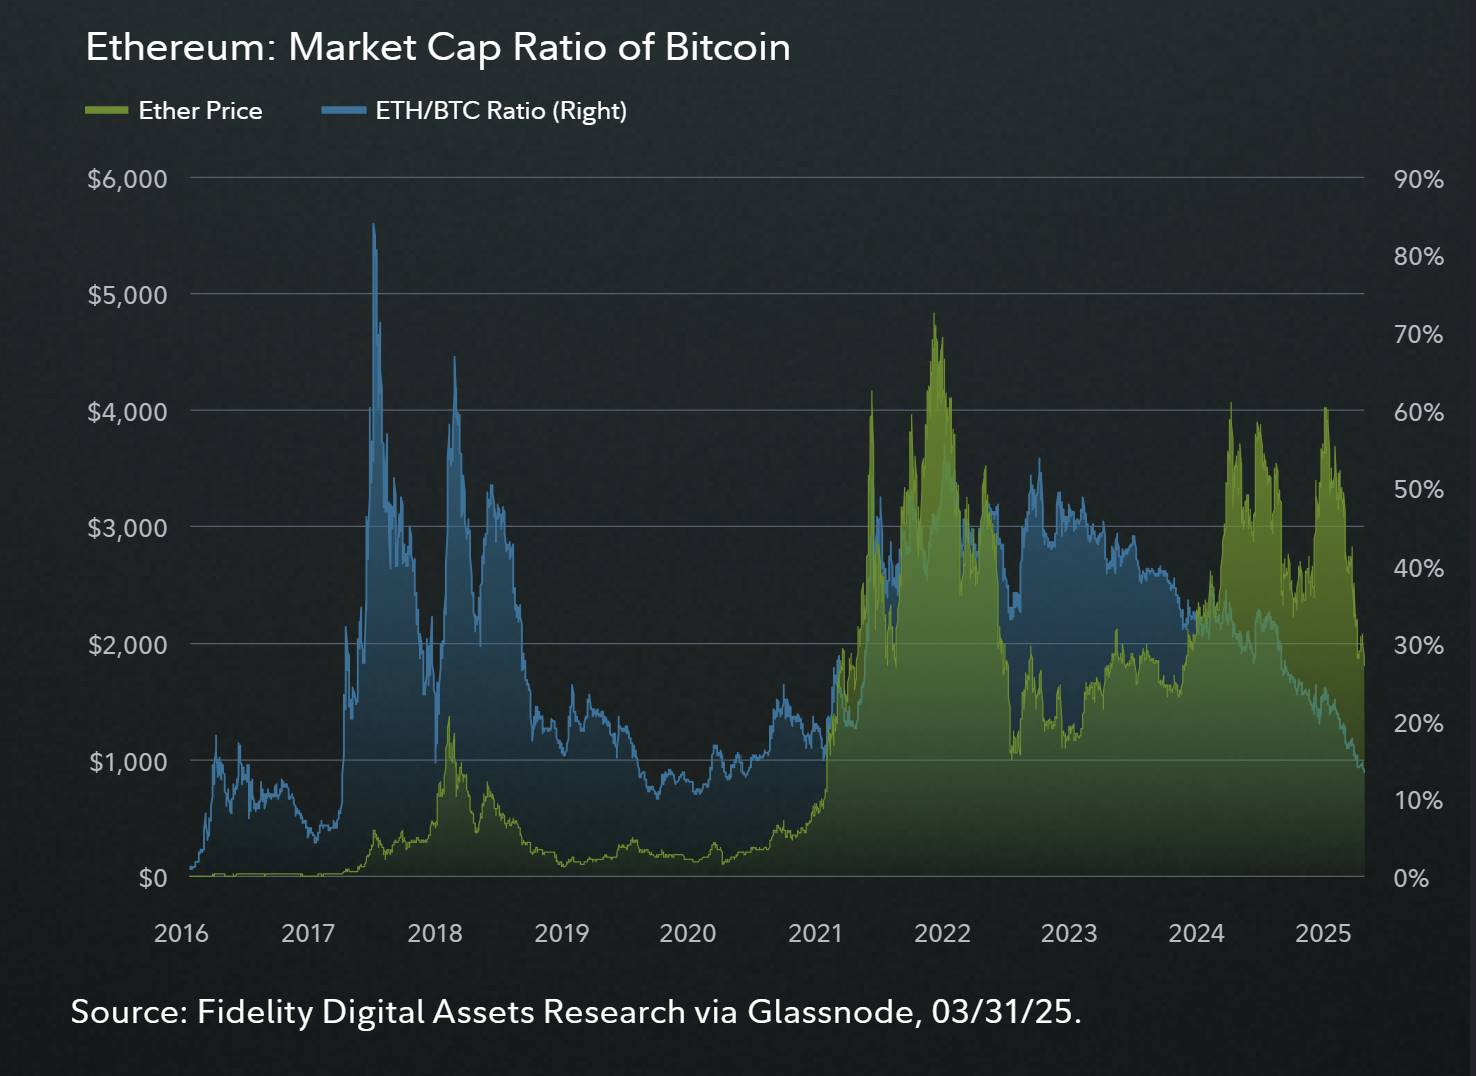
Ethereum/Bitcoin Market Cap Ratio
Source: Fidelity Digital Assets Signals Report
Ethereum Ecosystem Engagement Hits Record High
Data from growthepie.xyz shows that the number of unique addresses interacting with Ethereum’s Layer 1 or Layer 2 networks has reached a record high of 13.6 million. The proportion of active addresses rose 74% over the past week, signaling improved network scalability and growing adoption.
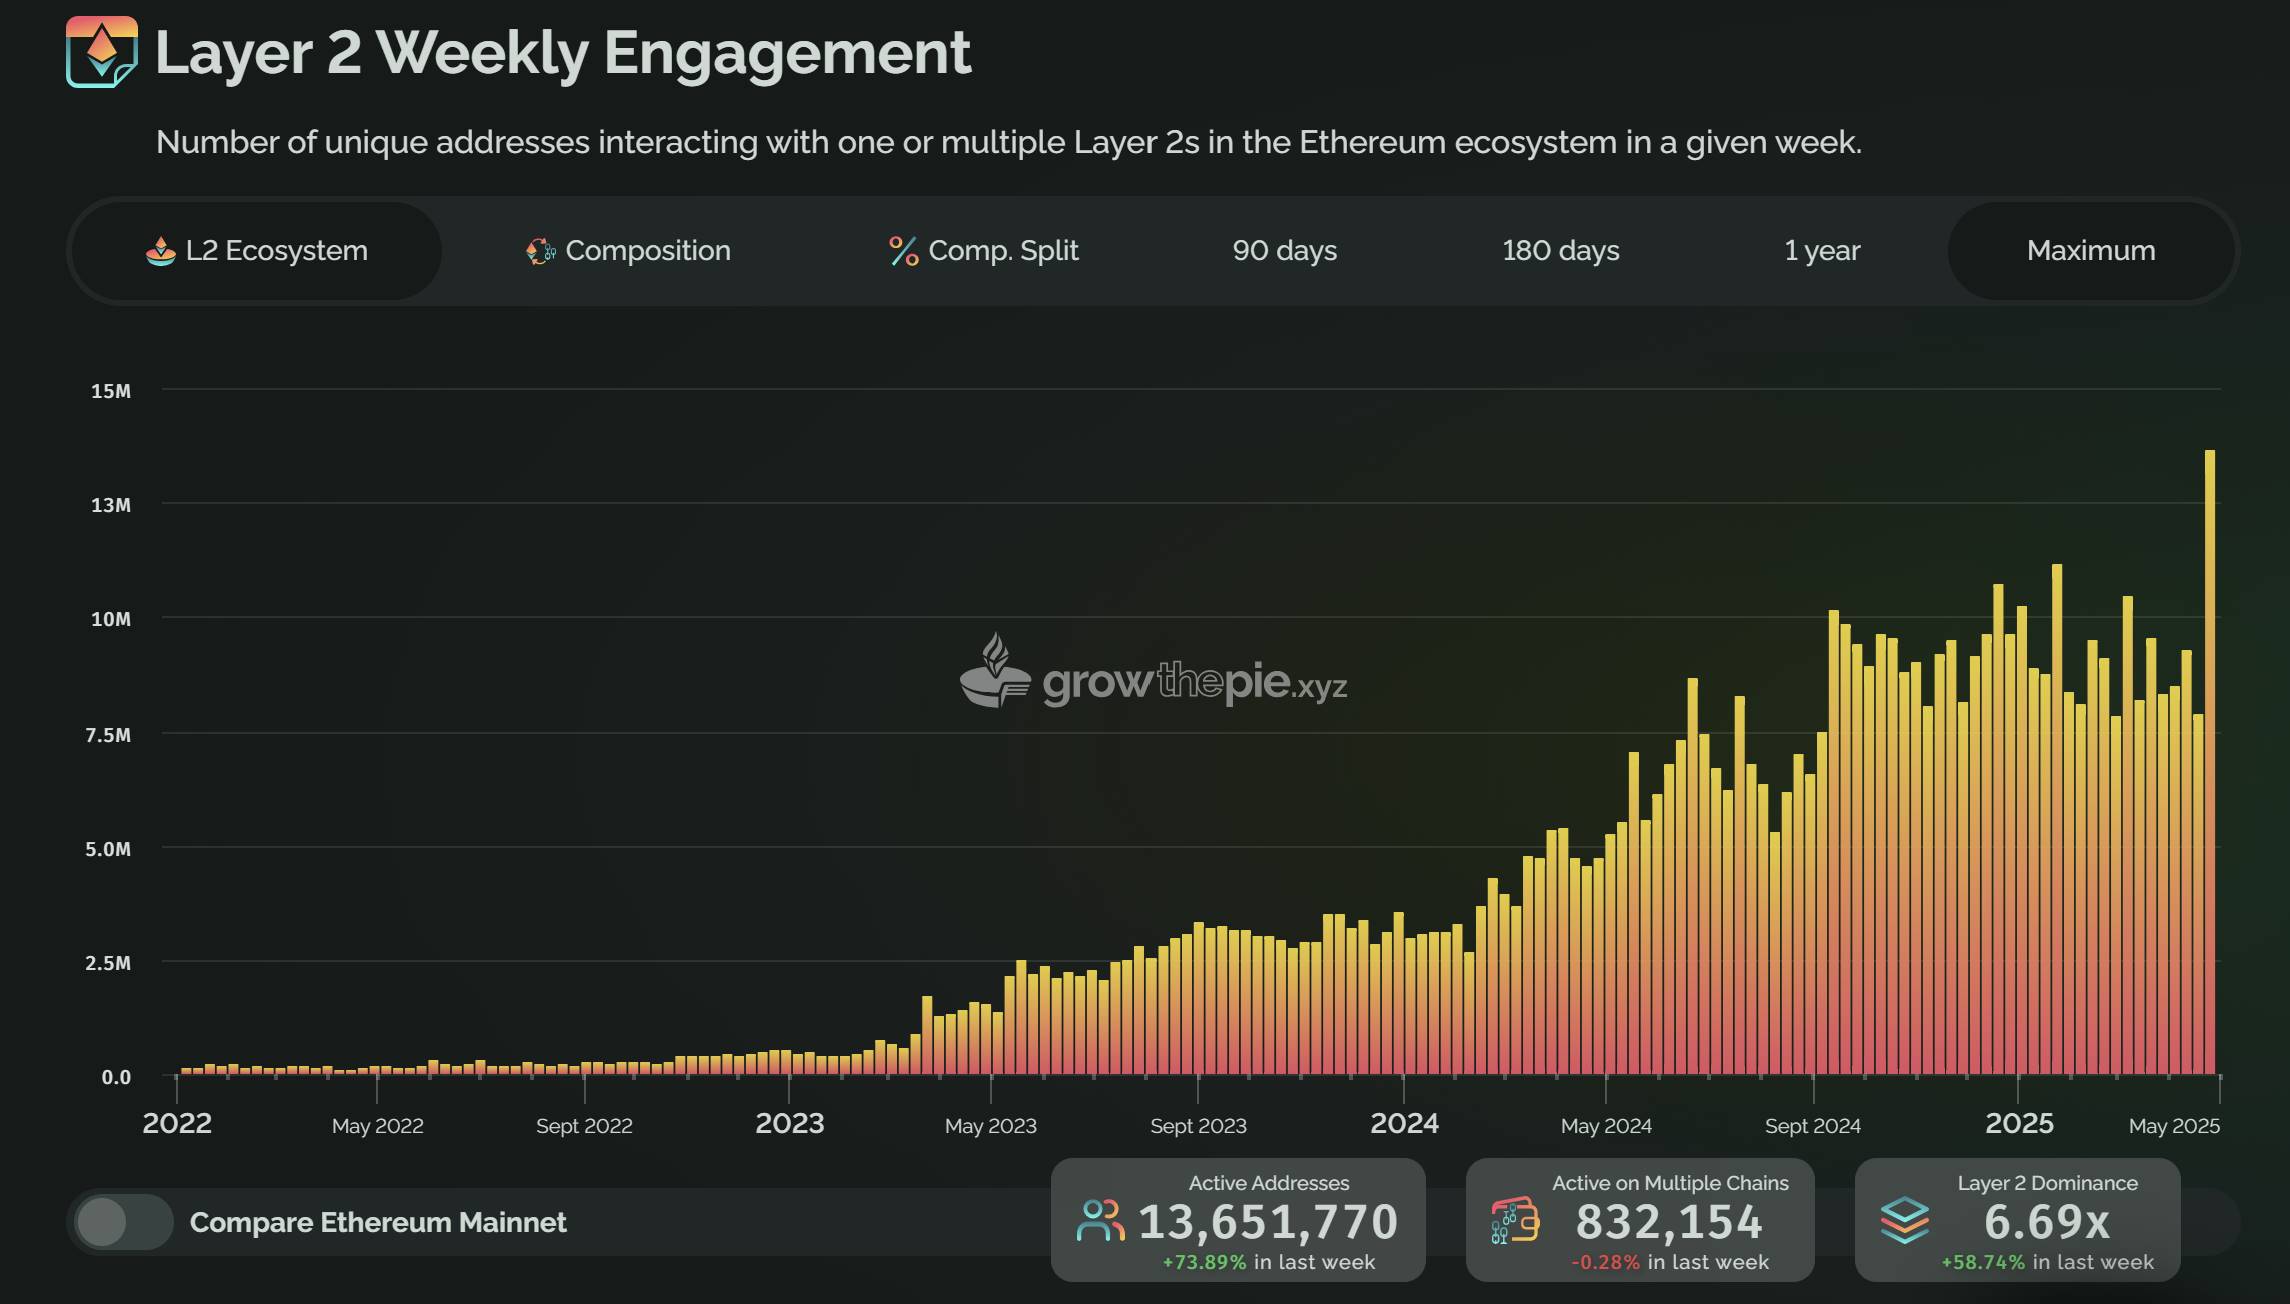
Weekly Interactions with Ethereum and L2 Networks
Source: growthepie.xyz
Uniswap's new Layer 2 protocol, Unichain, leads with over 5.82 million weekly active addresses, surpassing Base and Arbitrum. The collective rise in active addresses has increased Ethereum's Layer 2 dominance by 58.74% over the past seven days.
Anonymous crypto trader CRG pointed out that ETH prices have risen above the 12-hour Ichimoku cloud for the first time since December 2024. The Ichimoku cloud suggests an uptrend when price is above the cloud and the cloud turns green, indicating bullish sentiment.
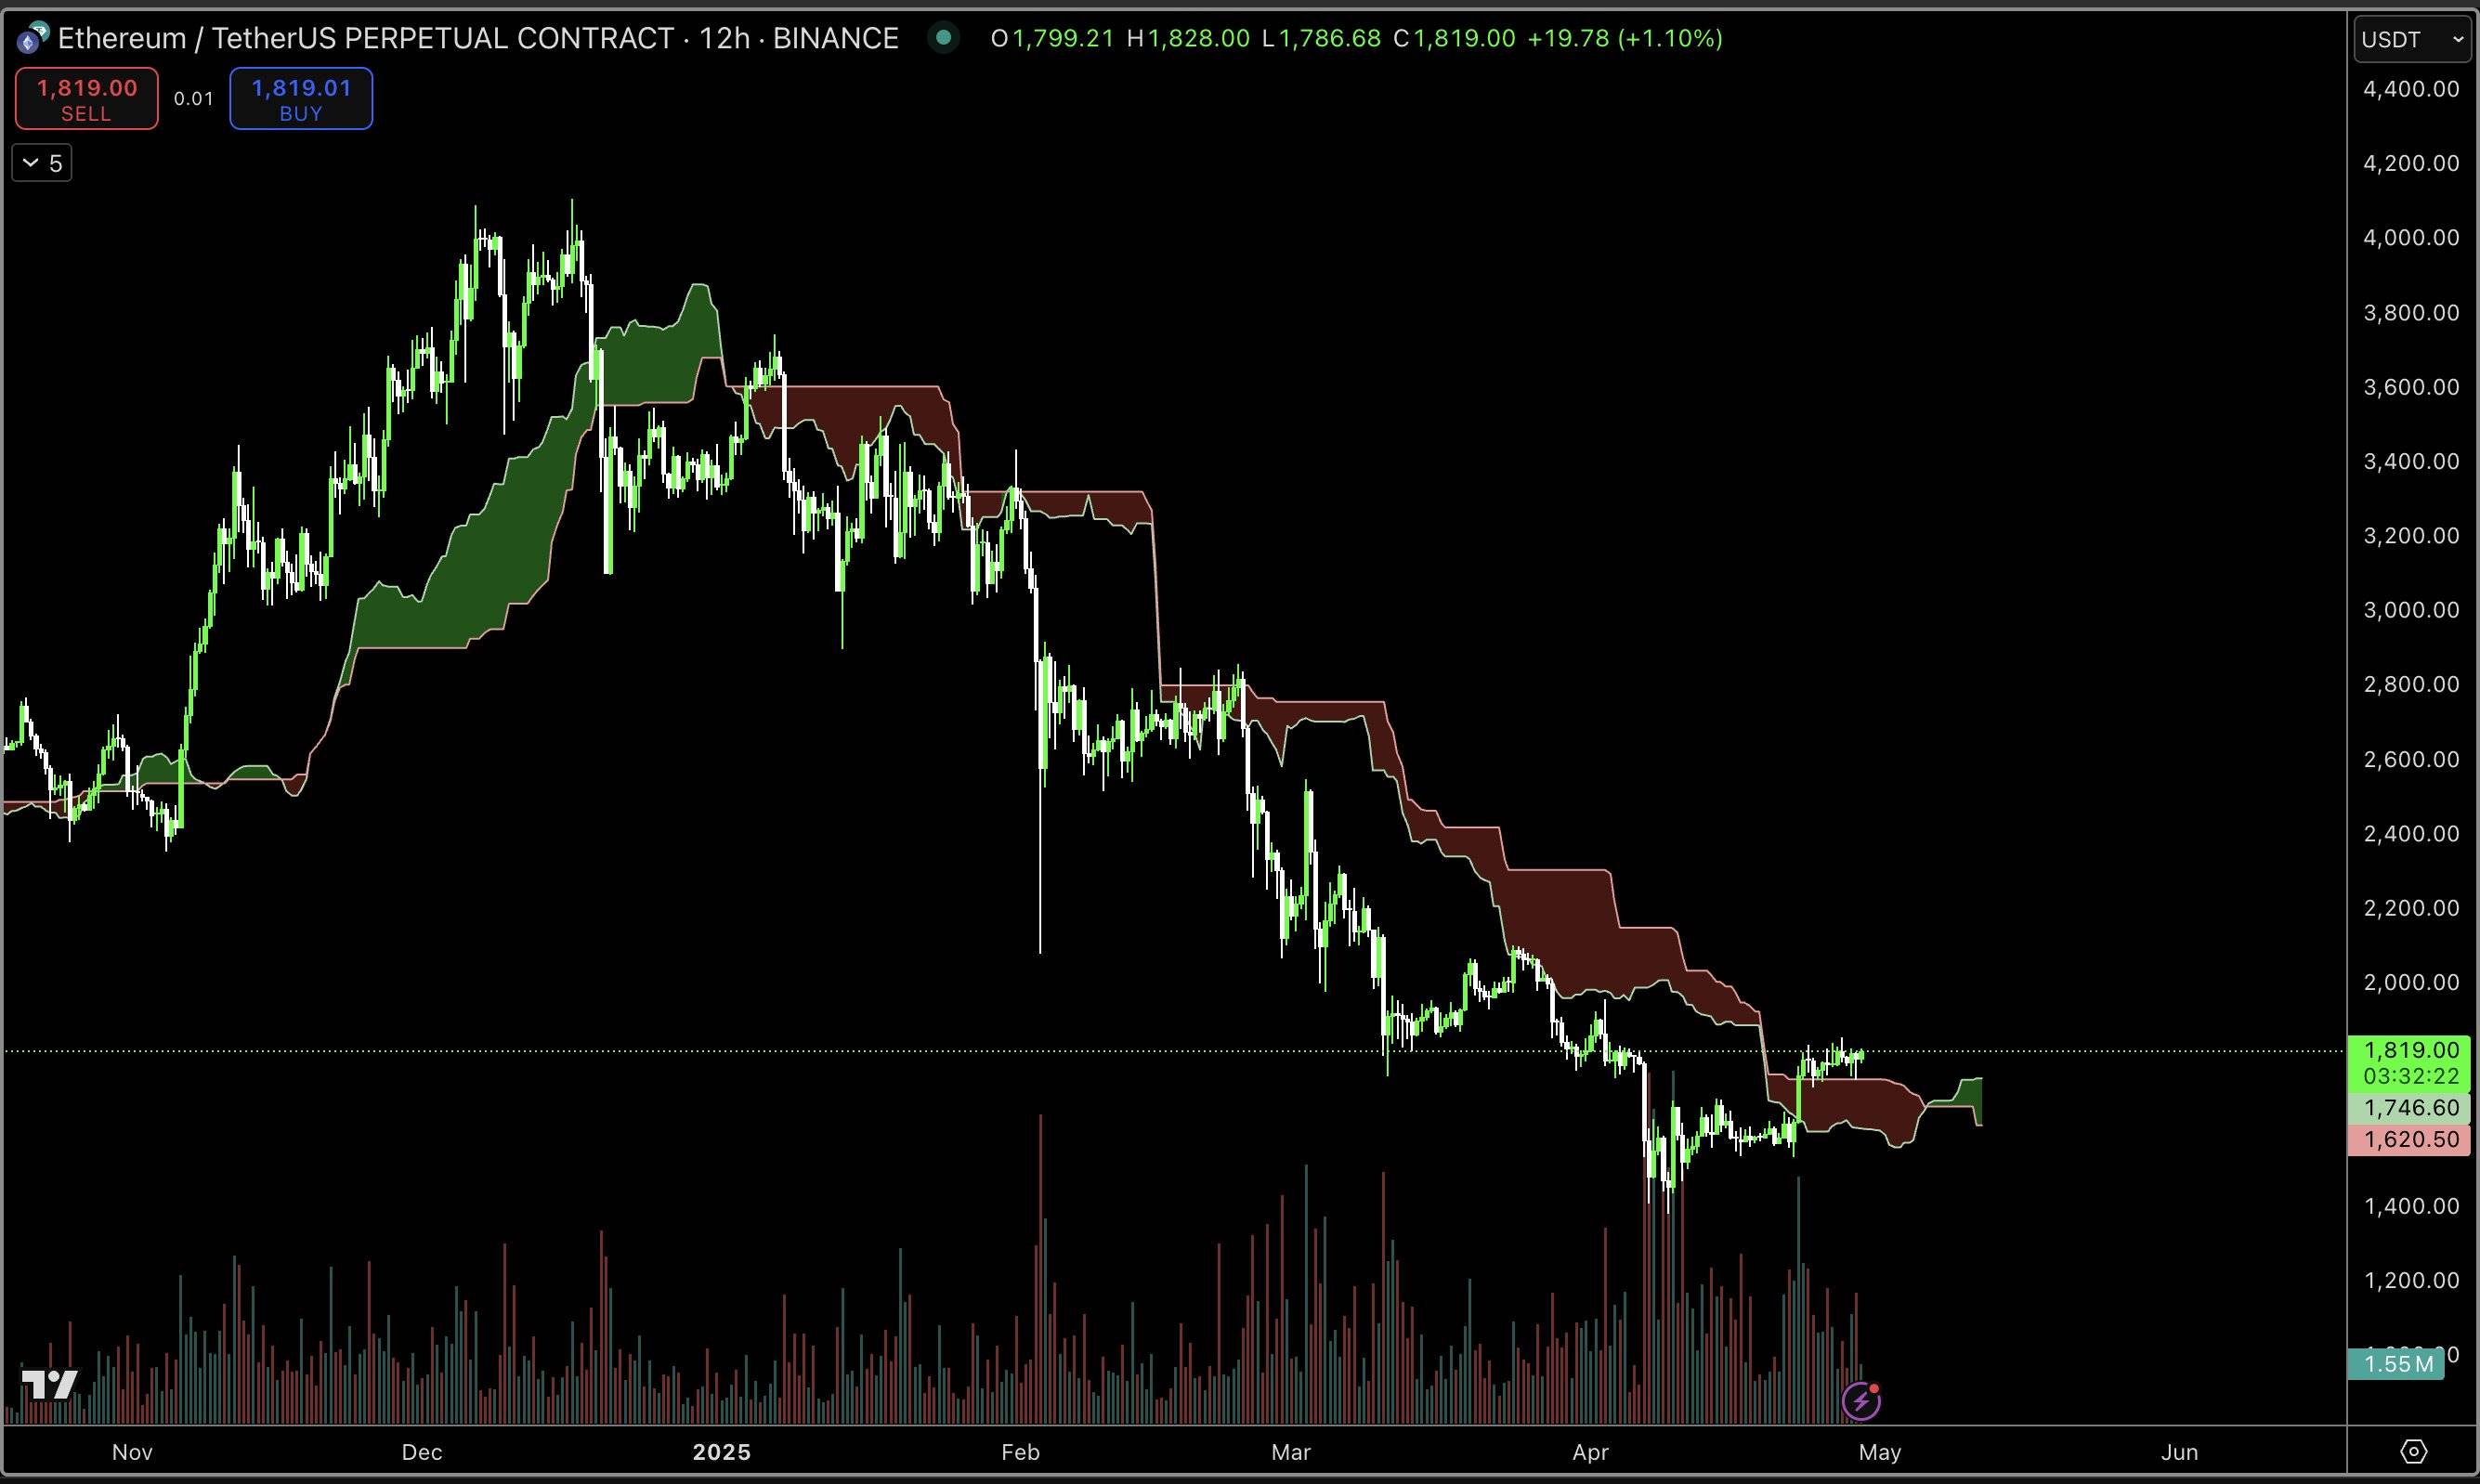
12-Hour Ethereum Analysis by CRG
Source: X.com
This article does not contain investment advice or recommendations. Every investment and trading decision involves risk, and readers should conduct their own research before making decisions.
Join TechFlow official community to stay tuned
Telegram:https://t.me/TechFlowDaily
X (Twitter):https://x.com/TechFlowPost
X (Twitter) EN:https://x.com/BlockFlow_News


