Where might ETH reach its peak?
TechFlow Selected TechFlow Selected
Where might ETH reach its peak?
The baseline assumption remains: Ethereum will reach the peak of this cycle within this quarter.
By: Michael Nadeau
Translated by: Luffy, Foresight News
Tom Lee recently proposed at Korea Blockchain Week that Ethereum's mid-term price target is $60,000, stating that Ethereum is currently in a 10-15 year supercycle.
If his assessment is correct, this supercycle will progress in waves across multiple cycles, accompanied by alternating bull and bear markets.
Currently, we are in a bull market, but bull markets do not last forever.
Looking back historically, Ethereum dropped 94% in 2018 and 80% in 2022, so it is reasonable to anticipate another significant correction in the future.
We cannot determine exactly when such a correction will occur, but by tracking several key metrics, we can reference levels Ethereum reached in past cycles to inform future price movements.
Key Metric Analysis and Price Targets
200-Week Moving Average
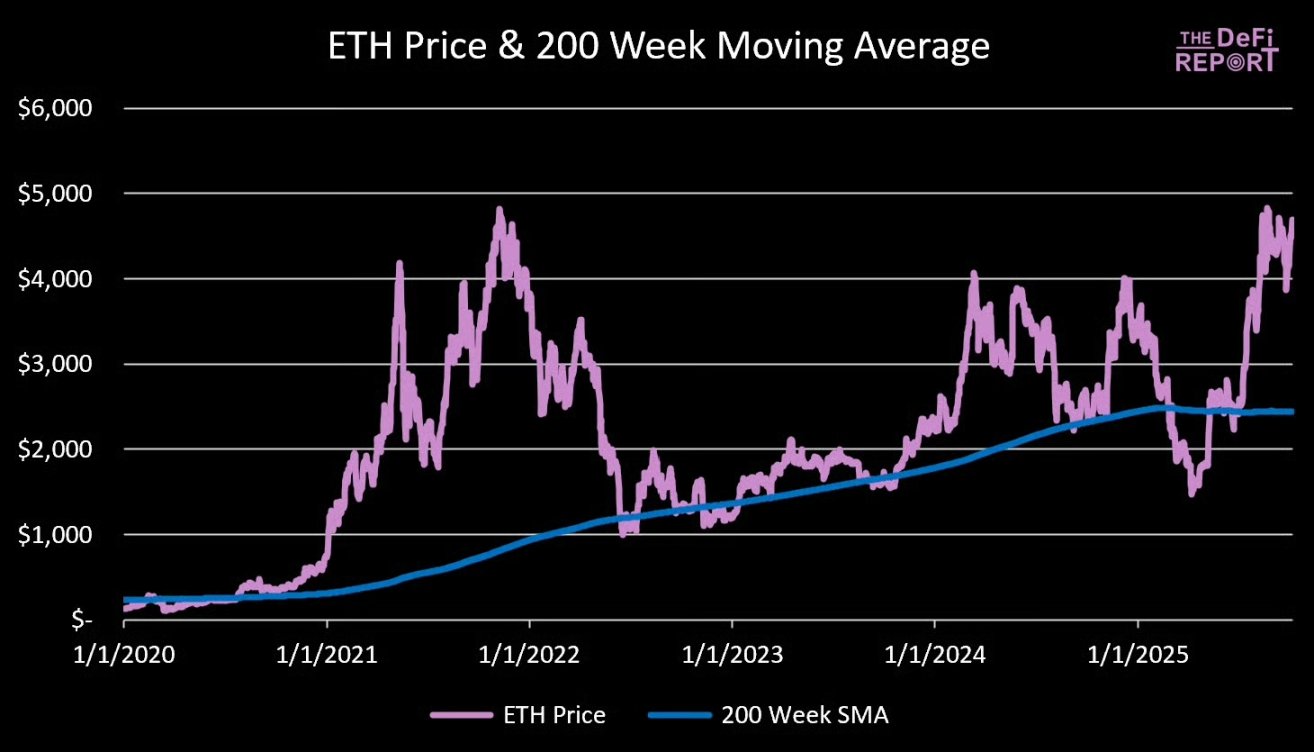
Data source: The DeFi Report
Currently, Ethereum is trading 92% above its 200-week moving average ($2,400).
In the 2021 cycle, at market peak, Ethereum was priced 492% above its 200-week moving average.
Scenario analysis:
-
200% above 200-week MA: Ethereum price at $7,300
-
250% above 200-week MA: Ethereum price at $8,500
-
300% above 200-week MA: Ethereum price at $9,800
-
350% above 200-week MA: Ethereum price at $11,000
-
400% above 200-week MA: Ethereum price at $12,200
Note: The 200-week moving average is a dynamic indicator, but as time progresses, we are gradually replacing data from about four years ago when Ethereum traded in the $3,000–$4,000 range. Therefore, the 200-week MA is expected to fluctuate very little by the end of this year.
Ethereum Price to Realized Price Ratio
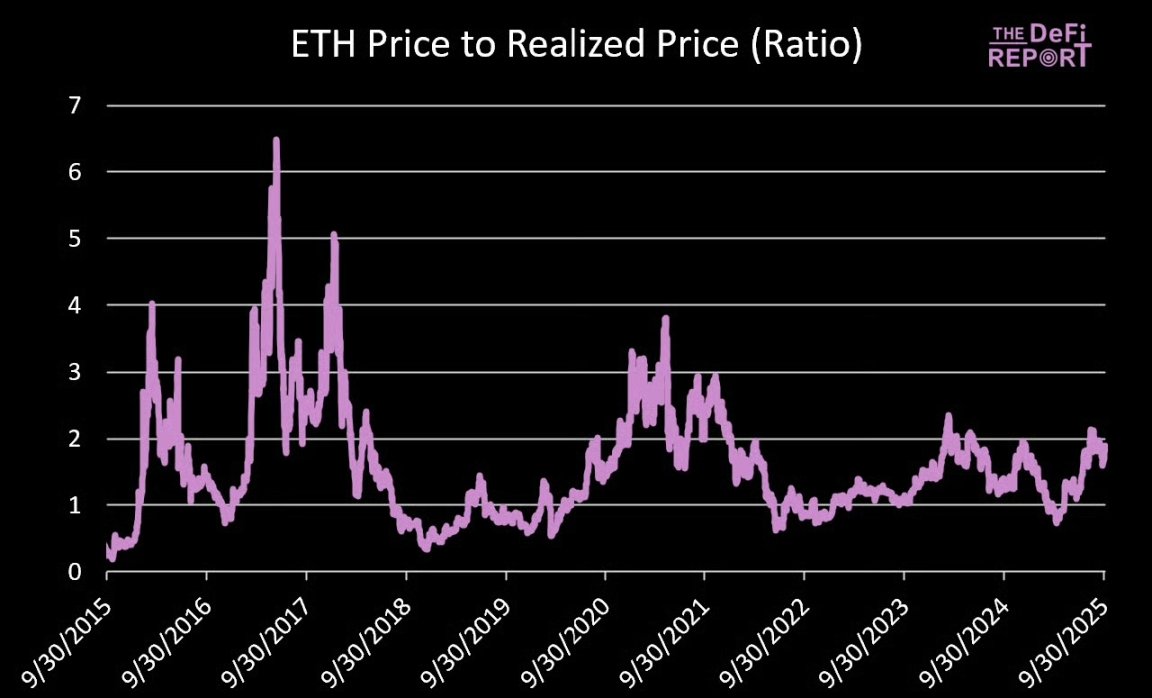
Data source: The DeFi Report, Glassnode
The realized price serves as an alternative cost basis metric. Since January 1, 2017, the average ratio of Ethereum’s price to realized price has been 1.6. The current ratio is 1.9.
In the 2017 cycle, the ratio peaked at 5; in the 2021 cycle, it peaked at 3.5 in April and 2.9 in November.
Scenario analysis (assuming ratio reaches 2.9):
-
If realized price is $3,000: Ethereum price at $8,700
-
If realized price is $3,500: Ethereum price at $10,200
-
If realized price is $4,000: Ethereum price at $11,600
MVRV Z-Score
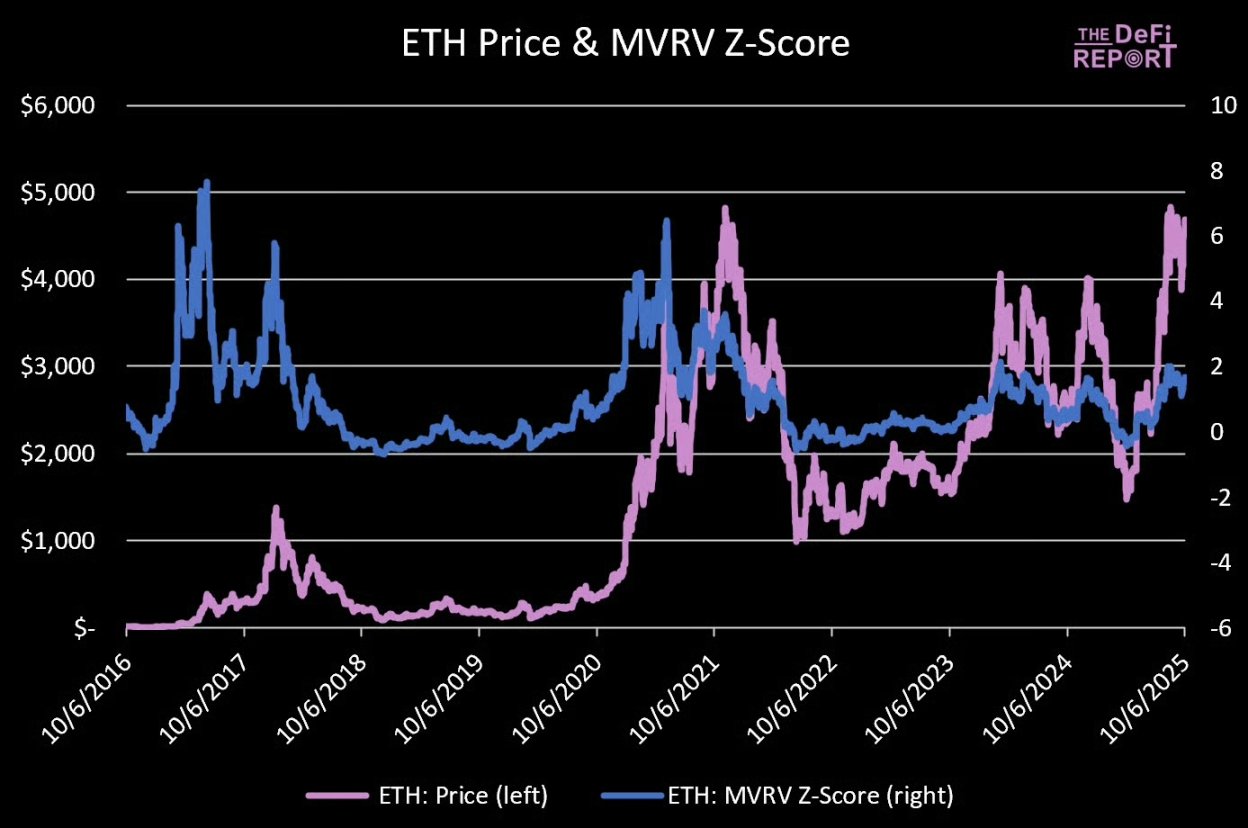
Data source: The DeFi Report, Glassnode
The Z-score measures how many "standard deviations" market cap is above or below on-chain cost basis. A higher Z-score indicates overheating; negative values suggest undervaluation.
Since January 1, 2017, Ethereum's average Z-score has been 0.99, indicating overall market optimism.
The current Z-score is 1.66—higher than historical average but not yet overheated.
In the 2021 cycle, the Z-score peaked at 6.5 in April and 3.48 in November.
Scenario analysis:
-
If Z-score is 2.21: Ethereum price at $7,000
-
If Z-score is 2.77: Ethereum price at $8,000
-
If Z-score is 3.33: Ethereum price at $9,000
-
If Z-score is 3.9: Ethereum price at $10,000
Note: Assumes realized price increases 22% by year-end (to $3,000). For reference, realized price has risen 24% since April this year.
Ethereum to Bitcoin Market Cap Ratio
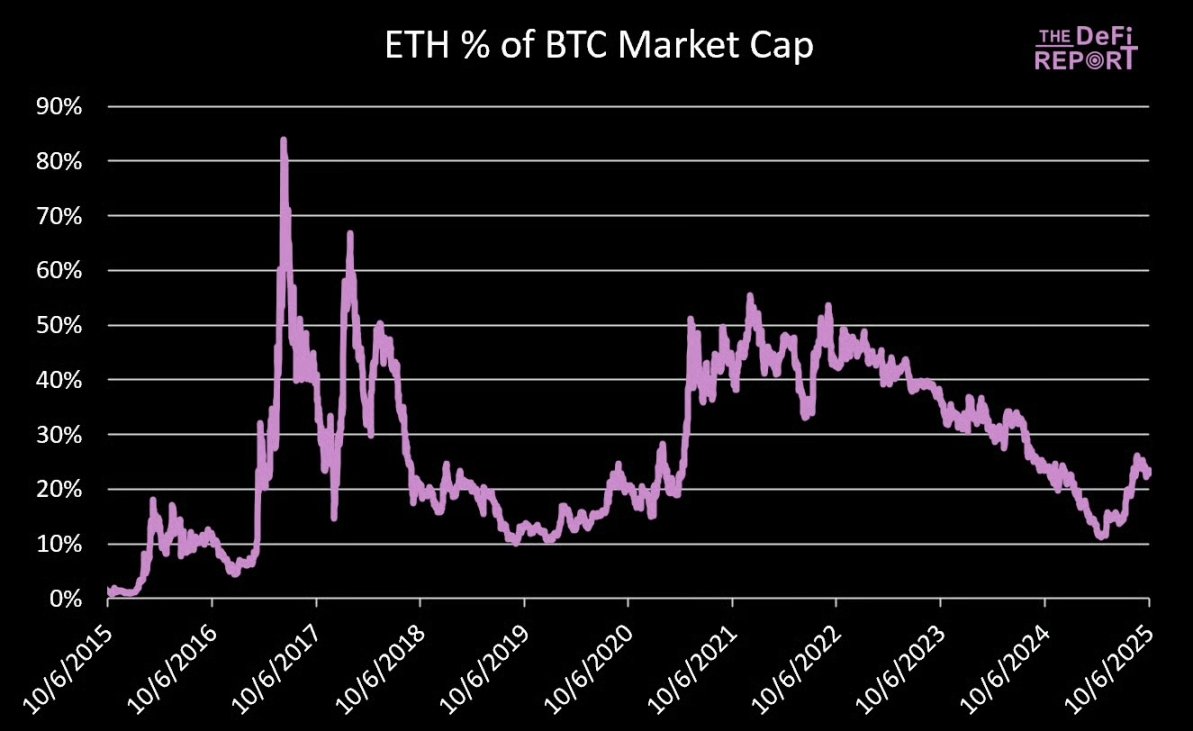
Data source: The DeFi Report
Currently, Ethereum's market cap is approximately 23.4% of Bitcoin's.
In November 2021, Ethereum's market cap reached 55.5% of Bitcoin's.
If Bitcoin reaches $150,000 (a 23% increase from current levels), its market cap would reach $3 trillion.
Scenario analysis:
-
If Ethereum's market cap is 35% of Bitcoin's: Ethereum valuation at $1.05 trillion, corresponding to a price of $8,658
-
If Ethereum's market cap is 45% of Bitcoin's: Ethereum valuation at $1.35 trillion, corresponding to a price of $11,132
-
If Ethereum's market cap is 55% of Bitcoin's: Ethereum valuation at $1.64 trillion, corresponding to a price of $13,559
The core question is: Will Bitcoin see a substantial rally? Compared to the previous cycle, will Ethereum's outperformance relative to Bitcoin be mild or explosive?
Ethereum to Nasdaq Index Ratio
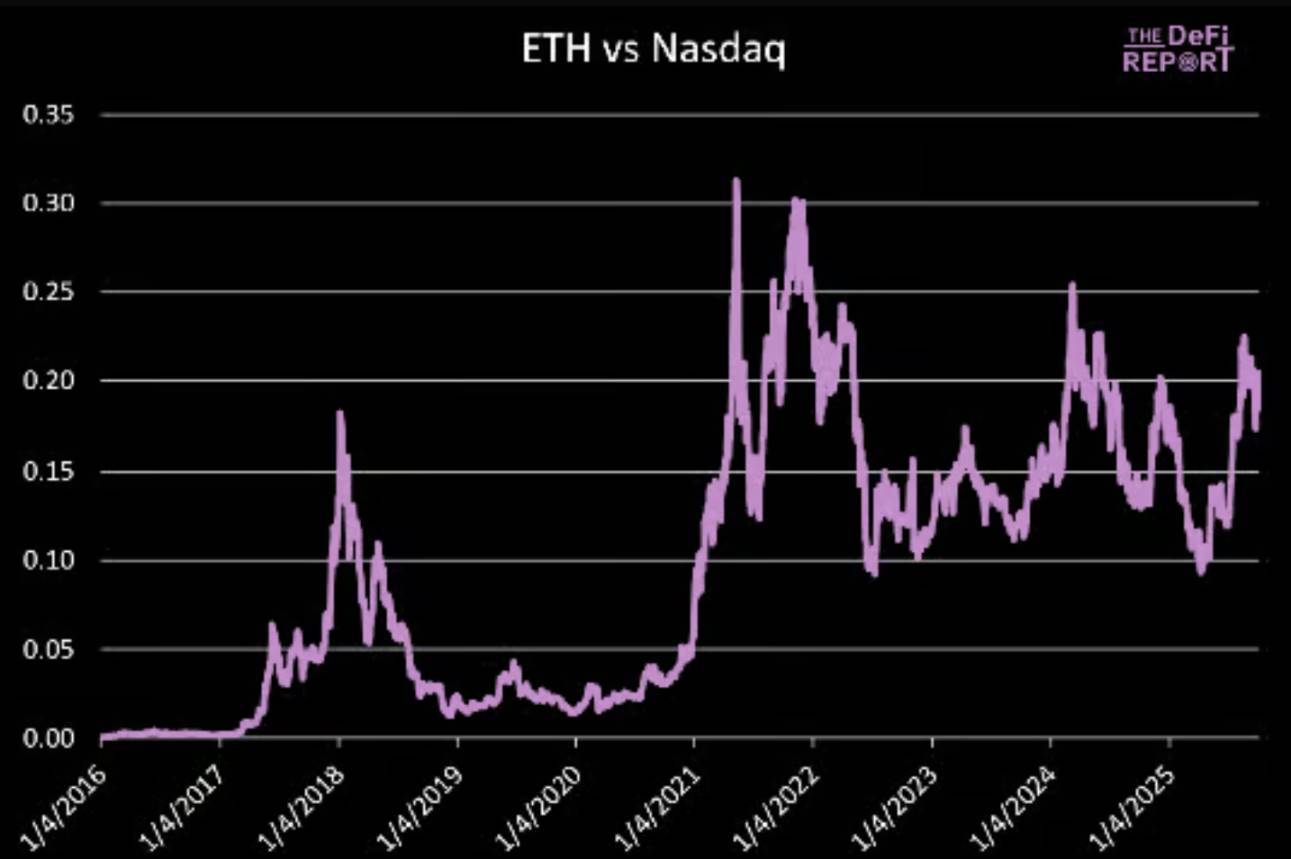
Data source: The DeFi Report
In May and November 2021, the Ethereum to Nasdaq index ratio peaked at 0.31 and 0.30, respectively.
The current ratio is 0.20, with the Nasdaq index currently at 22,788 points.
If the Nasdaq rises 5% by year-end (up 23% for the year), it would reach 23,927 points.
Ethereum price scenario analysis:
-
If ratio is 0.25: Ethereum price at $5,981
-
If ratio is 0.30: Ethereum price at $7,178
-
If ratio is 0.35: Ethereum price at $8,374
-
If ratio is 0.40: Ethereum price at $9,570
Our base assumption is that the cyclical upward trend in the Ethereum to Nasdaq ratio will continue, and this cycle will set a new all-time high (above 0.30).
Summary
Our base assumptions are as follows:
-
Ethereum trades 250% above its 200-week MA, corresponding to a price of $8,500;
-
Realized price reaches $3,000; if price-to-realized-price ratio is 2.9, Ethereum price reaches $8,700;
-
Ethereum market cap reaches 35% of Bitcoin's; if Bitcoin is at $150,000, Ethereum price reaches $8,600;
-
Ethereum to Nasdaq ratio hits a new high; if ratio is 0.35, Ethereum price reaches $8,300.
If the bull market continues, Ethereum could surpass $10,000; if the market turns bearish and Bitcoin's peak gains are limited, Ethereum will face downward pressure accordingly.
Meanwhile, as market sentiment heats up, increasing discussions about "cycle extension" have emerged, reminding me of the prevailing "supercycle" narrative in 2021.
As we previously stated, our baseline assumption remains: within this quarter, Ethereum will reach its cycle peak.
Join TechFlow official community to stay tuned
Telegram:https://t.me/TechFlowDaily
X (Twitter):https://x.com/TechFlowPost
X (Twitter) EN:https://x.com/BlockFlow_News