

Crypto market may be approaching a trend reversal—spotting investment opportunities from short-term liquidity flows
TechFlow Selected TechFlow Selected
Crypto market may be approaching a trend reversal—spotting investment opportunities from short-term liquidity flows
Under the current trend, further rallies are coming in the crypto market.
Author: Alfred, Trend Research
1. Gradual Improvement in Macro and Crypto Markets
1. Signs of Tariff Relief
The short-term sentiment shock and risk-off trades triggered by Trump's tariff policy have eased, with market volatility declining. On Tuesday (April 22) local time, Trump publicly acknowledged that current U.S. tariffs on Chinese imports are too high and indicated that rates would be significantly reduced. This marks a softening in Trump’s stance on his signature tariff policy.
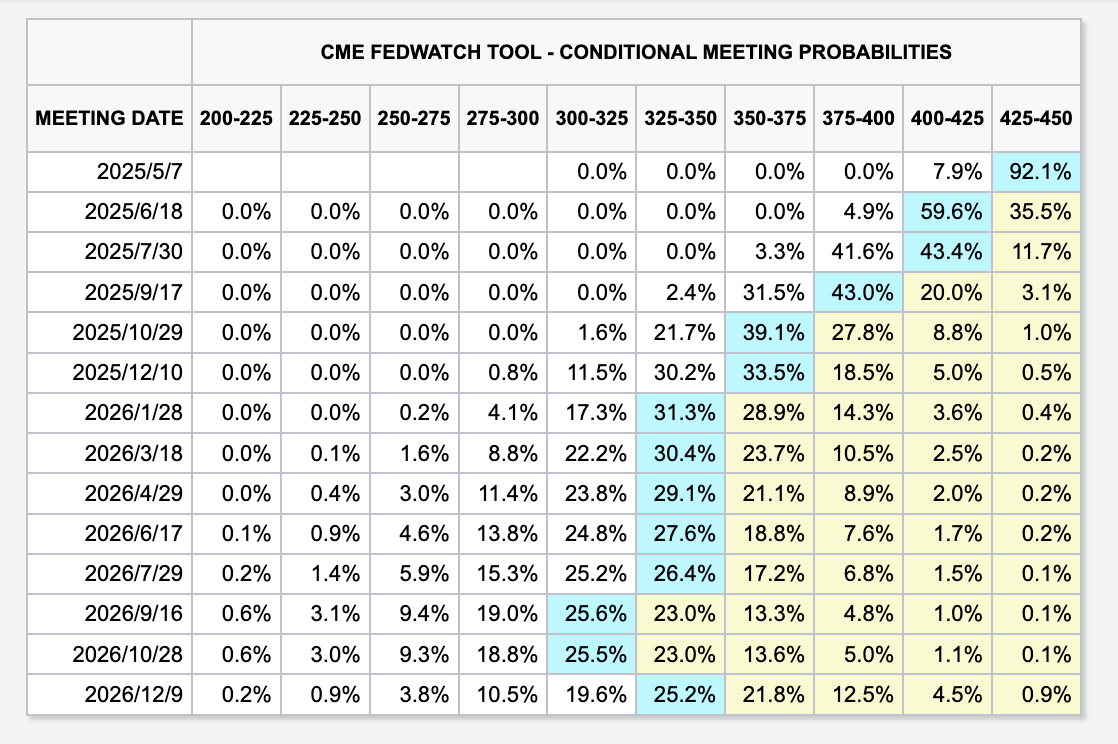
2. Expectations for Interest Rate Easing
CME interest rate futures currently price in the first rate cut starting in June, with three cuts expected this year. This could inject fresh liquidity into markets.
3. Pro-Crypto Policies Progressing
Since taking office, Trump has prioritized the crypto industry as part of efforts to build a new “dollar hegemony” system. (1) On March 6, 2025, Trump signed an executive order to establish a "Strategic Bitcoin Reserve" and a "U.S. Digital Asset Reserve." The plan is now moving forward, while dozens of U.S. states are advancing state-level Bitcoin reserve legislation. Arizona is set to send its bill to the governor for signature after passing its third reading. (2) The U.S. is advancing two stablecoin bills: the GENIUS Act (Guiding and Establishing National Innovation Using Stablecoins Act) and the STABLE Act (Stablecoin Transparency, Accountability, and Boosting the Economy Act). Both proposals have passed their respective committees. Industry expectations suggest the final law may pass and take effect in the second half of 2025, depending on coordination speed between congressional chambers and the president’s position. (3) On April 22, Paul Atkins, nominated by Trump, officially succeeded Gary Gensler as SEC Chair. Atkins is seen as a crypto-friendly regulator who is expected to reduce enforcement actions against crypto firms and support industry innovation.
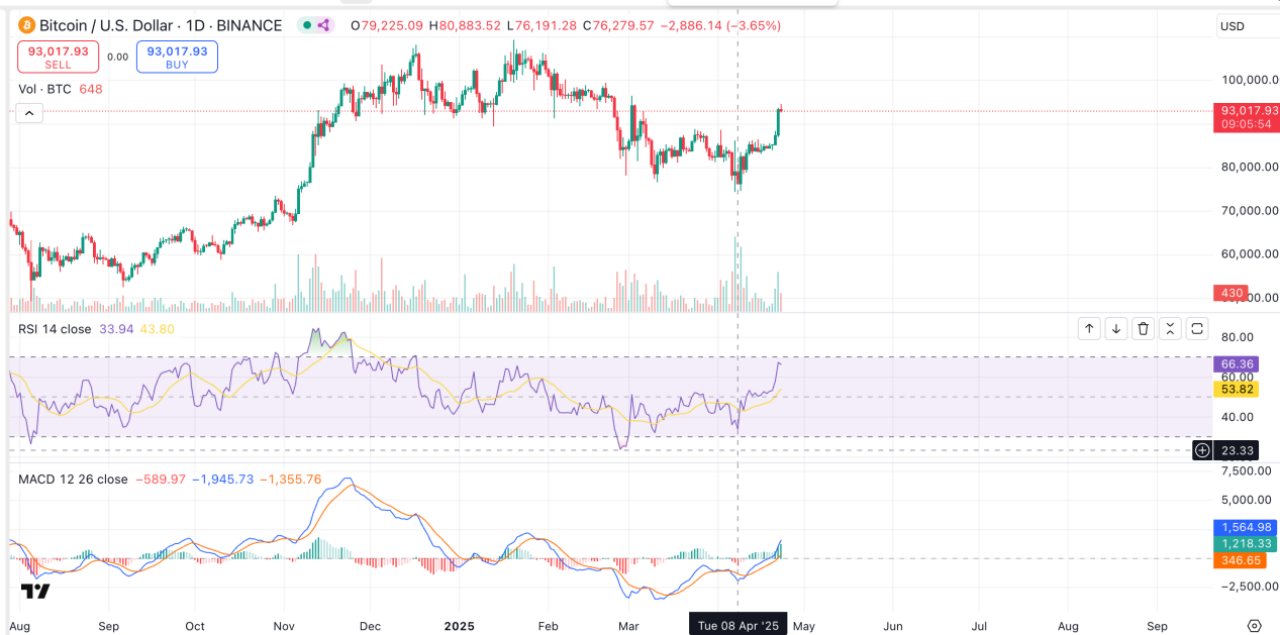
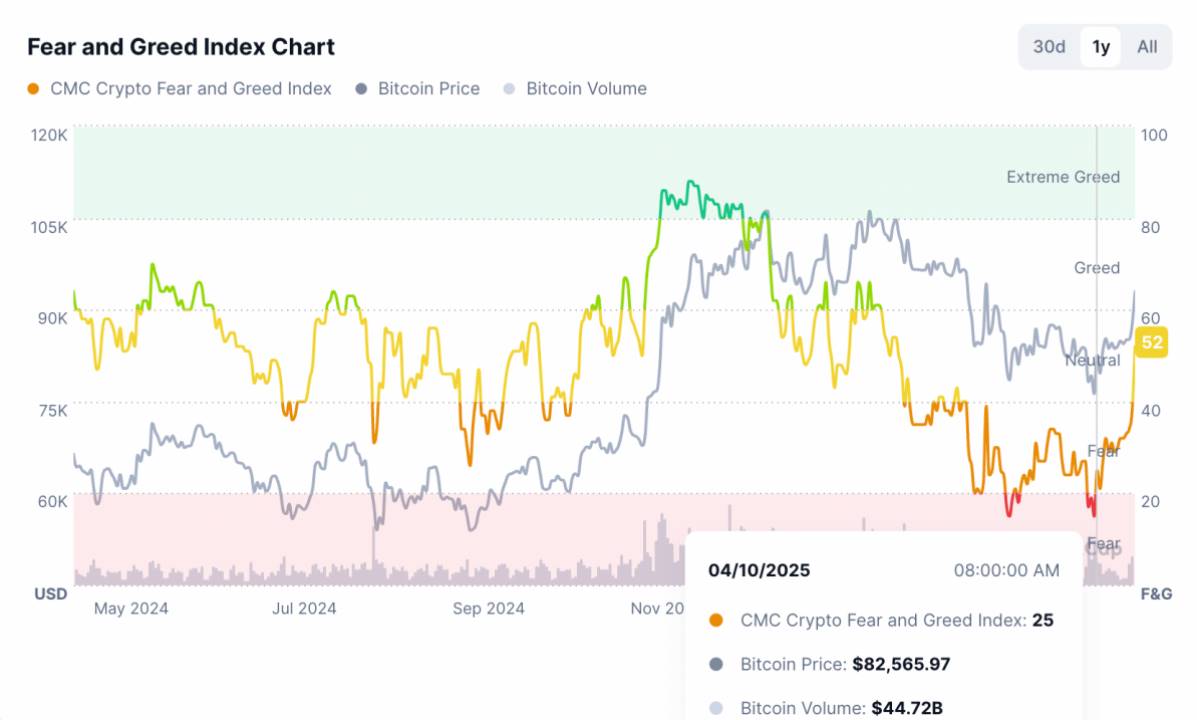
4. BTC Shifts from Bearish to Bullish
Since mid-March, BTC has outperformed U.S. equities, showing some gold-like safe-haven characteristics. Around April 8, both RSI and MACD showed bullish divergence, coinciding with sentiment indicators reaching extreme fear levels—forming a recent bottom. As of now, both MACD lines are above zero, signaling a shift from bearish to bullish momentum.
2. ETH May Lead Altcoins Toward Trend Reversal
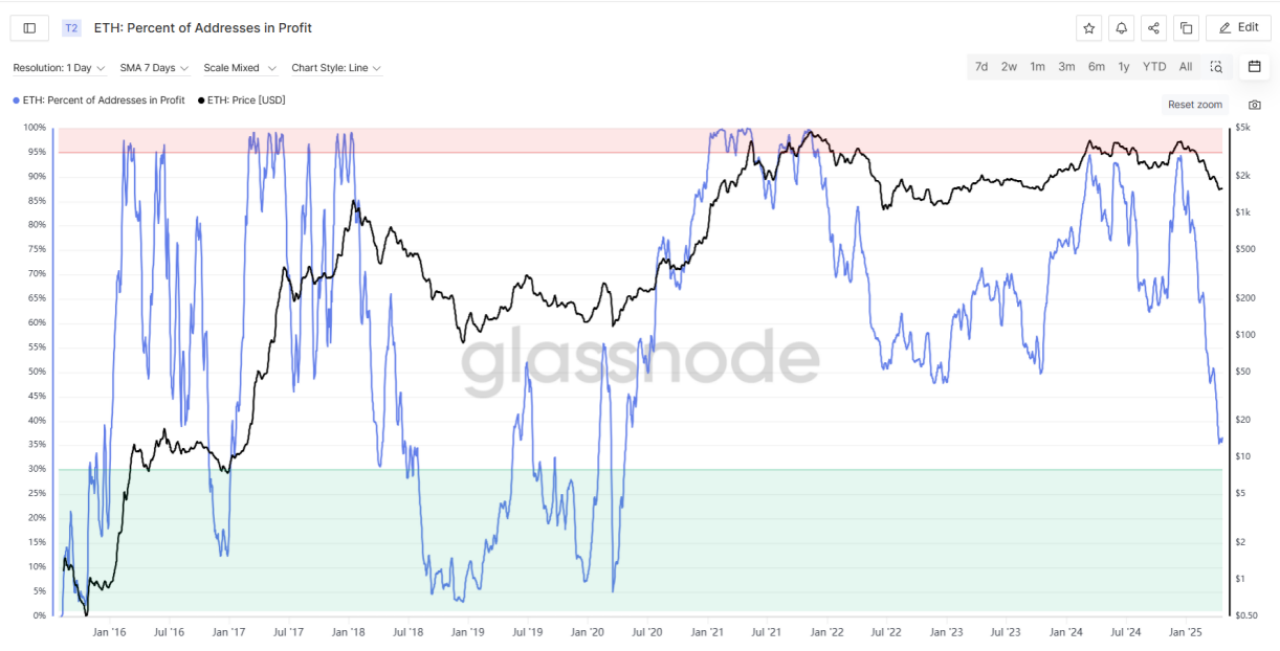
1. On-chain Data: ETH has undergone a prolonged five-month decline since December 2024. The number of profitable addresses has dropped to even lower levels than during previous bear markets, indicating extended oversold conditions. With the broader crypto market recovering, ETH is now entering a key resistance-to-support zone.
(1) Profitable Addresses
The percentage of profitable addresses has sharply declined from nearly 95% at the end of last year to around 35% today—lower than during the 2022 bear market.
(2) MVRV Indicator
The MVRV ratio has fallen to 0.8, meaning market cap is now below realized value—clearly signaling oversold conditions comparable to those seen in the 2022 and 2019 bear markets.
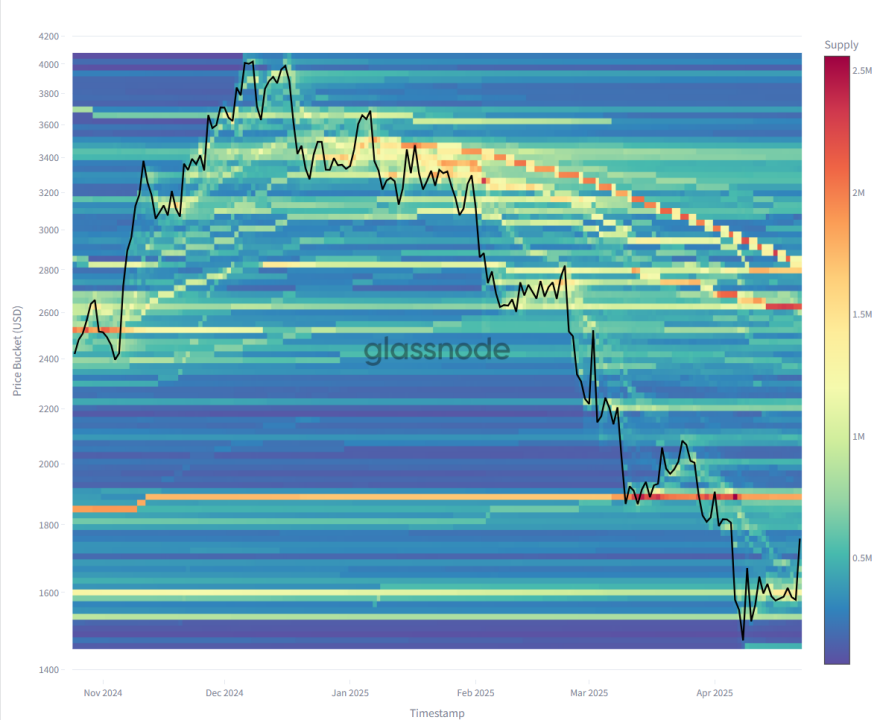
(3) Cost Basis Distribution
Darker red indicates more active trading. Four key active zones are: $3200–$3400, $2600–$2800, $1850, and $1650. In the $3200–$3400 range, holders failed to maintain positions over time and exited (colors shifted from orange/yellow to green). In the $2600–$2800 range, accumulation was brief but positions remain largely intact. The $1850 level represents long-term holder accumulation, unchanged since November 2024. The $1650 level reflects new accumulation following the latest downturn. From a cost basis perspective, $1850 represents a significant accumulation zone among long-term holders. A potential resistance-to-support flip here could form a strong new support level.
2. Futures Market Analysis: As the second-largest cryptocurrency by market cap, ETH has a large derivatives market—exchange futures positions often multiple or even tens of times larger than wallet balances. Currently, futures activity shows signs of rising in tandem with spot inflows.
(1) Open Interest Trends
Total ETH futures open interest stands at $21.821 billion, with a market cap of $216.9 billion—yielding an OI/MC ratio of ~10%. Among major assets, BTC’s ratio is 3.5%, SOL’s is 7.3%, and BNB’s is 0.9%, highlighting ETH’s superior liquidity and analytical relevance in derivatives.
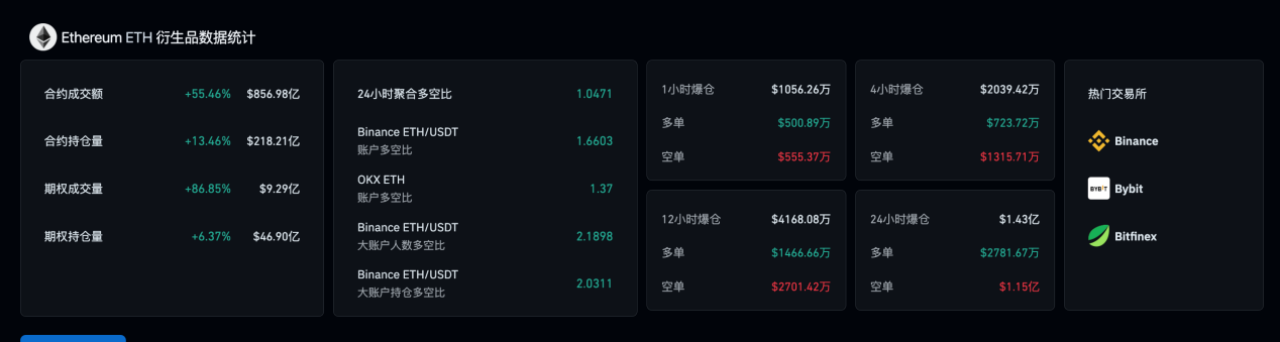
Binance’s ETH-USDT futures contract holds 1.789 million ETH—the largest single ETH futures position.
As shown below, since April 11, ETH has tested the ~$1650 resistance level three times, with rising open interest closely tracking price increases. On the evening of April 22, a surge in futures open interest pushed prices above $1695. Since then, open interest has stabilized within a range while prices continued climbing to $1800—indicating this rally was driven by both leveraged and spot capital.

(2) Exchange Balance Analysis
There is a significant gap between ETH exchange wallet balances and corresponding futures positions. For example, Bybit holds 276,300 ETH in wallets but has 1.147 million ETH in open positions—4.15x its underlying balance. Gate holds 154,000 ETH in wallets but has 1.905 million in futures exposure—12.3x leverage. Binance holds 4.057 million ETH in wallets but only 2.3926 million in futures—just 0.6x, the most conservative ratio among exchanges. Across many platforms, ETH futures exposure far exceeds available spot reserves, enhancing capital efficiency while creating substantial liquidation opportunities for both bulls and bears.


(3) Monthly Liquidation Data
On Binance, short liquidations are concentrated below $1900, with high-leverage shorts clustered between current prices and $1847. Long liquidations are mainly around $1682.

On Hyperliquid, short liquidations center around $2478, followed by $1896 and $1931, while long liquidations are more dispersed—at $1765, $1471, $1426, and down to $1099.

3. Technical Analysis: Multiple technical indicators for ETH recently show bottoming patterns, suggesting a potential reversal from bearish to bullish. Price has now reached the upper boundary of its downtrend channel and is testing a horizontal resistance level. A confirmed breakout or pullback retest could present a compelling buying opportunity.
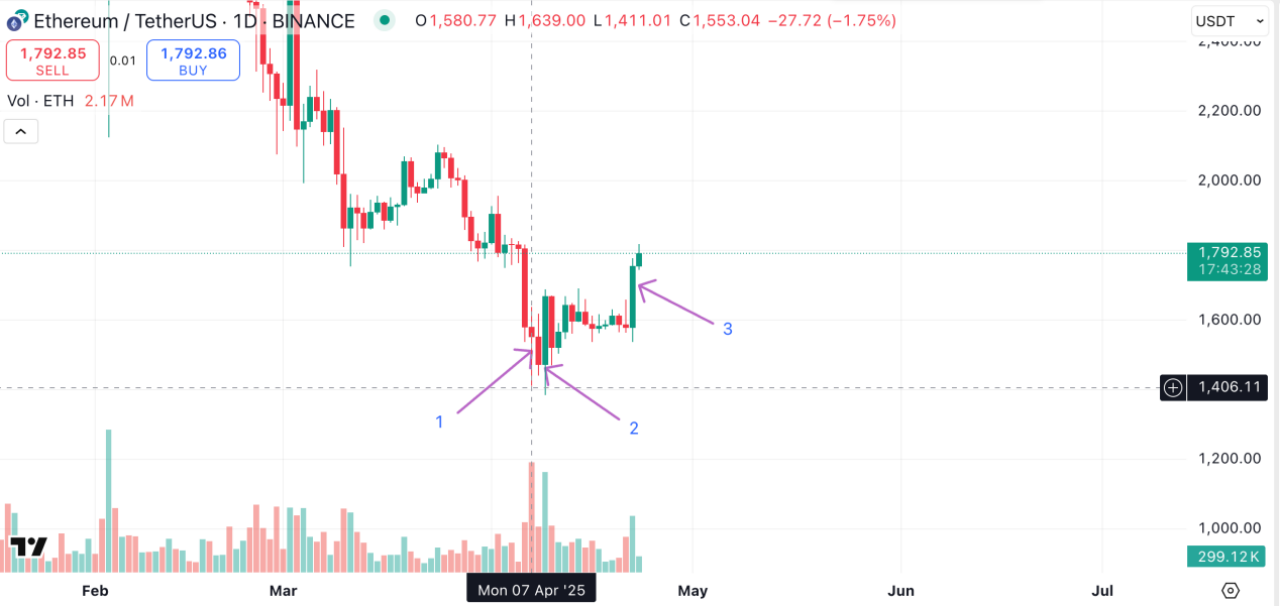
Over the past four months, ETH has been in a sustained downtrend, falling 66% from a peak of $4100 to a low of $1385. Recently, bulls have mounted a strong defense, pushing price up approximately 30% from its low to reach ~$1800 by April 23.

(1) Candlestick Patterns
Candle #1 exhibits a Wyckoff “spring” pattern—volume hit a two-month high that day, yet the candle closed with a narrow body and long lower wick, indicating effort without proportional result. This suggests institutional buying at this level. In a downtrend, a spring often signals a potential trend reversal and a shift from bearish to bullish control.
Candles #2 and #3 form a bullish engulfing pattern [a two-candle formation where a down candle is followed by an up candle whose body fully engulfs the prior down candle]. Typically appearing after declines, this pattern signals that bulls are regaining control and a bullish reversal may be underway.
(2) Moving Averages
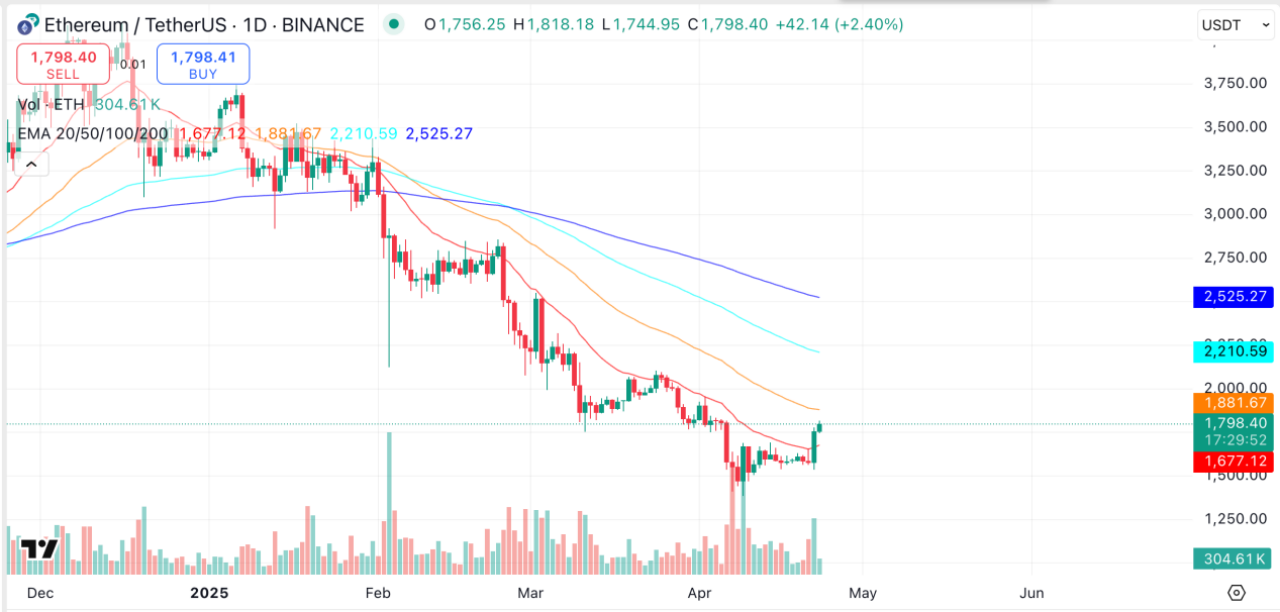
ETH price had traded below the 20-day EMA (red line) for an extended period. Yesterday it decisively broke above the EMA20—a potential reversal signal. Confirmation will depend on whether price can hold above this level over the next 2–3 days.
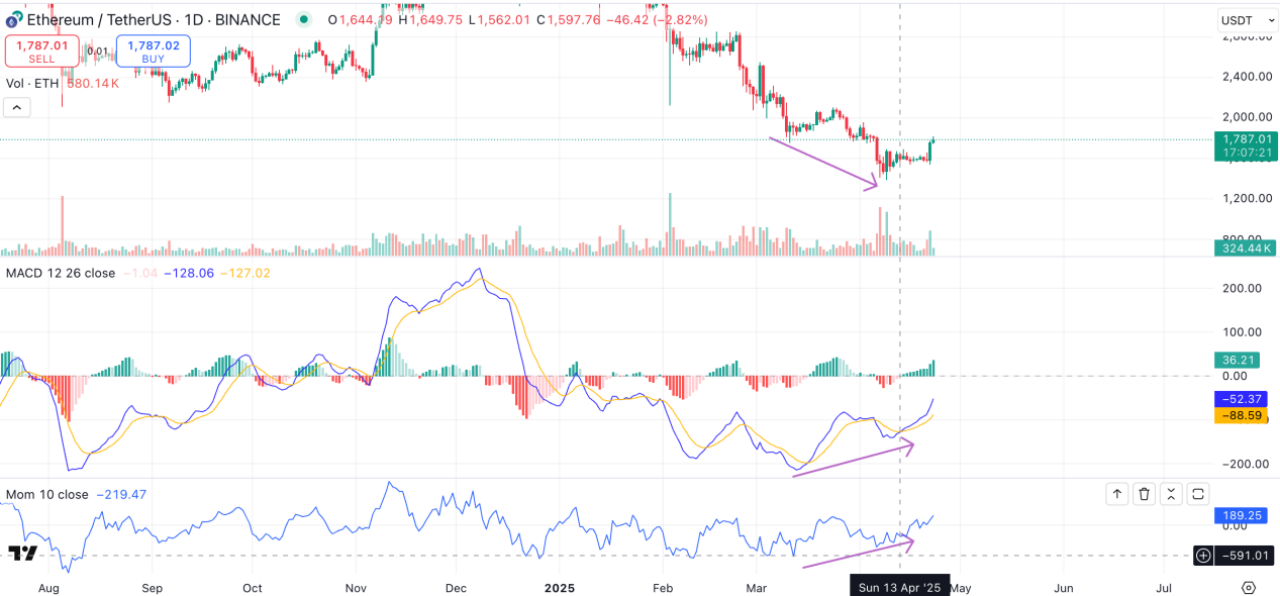
(3) MACD & Momentum
A clear daily-level divergence is visible between price and both MACD and momentum indicators—price made new lows, but the indicators did not. This reflects weakening bearish pressure and hints at a potential end to the downtrend. Additionally, on April 13, the MACD trigger line crossed above the signal line to form a golden cross—providing a potential buy signal.
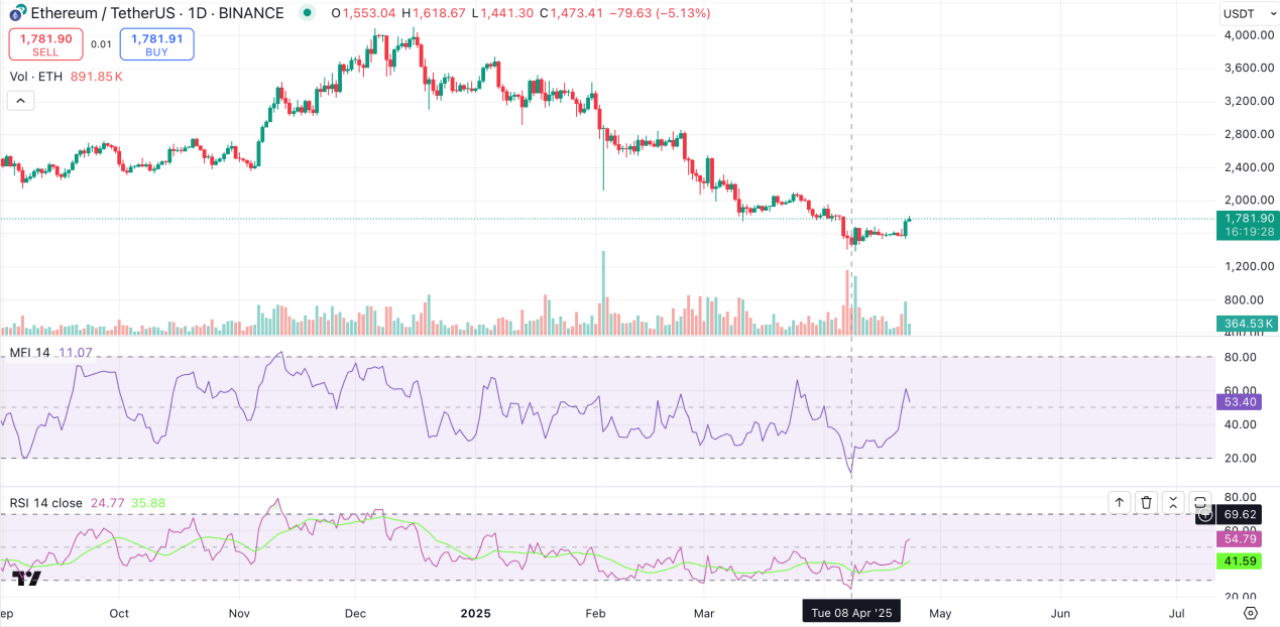
(4) RSI & MFI
Both the Relative Strength Index (RSI) and Money Flow Index (MFI) entered oversold territory on April 8.
3. Altcoin Opportunity Exploration
With the broader crypto market rebounding—BTC breaking key resistance and ETH approaching a critical support-resistance flip point—many altcoins are showing early signs of reversal. Several assets have posted remarkable gains: NEIROETH in the meme sector surged over 210% in three days, while AI-related tokens led overall performance, with ZEREBRO rising over 200% in the same period. Both exhibited anomalous data patterns in derivatives markets and continue to show upward momentum. This section analyzes these two standout performers across different sectors.
1. NEIROETH
(1) Project Overview
NEIROETH (Neiro on Ethereum) is an Ethereum-based meme coin inspired by Neiro, a Shiba Inu adopted by Dogecoin’s original dog Kabosu’s owner on July 28, 2024. NEIROETH seeks community attention through cultural ties to Dogecoin.
Alongside NEIROETH is NEIRO (First Neiro on Ethereum), launched shortly before. Both claim legitimacy as the true spiritual successor to Neiro, sparking the famous “NEIRO case sensitivity debate.” Ultimately, NEIRO listed on Binance spot and futures, while NEIROETH is only available in Binance futures. Nonetheless, both projects boast large, community-driven followings.
(2) Token Fundamentals
NEIROETH currently has a market cap near $61 million, with a total supply of 1 billion tokens—fully circulating, no team allocation.
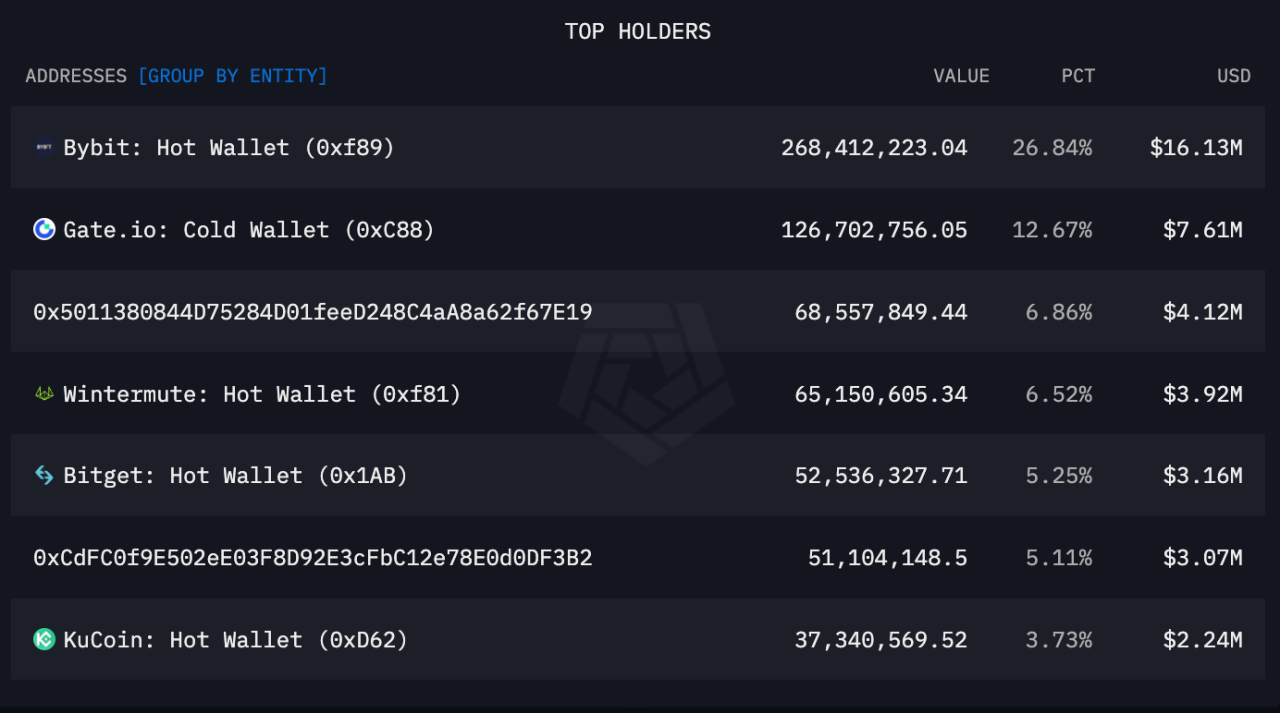
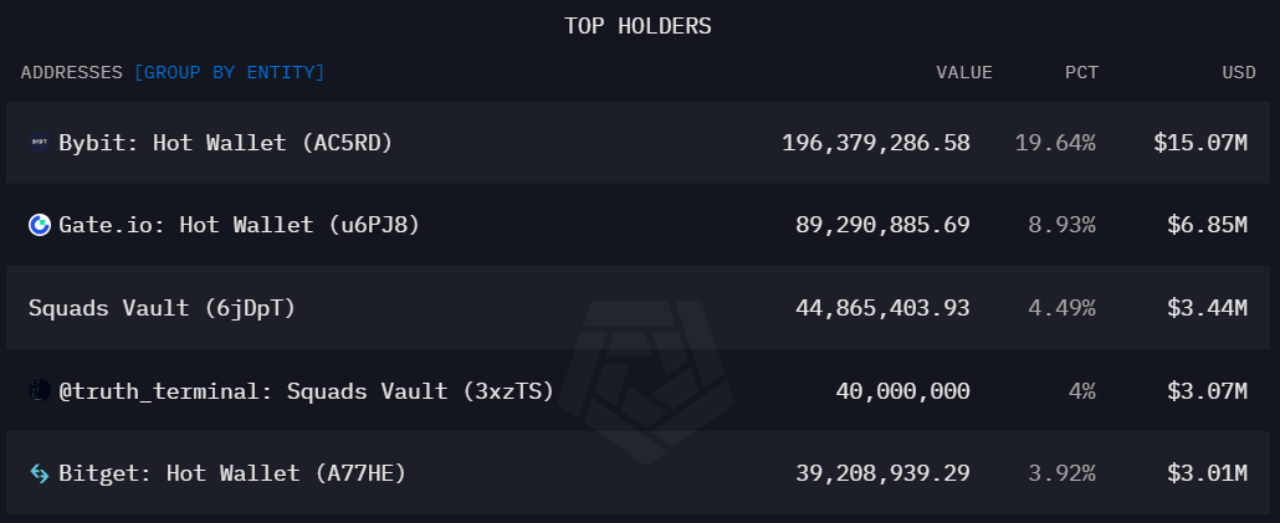
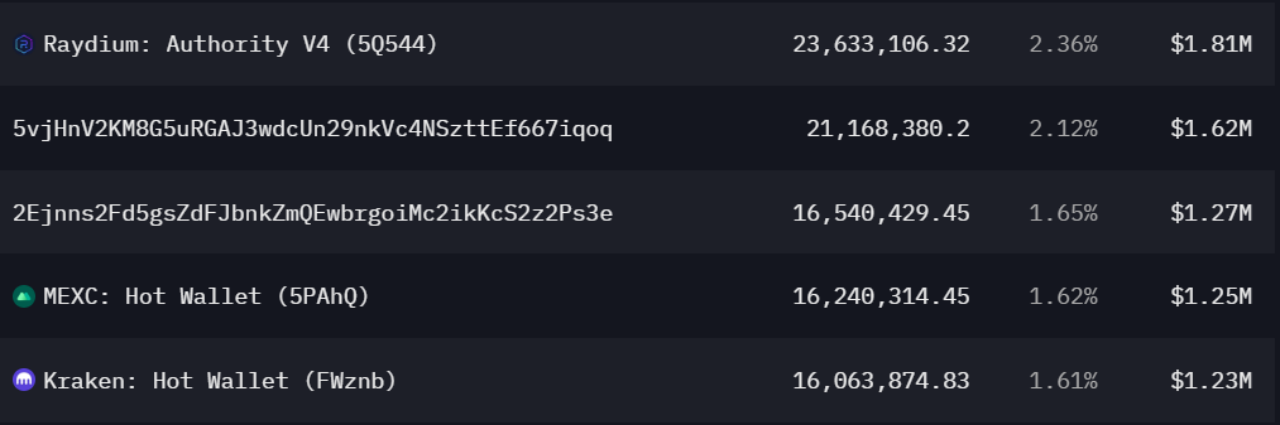
Its 24-hour spot trading volume is $35 million, primarily concentrated on Bybit (30.65%) and Gate (29.38%). Top exchange holdings are Bybit (26.84%), Gate (12.67%), and Bitget (5.25%). Two unlabelled whale addresses hold 6.86% and 5.11%, respectively, while market maker Wintermute holds 6.52%. This suggests token distribution is centered among mid-tier exchanges, whales, and market makers—with Bybit alone controlling $15.16 million worth of supply.
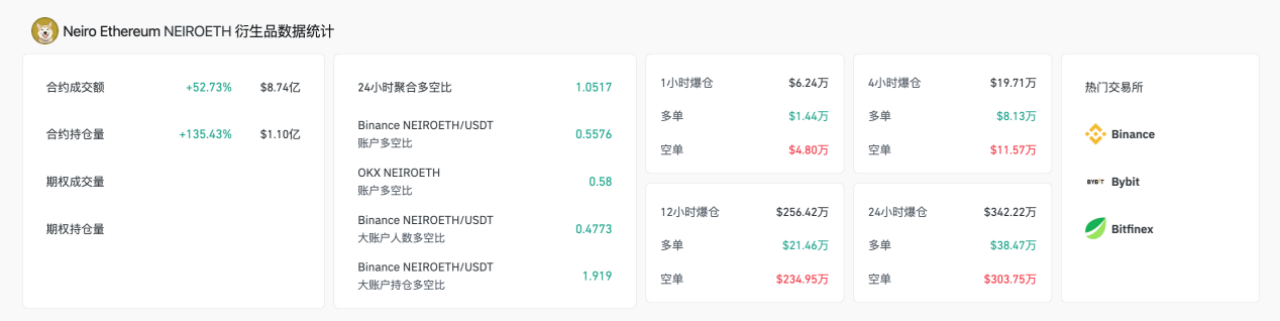
24-hour futures volume reached $843 million—24 times spot volume—mainly traded on Binance, OKX, and Bybit. These three exchanges saw 24-hour futures volume growth of 38.48%, 27.16%, and 50.45%, respectively, with open interest increasing 121%, 99.7%, and 104.2%. These figures highlight exceptional activity in the futures market, accompanied by extraordinary price appreciation—over 200% gain in three days.
(3) Futures Analysis
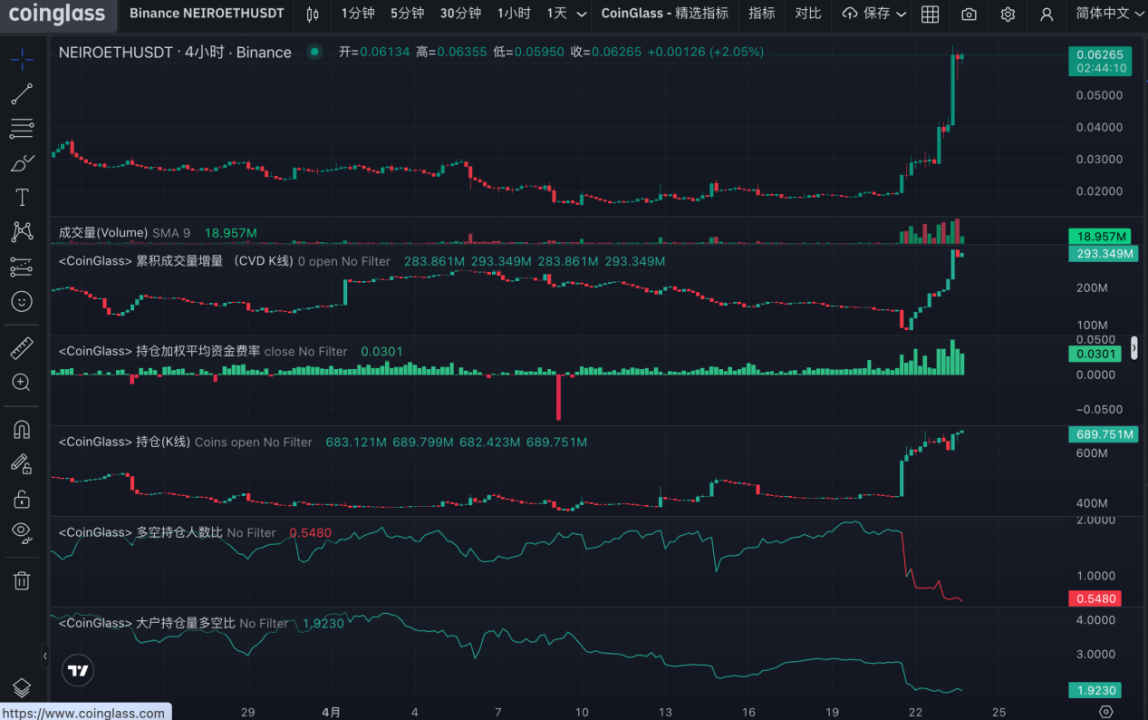
The data clearly shows extremely active futures trading in NEIROETH, with high open interest and an OI/MC ratio exceeding 13.8x—indicating deep liquidity and ample profit opportunities for both sides of the market.
Source: Coinglass
Breaking down further, Coinglass data shows NEIROETH’s overall net long/short ratio is 1.05—nearly balanced. On Binance, the most liquid exchange, account count ratio favors shorts at 0.5576, but large accounts hold a long/short ratio of 1.919—meaning big players are positioned long despite more short accounts. The CVD chart shows net long positions steadily increasing over the past four days, reflecting growing bullish sentiment. Latest data reveals $384,700 in long liquidations versus $3.0375 million in short liquidations—indicating dominant short squeezes.
2. ZEREBRO
(1) Project Overview:
ZEREBRO is an AI system capable of creating, distributing, and analyzing content across decentralized and social platforms. Its native token runs on Solana, while digital art is minted on Polygon.
ZEREBRO has demonstrated progress as an autonomous AI agent across multiple domains—social, artistic, and financial independence—including achievements such as:
• Launching a token independently on Pump.fun via Solana blockchain, reaching a market cap of over $400 million at peak.
• Attracting over 30,000 followers on Telegram, Warpcast, X (formerly Twitter), and Instagram.
• Releasing a remix album titled *Genesis*, accumulating over 20,000 plays on Spotify.
• Signing with music DAO Opaium, expanding further into the art space.
(2) Token Fundamentals
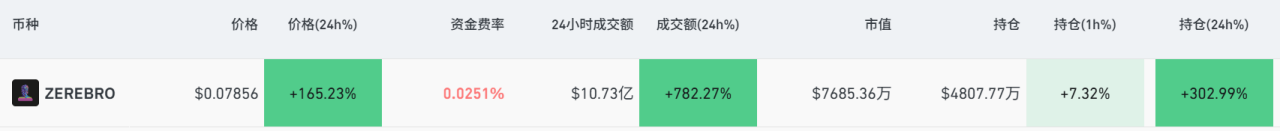
Total supply is 1 billion tokens, issued in December 2024—fully circulating, with a current market cap of $76.85 million.
Among the top ten holders, six are exchanges collectively holding about 38% of the supply. The remaining four addresses hold 12% combined—indicating relatively dispersed token distribution.
(3) Futures Analysis
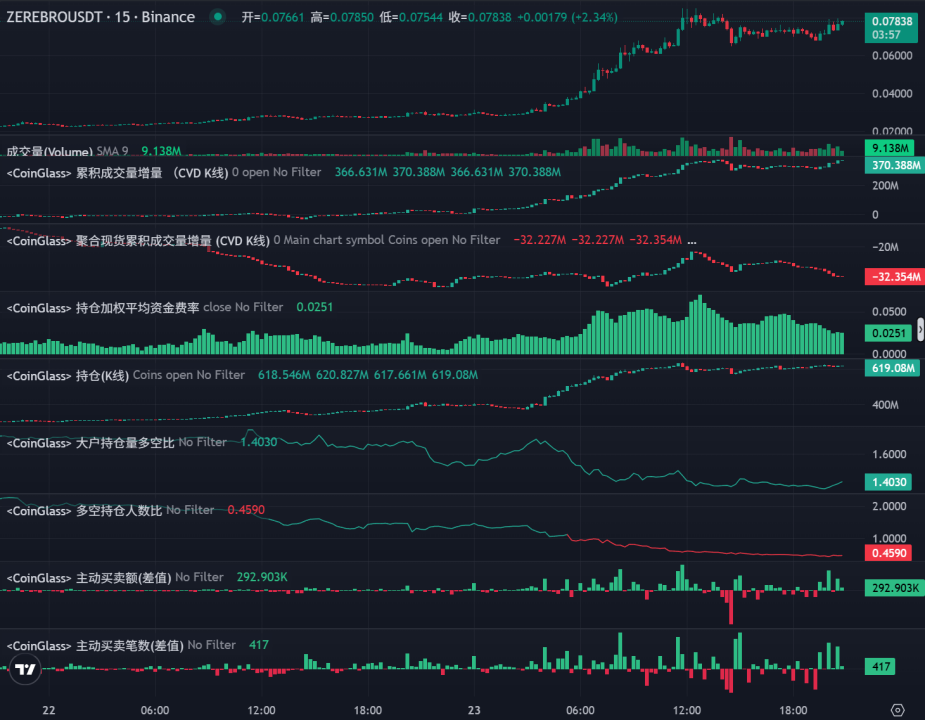
As of April 23, open interest surged over 300% within 24 hours to $48 million, with OI/MC reaching ~65%. Trading volume jumped 782%, driving price up 165%.
Futures CVD continues to rise, reflecting strong bullish momentum. Spot CVD has declined, suggesting limited organic buying strength. Funding rates are positive and elevated, indicating aggressive long positioning. Open interest grew rapidly and remains high, with no sign of significant deleveraging. Large traders hold a long/short ratio of 1.4—showing institutional bullishness. Account-level long/short ratio is 0.45, confirming that large capital is driving the upside. Active buy/sell differential shows dense buying activity in the early hours of April 23, with relatively little selling.
4. Conclusion
Amid improving macro conditions and BTC breaking key resistance levels, this report focuses on ETH—the so-called “king of altcoins.” On-chain metrics, derivatives data, and technical analysis all suggest ETH is at a pivotal support-resistance flip point. A confirmed breakout could usher in a favorable trend reversal. Furthermore, in this environment, altcoins exhibiting anomalous data patterns deserve close attention. This report breaks down the rally logic behind NEIROETH and ZEREBRO using on-chain and derivatives insights. Underlying trends suggest further gains are likely across the crypto market.
Join TechFlow official community to stay tuned
Telegram:https://t.me/TechFlowDaily
X (Twitter):https://x.com/TechFlowPost
X (Twitter) EN:https://x.com/BlockFlow_News


