Bitcoin Halving One Year Later: Why This Cycle Looks Very Different?
TechFlow Selected TechFlow Selected
Bitcoin Halving One Year Later: Why This Cycle Looks Very Different?
BTC may be entering a new era characterized not by parabolic peaks, but by more institutionally driven, incremental growth.
Author: beincrypto
Translation: Blockchain Knight
It has been one year since BTC's most recent halving, and this cycle is unfolding in a way markedly different from previous ones. Unlike prior cycles where explosive rallies followed the halving event, BTC’s current gain stands at a modest 31%, compared to a 436% rise during the same period in the previous cycle.
At the same time, long-term holder metrics—such as the MVRV ratio—show a sharp decline in unrealized profit, indicating market maturation and compressed upside potential. Taken together, these shifts suggest that BTC may be entering a new era characterized not by parabolic peaks, but by more gradual, institutionally driven growth.
A Year After the BTC Halving: A Different Cycle
The development of this BTC cycle clearly diverges from past cycles, potentially signaling a shift in how the market reacts to the halving event.
In earlier cycles—particularly from 2012 to 2016 and from 2016 to 2020—BTC typically experienced strong upward momentum at this stage. The post-halving periods were often marked by powerful bullish momentum and parabolic price movements, primarily fueled by retail enthusiasm and speculative demand.
However, the current cycle has taken a different path. Instead of accelerating after the halving, prices began surging well ahead of time, in October and December 2024, followed by consolidation in January 2025 and a pullback in late February.
This early rally behavior contrasts sharply with historical patterns, where the halving usually acted as a catalyst for significant price increases.
Multiple factors are behind this shift. BTC is no longer merely a retail-driven speculative asset; it is increasingly viewed as a mature financial instrument. Growing institutional participation, combined with macroeconomic pressures and changes in market structure, has led to a more cautious and complex market response.
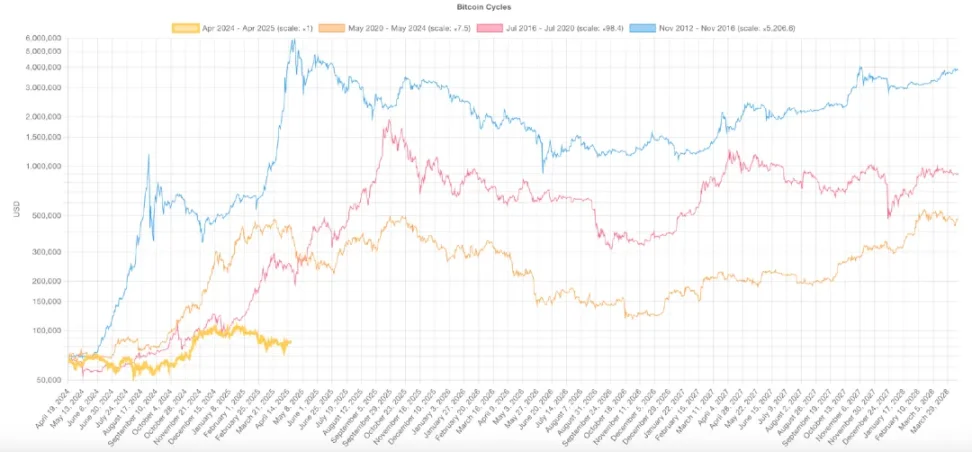
BTC cycle comparison. Source: Bitcoin Cycles Comparison
Another clear sign of this evolution is the diminishing intensity observed in each successive cycle. As BTC’s market cap grows, replicating the explosive gains of earlier years becomes increasingly difficult. For example, during the 2020–2024 cycle, BTC rose 436% within a year following the halving.
In contrast, this cycle has seen only a 31% increase over the same timeframe—a significantly milder performance.
This shift could indicate that BTC is entering a new chapter defined by lower volatility and more stable long-term growth. The halving may no longer be the primary driver; other factors such as interest rates, liquidity, and institutional capital flows are playing a larger role.
The rules of the game are changing, and so is BTC’s trajectory.
That said, it's worth noting that previous cycles also featured consolidation and correction phases before resuming their upward trends. While this phase may feel slow or uneventful, it could still represent a healthy adjustment ahead of the next leg up.
Moreover, this cycle may continue to deviate from historical patterns. Instead of ending in a dramatic top and bubble burst, it might evolve into a more sustained and structurally sound uptrend—one driven more by fundamentals than hype.
Long-Term Holder MVRV Ratio Reveals a Maturing BTC Market
The Long-Term Holder (LTH) Market Value to Realized Value (MVRV) ratio has long served as a reliable gauge of unrealized profit. It reflects the level of paper gains accumulated by long-term investors before they begin selling. Over time, however, this metric has been trending downward.
In the 2016–2020 cycle, the LTH MVRV ratio peaked at 35.8, signaling massive unrealized profits and an imminent market top. By the 2020–2024 cycle, this peak had dropped sharply to 12.2—even though BTC reached new all-time highs.
In the current cycle, the highest LTH MVRV reading so far is just 4.35, representing a dramatic decline. This indicates that long-term holders have realized far smaller gains compared to previous cycles, despite significant price appreciation. The trend is clear: profit multiples per cycle are decreasing.
BTC’s explosive upside potential is being compressed as the market matures.
To date, the peak LTH MVRV ratio in this cycle stands at 4.35. This substantial drop suggests that long-term holders are achieving much lower return multiples than in past cycles, even amid notable price gains. This pattern points to a clear conclusion: BTC’s upside room is shrinking.
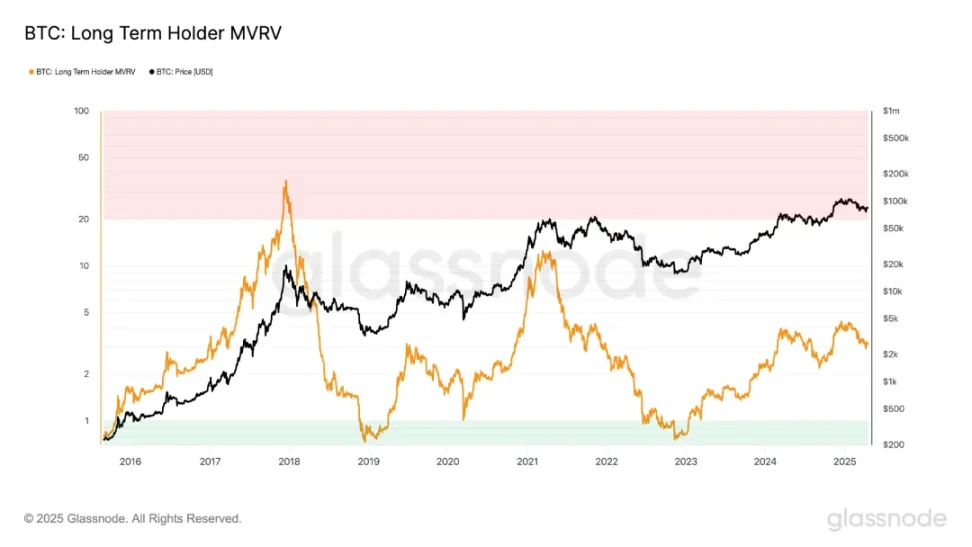
BTC Long-Term Holder MVRV. Source: Glassnode
This is no coincidence. As the market matures, achieving explosive returns naturally becomes harder. The era of extreme, cycle-driven profit multiples may be fading, giving way to more moderate and sustainable growth.
An expanding market size means exponentially more capital is required to move prices meaningfully higher.
That said, this does not confirm the cycle has already peaked. Previous cycles typically included extended consolidation or mild correction phases before reaching new highs.
With institutional investors playing an increasingly central role, accumulation phases may last longer. As a result, profit-taking at peak valuations may unfold more gradually than in earlier cycles.
Nevertheless, if the trend of declining peak MVRV ratios continues, it would reinforce the view that BTC is transitioning from erratic, cyclical surges to a more measured and structurally grounded growth model.
The most explosive gains may already be behind us—especially for investors entering the market in the later stages of this cycle.
Join TechFlow official community to stay tuned
Telegram:https://t.me/TechFlowDaily
X (Twitter):https://x.com/TechFlowPost
X (Twitter) EN:https://x.com/BlockFlow_News