The Final Kick: Testing the Correlation Between Global Macro Liquidity and BTC Price Movements
TechFlow Selected TechFlow Selected
The Final Kick: Testing the Correlation Between Global Macro Liquidity and BTC Price Movements
BTC plays a contradictory role in the transmission chain of macro liquidity into the crypto market.
By Liu Jiaolian
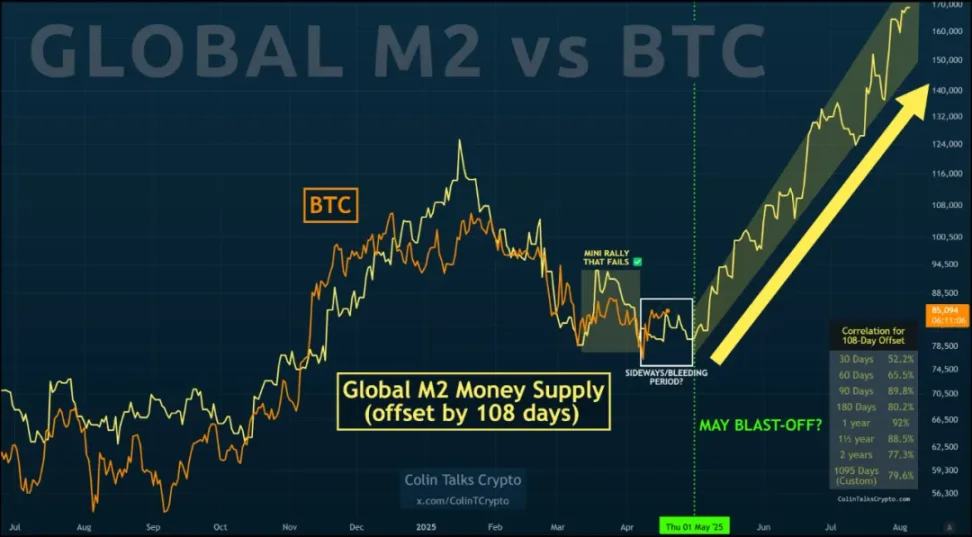
The chart below illustrates the correlation between global money supply (M2) and BTC price, a relationship that Jiaolian has previously highlighted in multiple internal reports. It shows that when the global macro liquidity (M2) is shifted backward by 108 days, it aligns remarkably well with BTC’s price movement. What underlying logic might explain this intriguing synchronization?
The core logic of the model lies in understanding how global macro liquidity is transmitted to BTC.
Global M2 serves as a proxy for the total amount of money printed by central banks worldwide, reflecting the overall level of liquidity in financial markets. When central banks engage in large-scale monetary expansion (such as the global flood of liquidity following the 2020 pandemic), this newly created money does not immediately flow into the BTC market. The 108-day lag built into the chart attempts to capture the time delay between central bank "money printing" and its eventual transmission into the crypto market.
Data shows that the longer the observation period, the stronger the correlation becomes: the 30-day correlation coefficient stands at only 52%, while over a three-year horizon, it rises to 79.6%. This suggests that BTC’s price response to monetary easing is not immediate but rather reflects a medium- to long-term resonance. As liquidity remains abundant over time, portions of capital gradually migrate into high-risk assets like BTC—but this process requires time for investor confidence to recover and for new capital channels to form.
When the yellow arrow on the right side of the chart points toward a “potential breakout,” the implied logic is this: if global M2 continues to expand (for example, due to sustained monetary easing by the Bank of Japan or the Federal Reserve pausing rate hikes), then based on the 108-day transmission cycle, BTC could see a fresh wave of capital-driven appreciation around May 2025. This timing coincides precisely with the inflection point identified by Jiaolian in the February 14, 2025 article titled *Breaking Free from the Cocoon*.
However, the model also reveals clear limitations. The failed rally in early 2023 demonstrates that money supply alone cannot fully account for short-term price movements. At that time, although global M2 was still rising, the U.S. banking crisis caused capital to temporarily flee into traditional safe-haven assets. As an emerging asset class, BTC instead suffered from a liquidity drain—a reminder that macro liquidity is a necessary, but not sufficient, condition for driving cryptocurrency prices.
Clearly, the current scale of the crypto market remains tiny compared to the size of global liquidity pools.
BTC plays a paradoxical role in the transmission chain from macro liquidity to digital assets. On one hand, its fixed supply makes it an inflation hedge in the eyes of some investors—when expectations of fiat devaluation rise, capital may accelerate into BTC. On the other hand, BTC is still classified as a high-risk asset. During periods of acute liquidity stress—such as the initial outbreak of the pandemic in March 2020—investors tend to sell BTC first to secure U.S. dollars, causing it to fall in tandem with other risk assets.
This dual nature results in a nonlinear relationship between BTC and M2. The 79.6% correlation observed over the past three years has actually emerged through repeated episodes of “divergence followed by re-convergence.” For instance, during the 2021 crackdown on mining operations, policy shocks briefly disrupted the transmission mechanism of monetary easing. Yet after the market absorbed the negative impact, prices realigned with the M2 trend line. This indicates that while the model's foundational logic holds resilience, the actual transmission path can be distorted by exogenous factors such as geopolitical developments and regulatory shifts.
For ordinary investors, the value of this model does not lie in predicting exact price moves, but in building a macro-level cognitive framework. When major economies collectively shift toward loose monetary policies (e.g., interest rate cuts or quantitative easing), this can be interpreted as a favorable backdrop signal for BTC over the medium to long term. Conversely, when central banks tighten policy, caution is warranted regarding downward pressure from shrinking liquidity. The high correlation over the 1095-day (approximately three-year) window suggests that adopting a three-year or longer time horizon may offer more meaningful insights than chasing short-term volatility.
At the same time, we must guard against mistaking correlation for causation. BTC’s price is also influenced by halving cycles, blockchain technological advancements, institutional adoption, and other factors. For example, the 2024 BTC halving event could combine with growing global M2 to create a double tailwind—but it might also be offset by adverse regulatory changes. Therefore, this model should be seen as just one piece of the analytical puzzle, not a standalone basis for investment decisions.
Extending our thinking from this chart, we may gain a clearer view of BTC’s place within today’s financial system: it is both a product of global monetary overexpansion and a challenger to traditional financial order. The 108-day lag fundamentally reflects the efficiency—and resistance—involved in capital migrating from traditional markets to the crypto world. As mainstream financial institutions begin incorporating BTC into their portfolios, this transmission cycle may shorten further. But when black swan events strike, the lag could passively extend. Understanding this dynamic equilibrium may prove far more valuable than merely tracking price fluctuations.
Join TechFlow official community to stay tuned
Telegram:https://t.me/TechFlowDaily
X (Twitter):https://x.com/TechFlowPost
X (Twitter) EN:https://x.com/BlockFlow_News