Glassnode Weekly on-chain report: Macro environment remains uncertain, losses mostly among new investors
TechFlow Selected TechFlow Selected
Glassnode Weekly on-chain report: Macro environment remains uncertain, losses mostly among new investors
Long-term holders are generally profitable, while those incurring losses are mostly new market participants.
 Navigating Web3 tides with focused insights
Author: Glassnode
Translation: Felix, PANews
Key Takeaways
-
The macroeconomic environment remains uncertain as global trade relationships undergo restructuring. This uncertainty has amplified volatility in U.S. Treasuries and equities.
-
In a challenging economic backdrop, Bitcoin experienced its largest drawdown of the current cycle. Nevertheless, the magnitude remains within the range of prior bull market corrections. Moreover, the median decline of this cycle is still an order of magnitude smaller than previous bull markets, highlighting more resilient demand.
-
Liquidity across the digital asset ecosystem continues to tighten, reflected in declining capital inflows and stagnant stablecoin growth.
-
Investors are under significant pressure, currently facing the largest unrealized loss in history. However, most of these losses are concentrated among newer market participants, while long-term holders remain largely in profit.
Macroeconomic Uncertainty Remains Widespread
As the Trump administration attempts to disrupt and restructure global trade relations, macroeconomic uncertainty has become increasingly pronounced. Currently, U.S. Treasuries serve as collateral and foundation for the financial system, with the 10-year Treasury yield regarded as the benchmark risk-free rate.
A key government objective is to reduce the 10-year Treasury yield, which saw initial success in the first months of the year as broad market sell-offs drove yields down to 3.7%. However, this relief was short-lived, with yields subsequently surging to 4.5%, erasing earlier declines and causing significant turmoil in the bond market.
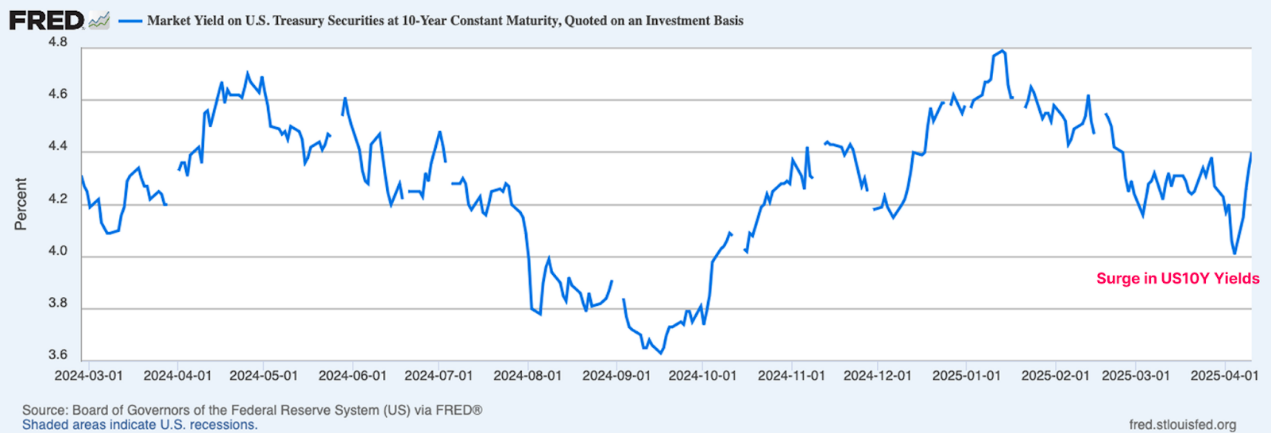
Source: FRED
The MOVE index can be used to quantify disorderly behavior in the bond market. This key metric measures stress and volatility in the bond market, derived from the 30-day implied volatility of options on U.S. Treasuries across various maturities.
By this measure, volatility in U.S. Treasuries has surged dramatically, underscoring extreme uncertainty and panic among bond market investors.
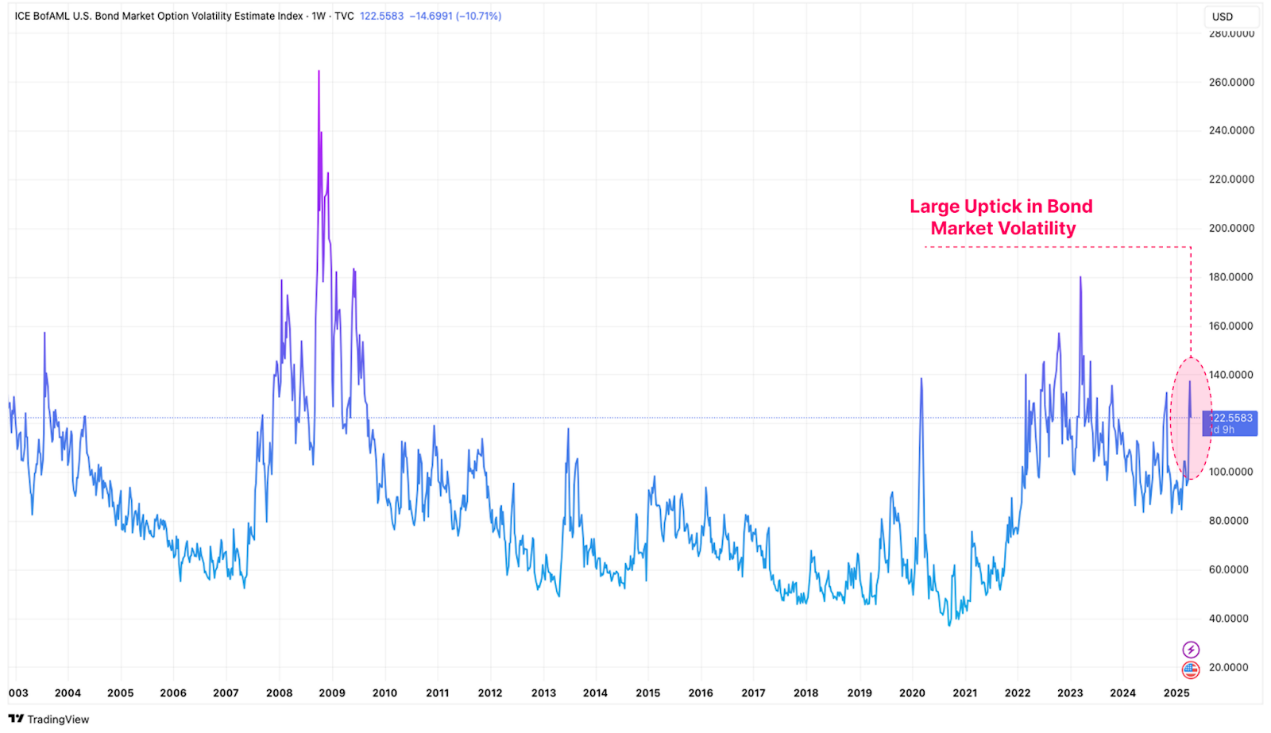
Source: Tradingview
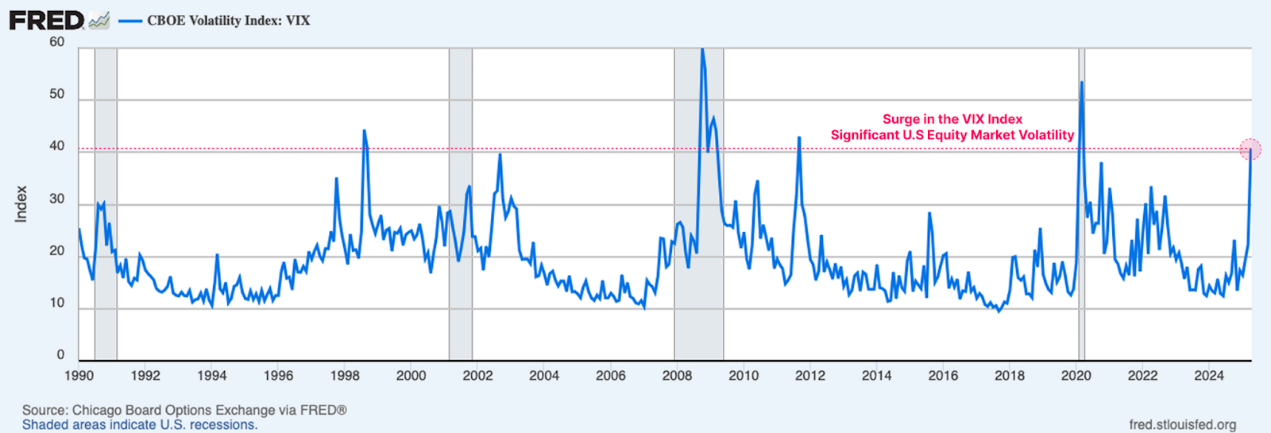
In addition, the Volatility Index (VIX) measures turbulence in the U.S. stock market, reflecting expectations for 30-day volatility in U.S. equities. Bond market volatility is also clearly mirrored in equity markets—current VIX levels resemble those seen during the 2020 pandemic crisis, the 2008 global financial crisis, and the 2001 dot-com bubble.
Volatility in foundational financial collateral often triggers investor capital withdrawals and tighter liquidity conditions. Given that Bitcoin and digital assets are among the most sensitive instruments to liquidity shifts, they have naturally been affected by increased volatility and risk-asset pullbacks.
Source: FRED
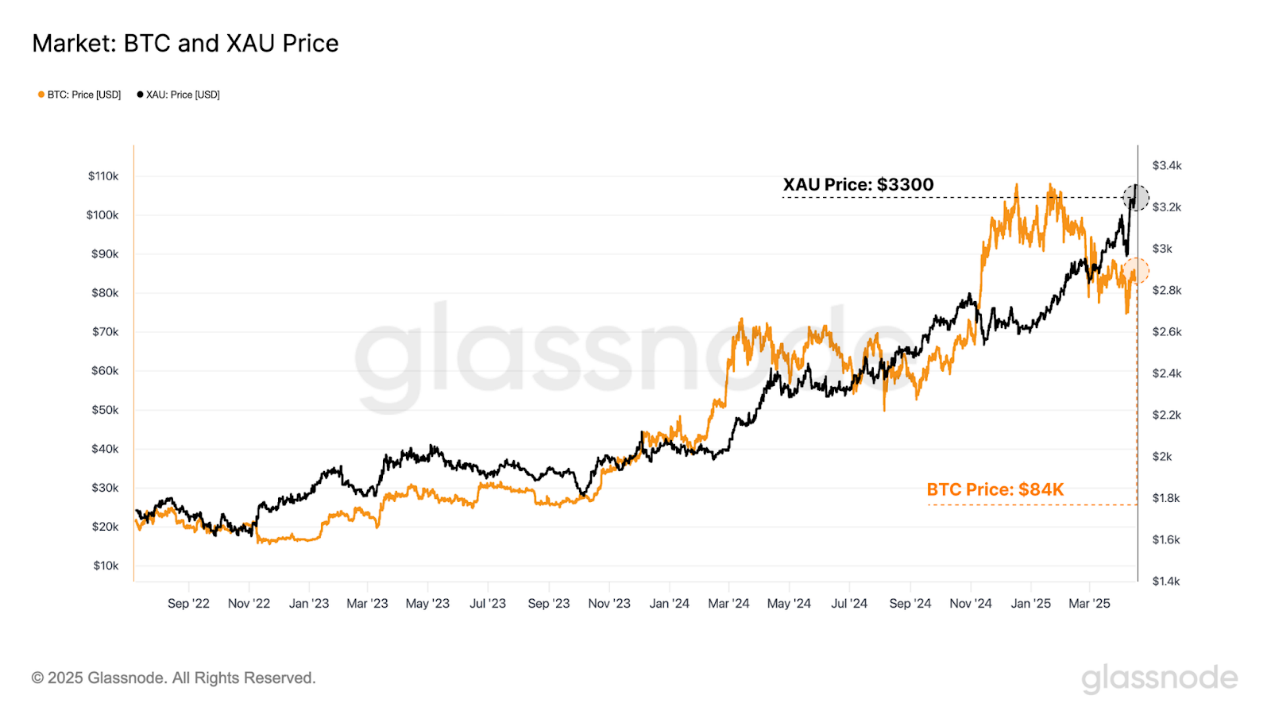
Amid this turmoil, performance of “hard” assets remains impressive. As investors flock to gold—a traditional safe-haven asset—prices have continued to surge, reaching a new high of $3,300. Bitcoin was initially sold off alongside risk assets to $75,000 but has since recovered part of its losses, trading back up to $85,000.
As the world adapts to evolving trade dynamics, gold and Bitcoin are increasingly emerging as focal points for globally neutral reserve assets. Indeed, the performance of gold and Bitcoin last week sent a compelling signal.
Source: Glassnode
Bitcoin Maintains Resilience
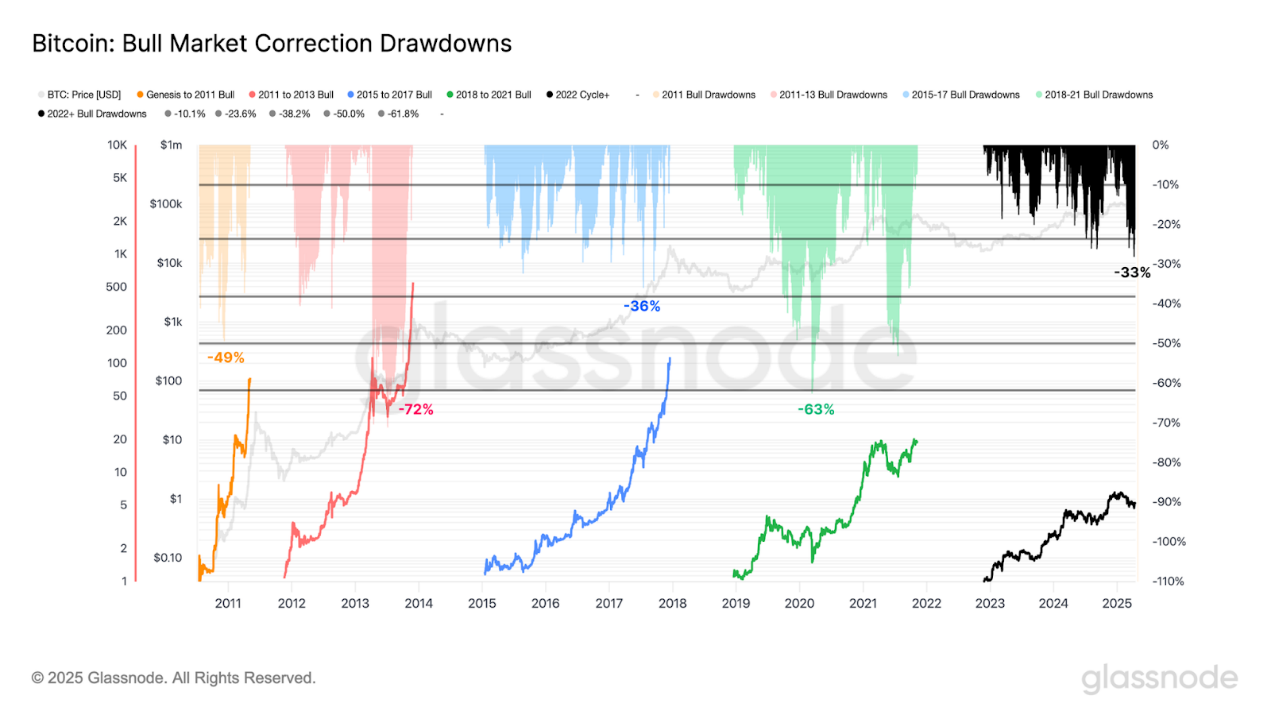
While Bitcoin continues to trade around the $85,000 level, its volatility and drawdowns have intensified over recent months. The asset recorded its largest decline of the 2023–2025 cycle, falling 33% from its all-time high.
However, the scale of this correction remains within the bounds of typical bull market pullbacks. In past macro-driven events like last week’s, Bitcoin often suffered declines exceeding 50%, highlighting the relatively robust sentiment among modern investors even in adverse conditions.
Source: Glassnode
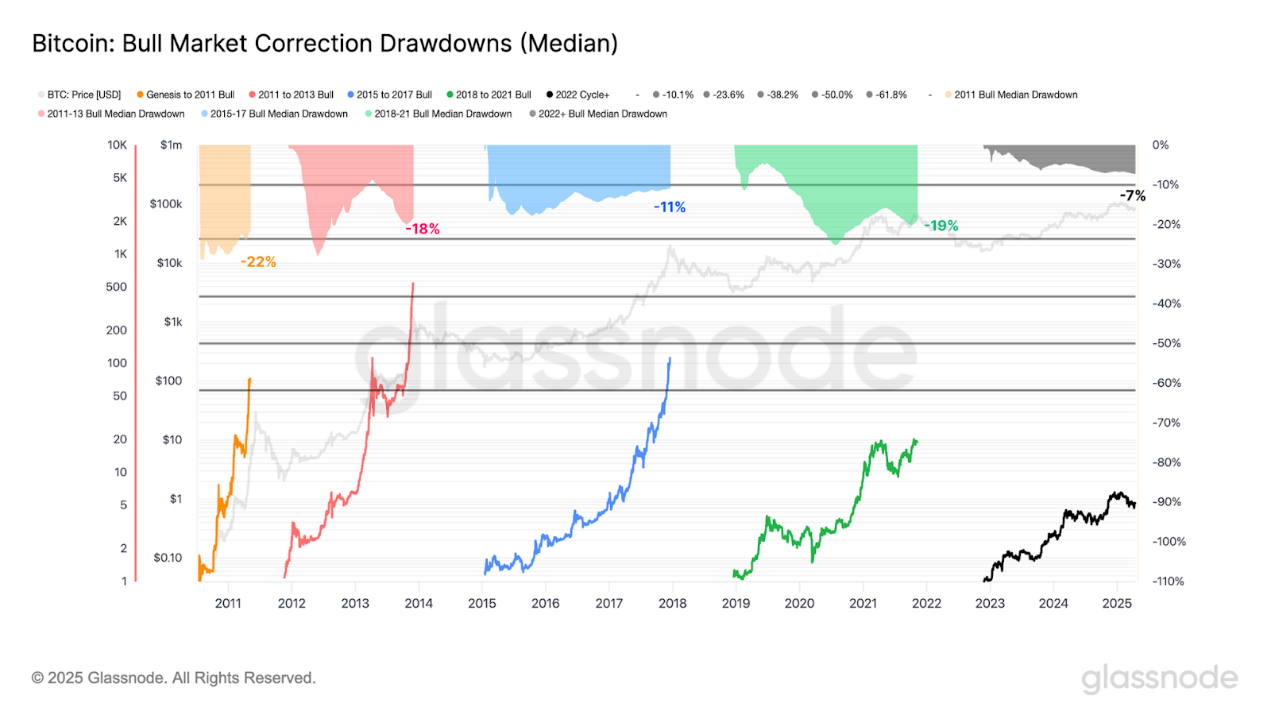
To quantify resilience in the current cycle, we can assess median drawdowns from previous bull markets:
-
2011: -22%
-
2011–2013: -18%
-
2015–2018: -11%
-
2018–2021: -19%
-
2022 and beyond: -7%
The median drawdown of the current cycle is smaller than in all prior instances. Since 2023, drawdowns have been even shallower and more contained, indicating more resilient demand and a greater willingness among investors to hold through market turbulence.
Source: Glassnode
Liquidity Continues to Contract
We can also examine how macro uncertainty impacts Bitcoin’s liquidity conditions.
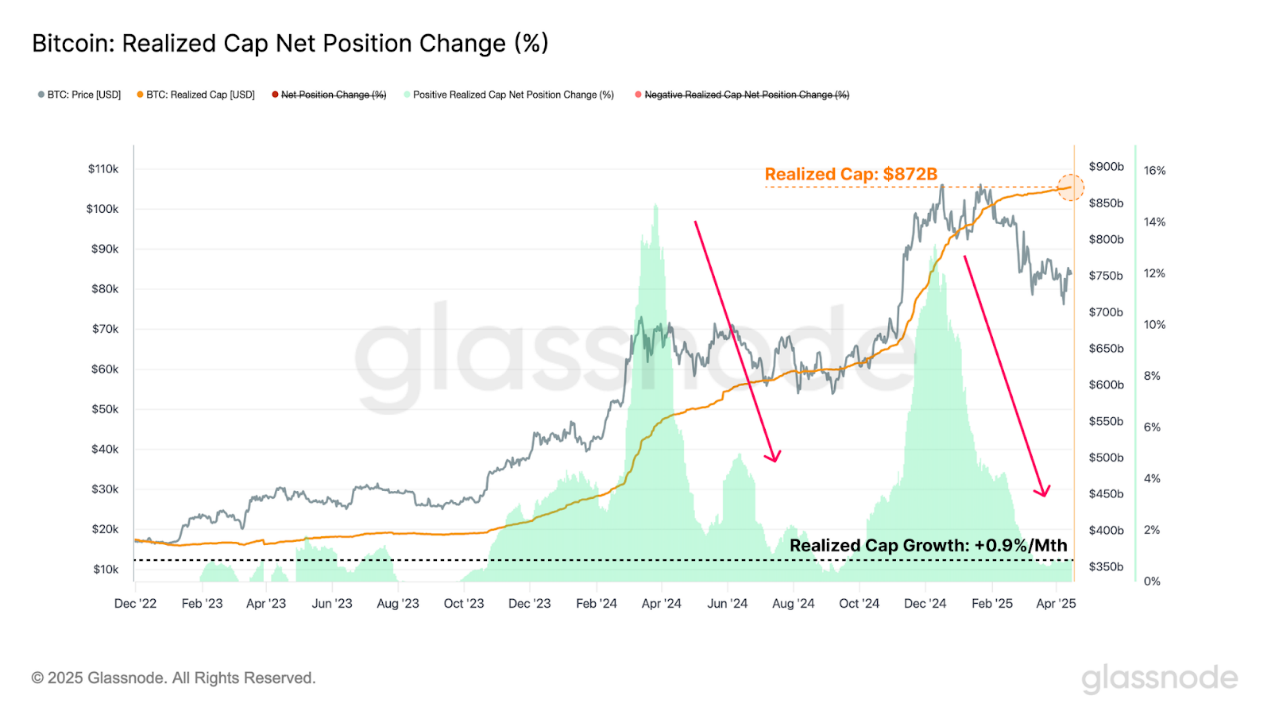
One way to measure internal Bitcoin liquidity is the Realized Market Cap indicator, which calculates the cumulative net capital inflow into digital assets. Realized Market Cap has reached an all-time high of $872 billion, yet the capital growth rate has contracted to just +0.9% per month.
Despite highly challenging market conditions, capital inflows into the asset remain positive. However, the slowing pace of new capital entering suggests lower investor appetite for allocating funds in the short term, with risk aversion likely prevailing as the dominant sentiment.
Source: Glassnode
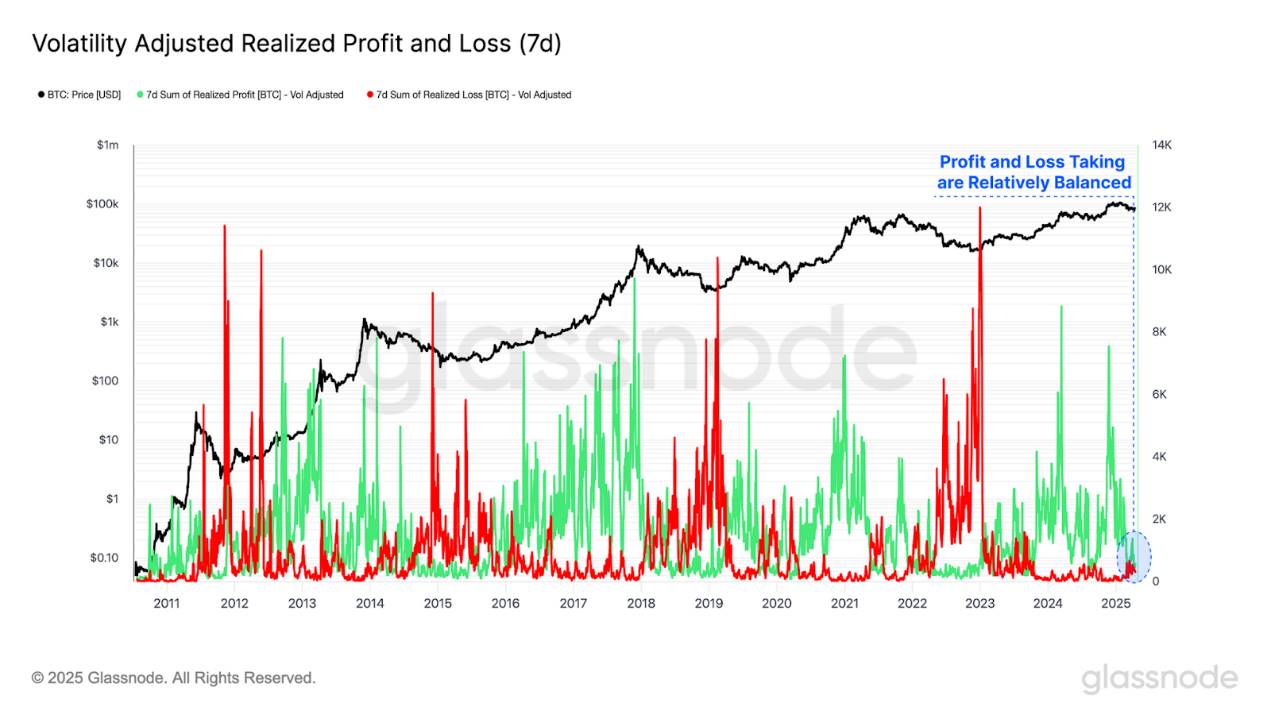
The Realized Profit/Loss metric, a component of Realized Market Cap, measures the price difference between when tokens were purchased and when they were spent on-chain.
-
Tokens spent above their purchase price are considered to lock in realized profits.
-
Tokens spent below their purchase price are viewed as locking in realized losses.
Measuring Realized Profit/Loss in Bitcoin units standardizes all profit and loss events. Additionally, adjusting for volatility (using 7-day realized volatility) further refines the metric, helping account for Bitcoin’s diminishing returns and growth rates over its 16-year history.
Currently, profit and loss activity is relatively balanced, with a neutral capital inflow rate, reflecting saturation in investor activity within the current price range.
Source: Glassnode
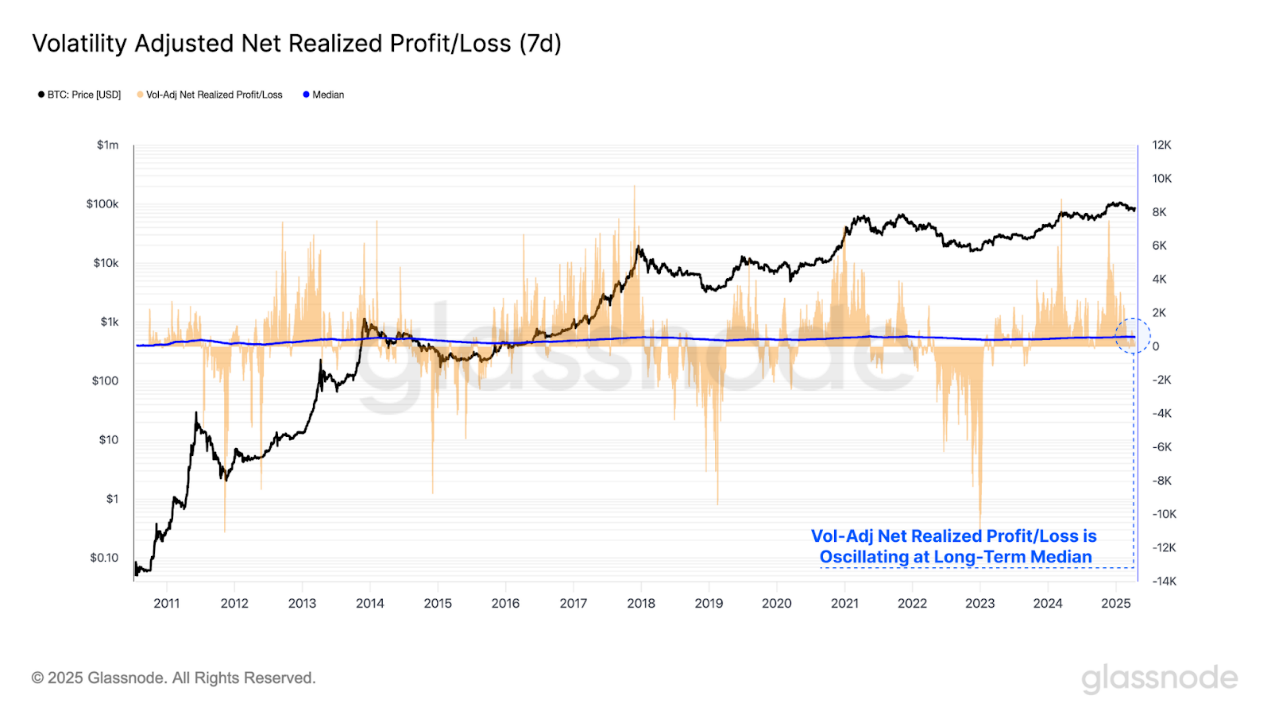
By calculating the difference between realized profits and losses, we derive the Net Realized Profit/Loss metric, which indicates the dominant direction of value flowing into or out of the network.
Using the volatility-adjusted Net Realized Profit/Loss and comparing it to its cumulative median helps distinguish two market regimes:
-
Persistent readings above the median typically signal bull markets and net capital inflows.
-
Sustained readings below the cumulative median are generally associated with bear markets and net capital outflows.
Markets often push investors toward the edge of maximum pain, peaking at cyclical turning points. We can observe how the volatility-adjusted Net Realized Profit/Loss oscillates around its long-term median, acting as a mean-reverting mechanism.
This metric has now returned to its neutral median, suggesting the Bitcoin market is at a critical decision point, defining boundaries where bulls could reestablish support within the current price range.
Source: Glassnode
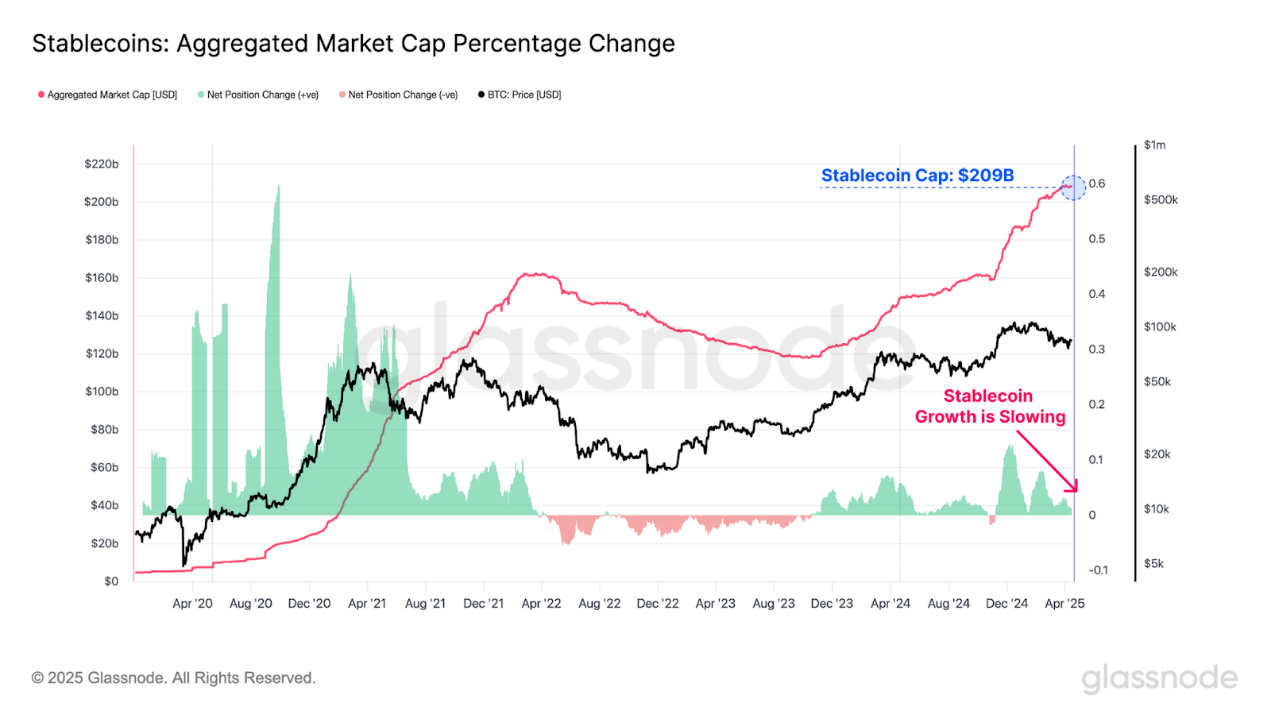
Stablecoins have become foundational asset classes within the digital asset ecosystem, serving as quote assets on both DEXs and CEXs. Evaluating liquidity through the lens of stablecoins offers a new dimension, enabling a more comprehensive understanding of digital asset liquidity conditions.
Stablecoin supply remains in positive territory but has slowed in recent weeks. This further corroborates a broader contraction in digital asset liquidity, evident in weakening demand for digital dollars.
Source: Glassnode
Assessing Investor Stress
During prolonged market turbulence, assessing the scale of unrealized losses currently held by Bitcoin investors is crucial.
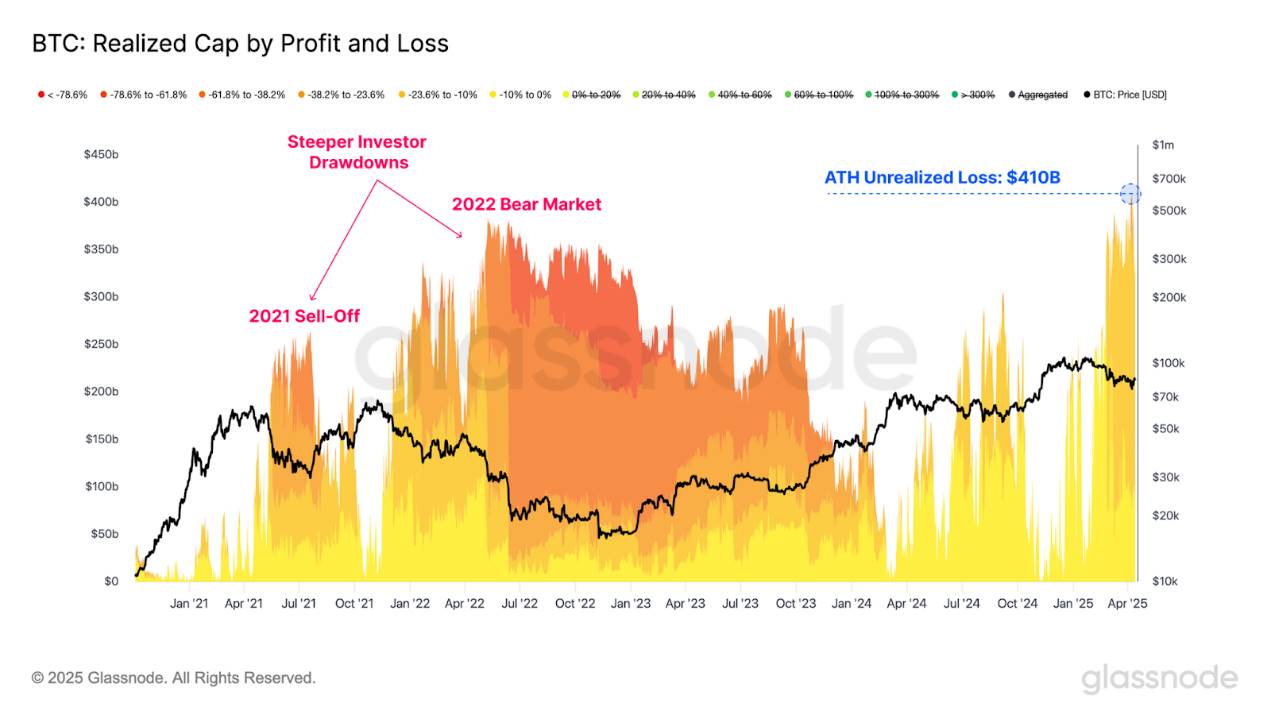
When measuring unrealized losses across the market, we note that during the drop to $75,000, unrealized losses hit a record high of $410 billion. Examining the composition of these unrealized losses reveals that most investors are holding drawdowns of up to -23.6%.
Compared to the sell-off in May 2021 and the 2022 bear market, the total size of unrealized losses is larger. However, on a per-investor basis, previous downturns saw far steeper declines—up to -61.8% and -78.6%, respectively.
While the absolute amount of unrealized losses is higher (reflecting Bitcoin's greater market value today), individual investors face less severe challenges compared to past bear markets.
Source: Glassnode
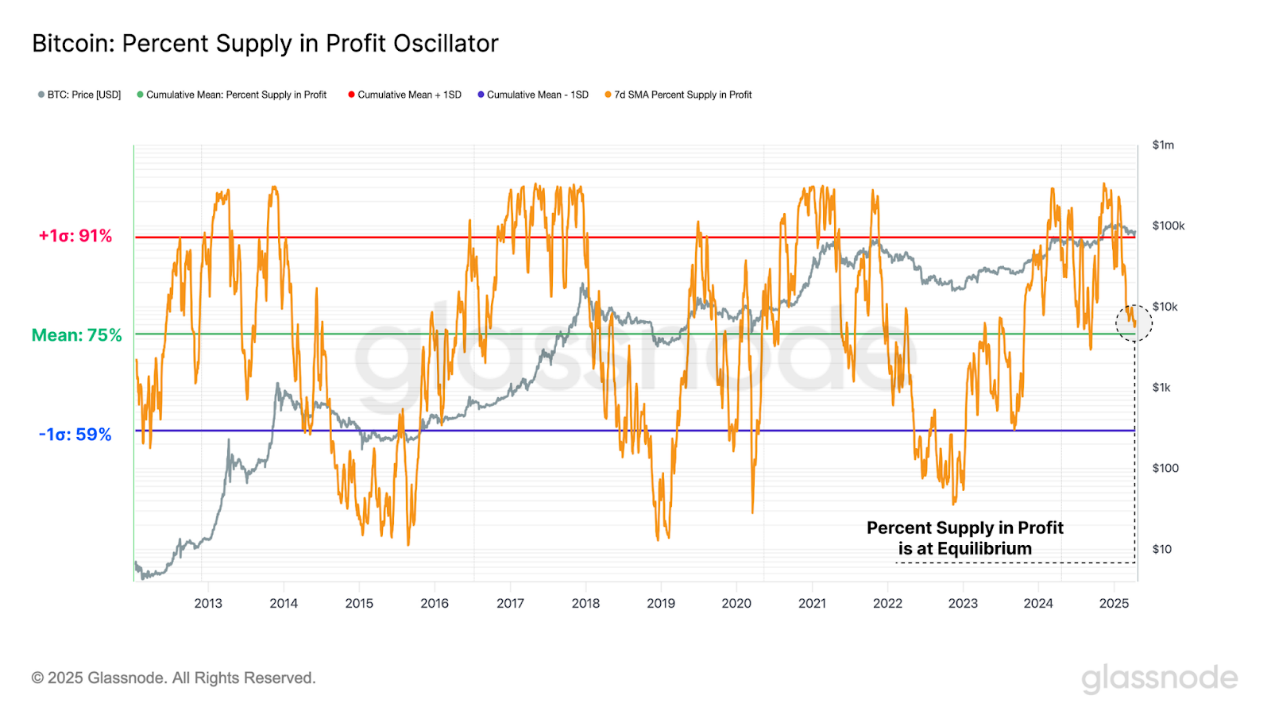
Despite unrealized losses reaching historic highs, the proportion of supply in profitable positions remains high at 75%. This indicates that most loss-making investors bought in after the top formation.
Notably, the percentage of supply in profit is approaching its long-term average. Historically, this zone represents a critical threshold to defend before the majority of crypto holdings fall into loss territory—a pivotal boundary between bull and bear markets.
-
Bull markets are typically characterized by profitable supply above its long-term average, often finding support throughout the cycle.
-
Historically, bear markets feature extended periods where profitability falls well below the long-term mean, with frequent rallies confirming declining profitability.
Similar to the Net Realized Profit/Loss metric, defending this level could enable a rebound from the long-term average range.
Source: Glassnode
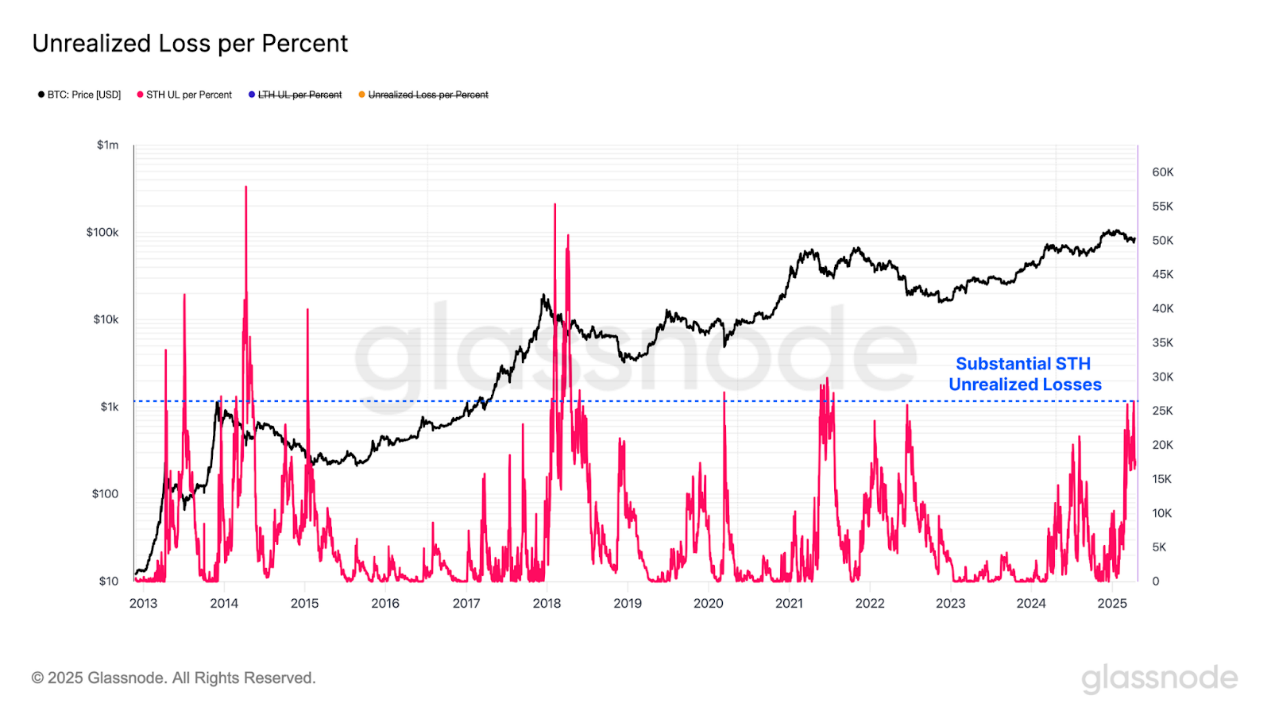
As the market continues to contract, the absolute size of unrealized losses is expected to grow. To account for this and normalize across different drawdown magnitudes, we introduce a new metric: Unrealized Loss per Percentage Drawdown, which expresses loss in Bitcoin units relative to the percentage decline from the all-time high.
Applying this metric to the cohort of short-term holders reveals that, adjusted for drawdown depth, their unrealized losses are already substantial—comparable to levels seen at the onset of previous bear markets.
Source: Glassnode
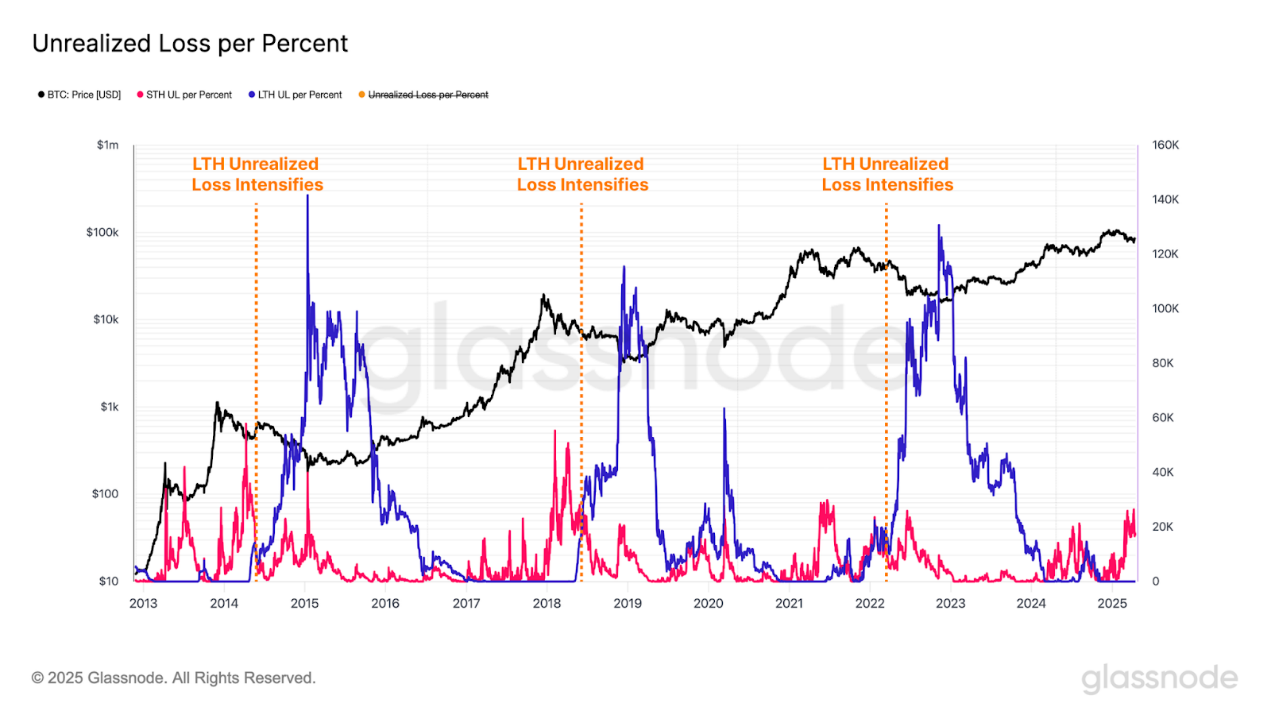
Nonetheless, current unrealized losses are primarily concentrated among new investors, while long-term holders remain overwhelmingly in profit. However, an important nuance is emerging: as recent top buyers gradually transition into long-term holders, the unrealized loss level within this group may rise.
Historically, a significant expansion in unrealized losses among long-term holders typically confirms a bear market, albeit with a lag following the market peak. So far, there is no clear evidence that such a regime shift is underway.
Source: Glassnode
Summary and Conclusion
The macroeconomic outlook remains uncertain, with ongoing shifts in global trade dynamics amplifying volatility in U.S. Treasuries and equities. Notably, during this challenging period, Bitcoin and gold have performed particularly strongly. This may signal an encouraging development—that the foundations of the financial system are entering a phase of transformation and change.
Although Bitcoin has demonstrated notable resilience, it has not been immune to heightened global market volatility, recording its largest decline of the 2023–2025 cycle. This has disproportionately impacted new market entrants, who now bear the majority of market losses. However, from an individual investor perspective, the market experienced far deeper drawdowns in prior cycles, especially during the May 2021 sell-off and the 2022 bear market. Furthermore, mature and long-term investors remain unaffected by ongoing economic pressures, staying almost entirely in a state of unrealized profit.
Join TechFlow official community to stay tuned
Telegram:https://t.me/TechFlowDaily
X (Twitter):https://x.com/TechFlowPost
X (Twitter) EN:https://x.com/BlockFlow_News
 @glassnode