Arthur Hayes' new article: Fed policy shift signals emerging—can Bitcoin break $250,000 by year-end?
TechFlow Selected TechFlow Selected
Arthur Hayes' new article: Fed policy shift signals emerging—can Bitcoin break $250,000 by year-end?
Federal Reserve Chair Powell faces a serious policy dilemma: under massive government debt and political pressure, the Fed has had to abandon its independence and anti-inflation stance, turning instead to quantitative easing and other measures to finance the government.
Original: Arthur Hayes
Translation: Yuliya, PANews

Within global central banking circles, Jerome Powell and Haruhiko Kuroda have developed a deep friendship. Ever since Kuroda stepped down as Governor of the Bank of Japan (BOJ) several years ago, Powell has frequently turned to him for advice or casual conversation. In early March this year, a meeting between Powell and the new U.S. Treasury Secretary Scott Bessent left him deeply troubled. The encounter haunted him psychologically, prompting him to seek someone to confide in. Imagine this:
During one such conversation, Powell opened up to Kuroda about his distress. Through their dialogue, Kuroda recommended to Powell a "Jungian Center" specifically serving central bank governors. This institution originated during the era of the German Imperial Bank, founded by the renowned psychologist Carl Jung to help top central bankers cope with stress. After World War II, this service expanded to London, Paris, Tokyo, and New York.
The next day, Powell visited the office of therapist Justin at 740 Park Avenue. There, he underwent an intense psychological session. Justin quickly identified that Powell was suffering from “fiscal dominance” syndrome. During the session, Powell revealed the humiliating experience of his meeting with Treasury Secretary Bessent—an incident that severely damaged his pride as Chair of the Federal Reserve.
Justin comforted him, saying this situation was not unprecedented. She suggested Powell read Arthur Burns’ speech “The Anguish of Central Banking” to help him understand and accept the current predicament.
Federal Reserve Chair Jerome Powell recently hinted during the March meeting that quantitative easing (QE) could soon resume, with a focus on the U.S. Treasury market. This statement marks a significant shift in the global dollar liquidity landscape. Powell outlined a potential path forward, and this policy reversal is expected to begin implementation as early as this summer. Meanwhile, while markets continue debating the pros and cons of tariff policies, this development may signal positive news for the cryptocurrency market.
This article will focus on the political, mathematical, and philosophical reasons behind Powell’s concession. First, we’ll examine President Trump’s consistent campaign promises and why, mathematically, they require the Federal Reserve and U.S. commercial banking system to print money to buy Treasuries. Then, we’ll discuss why the Fed never truly had the chance to maintain tight enough monetary conditions to curb inflation.
A Promise Made Must Be Kept
Recently, macroeconomic analysts have been actively discussing Trump’s policy intentions. Some argue that Trump might pursue aggressive strategies until his approval ratings fall below 30% before adjusting course; others believe that during his final term, Trump aims to reshape the world order and overhaul America’s financial, political, and military systems. In short, he is willing to endure significant economic pain and plummeting popularity to achieve what he believes are beneficial policies for the United States.
However, for investors, the key lies in abandoning subjective judgments about whether policies are “right” or “wrong,” and instead focusing on probabilities and mathematical models. Portfolio performance depends more on changes in global fiat liquidity than on America's strength relative to other nations. Therefore, rather than trying to guess Trump’s policy preferences, it’s better to concentrate on data charts and mathematical relationships to better anticipate market movements.
Since 2016, Trump has consistently emphasized that the U.S. has been treated unfairly over decades due to exploitation by trade partners. While there’s debate over his policy execution, his core intent has remained unchanged. On the Democratic side, though less vocal than Trump about restructuring the global order, they broadly agree with this direction. President Biden maintained Trump’s restrictions on China’s access to semiconductors and other critical U.S. market sectors during his presidency. Vice President Kamala Harris used tough rhetoric toward China in her earlier presidential campaign. Although both parties may differ in pace and depth of implementation, they share common ground in pushing for change.
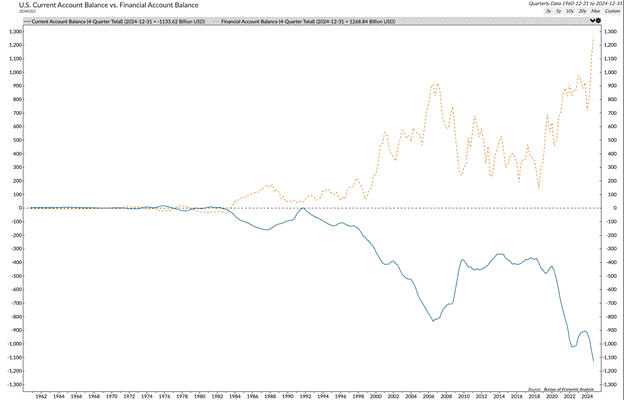
The blue line represents the U.S. current account balance, essentially the trade balance. It shows that starting from the mid-1990s, the U.S. began importing far more goods than it exported—a trend that accelerated after 2000. What happened during this period? The answer is China’s rise.
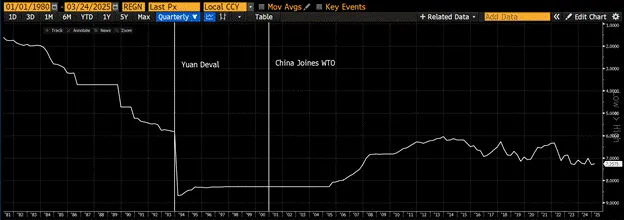
In 1994, China significantly devalued the yuan, launching its journey as a mercantilist export powerhouse. In 2001, President Bill Clinton allowed China into the World Trade Organization, drastically reducing tariffs on Chinese exports to the U.S. As a result, America’s manufacturing base shifted to China, changing history forever.
Trump’s supporters are precisely those negatively affected by the offshoring of American manufacturing. These individuals lack college degrees, live in inland regions of the U.S., and hold almost no financial assets. Hillary Clinton referred to them as “deplorables.” Vice President JD Vance affectionately calls them—and himself—“hillbillies.”
The orange dashed line and upper panel show the U.S. financial account balance. It closely mirrors the current account. Exporting countries like China can sustain massive trade surpluses because when they earn dollars from selling goods to the U.S., they don’t reinvest those dollars domestically. Doing so would mean selling dollars to buy local currency like the yuan, causing appreciation and making exports more expensive. Instead, they use these dollars to purchase U.S. Treasuries and stocks. This allows the U.S. to run large deficits without destabilizing its bond market and has given the U.S. the best-performing stock market globally over recent decades.
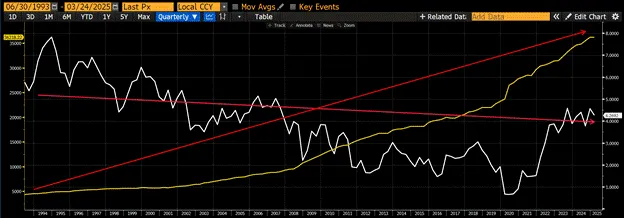
The yield on the 10-year U.S. Treasury note (white) has slightly declined, while total outstanding debt (yellow) has increased sevenfold.
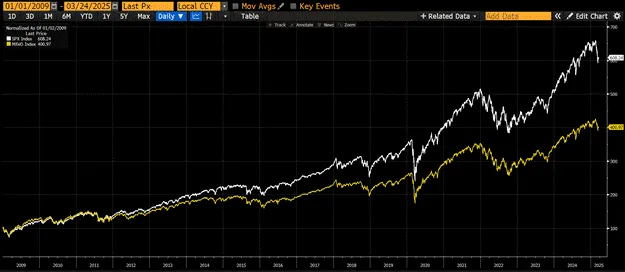
Since 2009, the MSCI U.S. Index (white) has outperformed the MSCI World Index (yellow) by 200%.
Trump believes that by bringing manufacturing jobs back to the U.S., he can provide good employment for about 65% of Americans without college degrees, strengthen military power (since weapons would be produced in sufficient quantities to face peer or near-peer adversaries), and drive economic growth above trend levels—such as achieving 3% real GDP growth.
This plan faces two obvious problems:
-
First, if China and other countries no longer provide dollars to support the Treasury and stock markets, prices will fall. Treasury Secretary Scott Bessent needs buyers for the massive amount of debt that must be refinanced, plus ongoing federal deficits. His goal is to reduce the deficit from around 7% to 3% by 2028.
-
Second, capital gains taxes from rising stock markets are a marginal revenue driver for the government. When the wealthy can't profit from stocks, deficits grow. Trump’s platform isn’t about cutting military spending or entitlements like healthcare and Social Security, but about growth and eliminating fraudulent expenditures. Thus, he needs capital gains tax revenue—even though the wealthy, who own most stocks, largely did not vote for him in 2024.
The Mathematical Dilemma of Debt vs. Growth
Suppose Trump succeeds in reducing the deficit from 7% to 3% by 2028—the government still remains a net borrower year after year, unable to repay any existing debt stock. Mathematically, this means interest payments will continue growing exponentially.
This sounds dire, but theoretically, the U.S. could grow its way out of the problem and deleverage its balance sheet. If real GDP grows at 3% and long-term inflation runs at 2% (though unlikely), nominal GDP growth would be 5%. If the government issues debt at 3% of GDP while the economy grows nominally at 5%, then mathematically, the debt-to-GDP ratio would decline over time. But one crucial factor is missing: at what interest rate can the government finance itself?
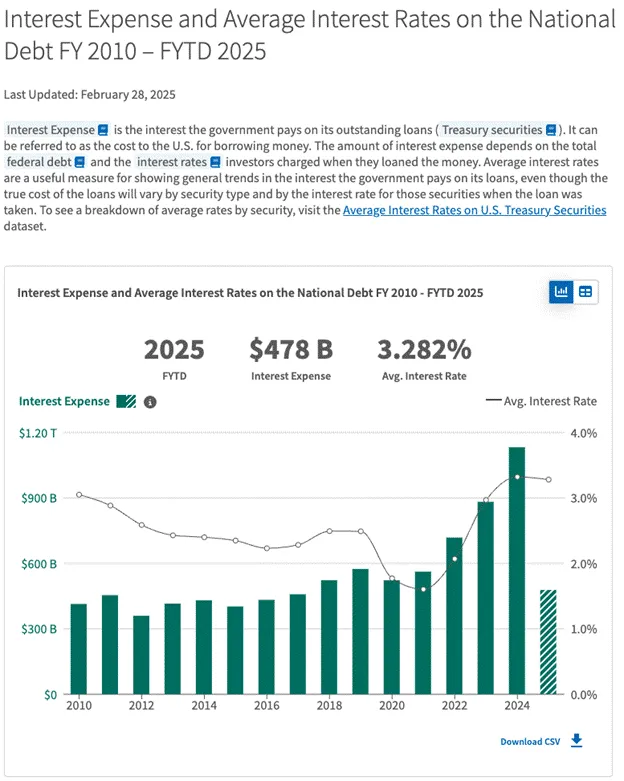
In theory, if the U.S. economy grows nominally at 5%, Treasury investors should demand at least a 5% return. That would dramatically increase interest costs, given that the Treasury currently pays a weighted average interest rate of 3.282% on its approximately $36 trillion (and growing) debt burden.
Unless Bessent finds buyers willing to purchase Treasuries at unreasonably high prices or low yields, the math simply doesn’t add up. Since Trump is busy reshaping the global financial and trade system, China and other exporting nations cannot and will not step in as buyers. Private investors won’t either, given the low yields. Only U.S. commercial banks and the Federal Reserve possess the firepower to buy government debt at sustainable levels.
The Fed can print money to buy bonds—that’s called quantitative easing (QE). Banks can effectively do the same through fractional reserve banking. But practical implementation isn’t straightforward.
The Fed is ostensibly occupied with its unrealistic mission of bringing manipulated and artificial inflation metrics below its fictional 2% target. It is removing money/credit from the system via balance sheet reduction—known as quantitative tightening (QT). Because banks performed poorly during the 2008 Global Financial Crisis (GFC), regulators now require them to post more capital against Treasury holdings—called the Supplementary Leverage Ratio (SLR). Hence, banks cannot leverage infinitely to finance the government.
Yet, changing this and turning the Fed and banks into inelastic buyers of Treasuries is simple. The Fed could decide to at least end QT and fully restart QE. It could also exempt banks from SLR requirements, allowing unlimited leverage to purchase Treasuries.
The question becomes: Why would Jerome Powell-led Fed help Trump achieve his policy goals? The Fed clearly helped Harris’s campaign by cutting rates 50 basis points in September 2024, yet has been stubborn about increasing money supply upon Trump’s request to lower long-term Treasury yields after his election victory. To understand why Powell will ultimately comply with government demands, perhaps we should look back to the historical context of 1979.
The Emasculated Chair
Now, Powell finds himself in a very awkward position, watching helplessly as fiscal dominance undermines the Fed’s credibility in fighting inflation.
Simply put, when government debt becomes too large, the Fed must abandon independence and finance the government at low rates rather than genuinely combat inflation.
This isn’t a new issue. Former Fed Chair Burns faced a similar situation in the 1970s. In his 1979 speech, “The Anguish of Central Banking,” he explained why central banks struggle to control inflation:
“Since the 1930s, political and philosophical currents in the U.S. and elsewhere have transformed economic life, creating persistent inflationary tendencies.”
In plain terms: Politicians made me do it.
Burns pointed out that governments became increasingly interventionist—not only relieving hardship but also subsidizing “worthy” activities and restricting “harmful” competition. Despite national wealth growth, American society was restless in the 1960s. Minorities, the poor, the elderly, the disabled—all felt injustice. Middle-class youth began rejecting established institutions and cultural values. Just like today, prosperity wasn’t evenly shared, and people demanded government action.
Government actions and public demands fed into each other, escalating over time. When the government began addressing unfinished tasks like reducing unemployment and eradicating poverty in the mid-1960s, it awakened new expectations and demands.
Now, Powell faces a similar dilemma—wanting to be a strong anti-inflation hero like Volcker, but potentially forced to yield to political pressure like Burns.
The history of direct government intervention to solve problems for key voter groups spans decades. The actual effectiveness varies by circumstance, with mixed results.
Many outcomes from active government-citizen engagement have indeed brought positive impacts. However, the cumulative effect has injected a strong inflationary bias into the U.S. economy. The proliferation of government programs gradually increased tax burdens on individuals and businesses. Still, the government’s willingness to tax has consistently lagged behind its appetite for spending.
A broad social consensus emerged: solving problems is the government’s responsibility. And the primary method governments use to solve problems is increased spending—embedding inflation deeply into the economic system.
Indeed, much of the expansion in government spending has been driven by commitments to full employment. Inflation came to be widely seen as temporary—or acceptable as long as it remained moderate.
The Fed’s Tolerance for Inflation and Policy Contradictions
Why does the Fed tolerate 2% annual inflation? Why does it use terms like “transitory” inflation? Compounded over 30 years, 2% inflation leads to an 82% rise in price levels. Yet if unemployment rises by just 1%, it’s treated as a catastrophe. These are worth pondering.
Theoretically, the Fed system had the power to crush inflation in its infancy—or stop it at any point thereafter. It could have constrained money supply, created sufficient strain in financial and industrial markets, and swiftly ended inflation. But it didn’t, because the Fed itself is influenced by the same philosophical and political currents reshaping American life and culture.
While表面上 independent, as a government agency philosophically aligned with solving broad social issues, the Fed neither can nor will prevent inflation arising from necessary interventions. The Fed has become a collaborator, generating the very inflation it was meant to control.
In response to political reality, the Fed did occasionally tighten policy—as in 1966, 1969, and 1974—but never long enough to fully extinguish inflation. Overall, monetary policy came to be governed by the principle of “low-level nurturing of the inflation process while still accommodating most market pressures.”
This is exactly the path Powell’s Fed has taken during his tenure. This reflects the phenomenon known as “fiscal dominance.” The Fed will take whatever steps are necessary to fund the government. Whether policy goals are wise is debatable, but Burns’ message is clear: becoming Fed Chair implicitly means agreeing to do whatever it takes to ensure the government can finance itself affordably.
Current Policy Pivot
Powell’s recent Fed press conference showed signs of continued submission to political pressure. He had to explain why QT should slow despite strong U.S. economic indicators and loose monetary conditions. With unemployment low, equities at record highs, and inflation still above 2%, tighter policy would normally be justified.
Reuters reported: "On Wednesday, the Federal Reserve said it would slow the pace of its balance sheet reduction starting next month, as uncertainty over the government’s borrowing limit persists—a shift that could last through the remainder of the process."
According to Fed historical records, although former Chair Paul Volcker was known for strict monetary policy, in the summer of 1982 he eased policy amid recession and political pressure. At the time, House Majority Leader James C. Wright Jr. met repeatedly with Volcker to convey the economic impact of high rates, with little initial success. However, by July 1982, data showed the recession had bottomed out. Volcker then told lawmakers he would abandon previous tight targets and predicted a “highly likely” recovery in the second half—aligning with Reagan administration expectations. Notably, even though Volcker is among the most respected Fed Chairs, he too could not fully resist political pressure. And back then, the U.S. government’s debt situation was far healthier—debt-to-GDP stood at just 30%, compared to today’s 130%.
Evidence of Fiscal Dominance
Last week, Powell demonstrated that fiscal dominance remains alive. Therefore, QT on Treasuries will halt in the short to medium term. Furthermore, Powell indicated that while the Fed may allow mortgage-backed securities (MBS) to roll off naturally, it will be a net buyer of Treasuries. Mathematically, this keeps the Fed’s balance sheet constant—but in reality, it amounts to Treasury QE. Once formally announced, Bitcoin’s price will surge significantly.
Moreover, due to demands from banks and the Treasury, the Fed will grant SLR exemptions to banks—a different form of Treasury QE. Ultimately, the math won’t work otherwise, and Powell cannot stand by and let the U.S. government fail—even if he dislikes Trump.
At the FOMC press conference on March 19, Powell addressed the balance sheet adjustment plan. He stated the Fed would eventually stop net balance sheet reduction, though no decision had been made yet. He emphasized wanting MBS (mortgage-backed securities) to gradually exit the Fed’s balance sheet over time. However, he noted the Fed might maintain overall balance sheet size by allowing MBS to mature naturally. Specific timing and methods remain undetermined.
Treasury Secretary Bessent recently discussed the Supplementary Leverage Ratio (SLR) on a podcast, noting that eliminating SLR could become a constraint for banks and might reduce U.S. Treasury yields by 30 to 70 basis points. He added that each basis point change equates to roughly $1 billion in annual economic impact.
Additionally, Federal Reserve Chair Jerome Powell stated at the March FOMC post-meeting press conference that inflationary effects from the Trump administration’s proposed tariff policies could be “transitory.” He argued that while tariffs might trigger inflation, the impact is expected to be short-lived. This view of “temporary” inflation gives the Fed room to maintain accommodative policy even if inflation spikes due to tariffs. Powell emphasized that the current baseline view is that tariff-driven price increases will not persist long-term, though he acknowledged future uncertainty. Analysts suggest this implies tariffs’ impact on asset prices may be waning, especially for assets reliant solely on fiat liquidity.
Federal Reserve Chair Jerome Powell said at the March FOMC meeting that inflation triggered by tariffs could be “transitory.” He believes this “transitory” inflation outlook allows the Fed to continue an accommodative stance even if inflation rises sharply due to tariffs.
At the post-meeting press conference, Powell stressed that the current baseline expectation is that price increases caused by tariffs will be temporary, though he added, “We cannot be certain of future specifics.” Market analysts note that for assets dependent on fiat liquidity, the impact of tariffs may already be fading.
Moreover, Trump’s planned April 2 “Liberation Day” announcement and potential tariff hikes appear to have had little effect on market expectations.
Dollar Liquidity Calculation
What matters is the forward-looking change in dollar liquidity relative to prior expectations.
-
Previous pace of Treasury QT: $25 billion per month
-
Treasury QT pace after April 1: $5 billion per month
-
Net effect: +$240 billion annualized change in dollar liquidity
-
Effect of QT reversal: Up to $35 billion monthly runoff in MBS
-
If Fed balance sheet stays flat, can purchase: Up to $35 billion in Treasuries monthly, or $420 billion annualized
Starting April 1, an additional $240 billion in relative dollar liquidity will be created. In the near future—by latest Q3 this year—this will rise to $420 billion annualized. Once QE begins, it won’t stop for a long time; as the economy requires more money printing to sustain itself, the pace will increase.
How the Treasury manages its General Account (TGA) also significantly affects dollar liquidity. The TGA currently stands at ~$360 billion, down from ~$750 billion at the start of the year. Due to debt ceiling constraints, the TGA has been used to sustain government spending.
Traditionally, once the debt ceiling is raised, the TGA is refilled—negatively impacting dollar liquidity. However, maintaining excessively high cash balances isn’t always economically rational. Under former Treasury Secretary Yellen, the target TGA balance was set at $850 billion.
Given that the Fed can provide liquidity support as needed, the Treasury may adopt a more flexible TGA management strategy. Analysts expect that in the Quarterly Refunding Announcement (QRA) in early May, the Treasury may not significantly raise its TGA target above current levels. This would mitigate negative dollar liquidity shocks following debt ceiling increases, providing a more stable environment for markets.
Case Study: The 2008 Financial Crisis
During the 2008 Global Financial Crisis (GFC), gold and the S&P 500 reacted differently to rising fiat liquidity. Gold, as an anti-establishment financial asset, responded faster to liquidity injections, while the S&P 500—dependent on legal backing from the national system—reacted more slowly, especially when solvency of the financial system was questioned. Data shows gold outperformed the S&P 500 during the crisis’ worst phase and subsequent recovery. This case study suggests that even with significant increases in dollar liquidity, adverse economic conditions could still negatively affect Bitcoin and cryptocurrency price trends.
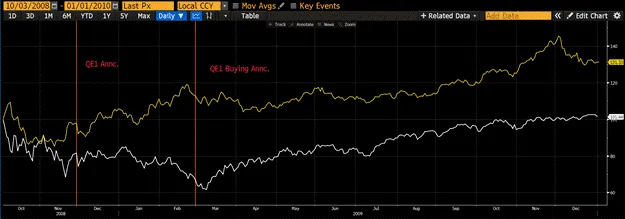
On October 3, 2008, the U.S. government announced the Troubled Asset Relief Program (TARP) to address market turmoil following Lehman Brothers’ collapse. However, the program failed to halt financial market declines—both gold and U.S. equities fell. Later, in early December 2008, Fed Chair Ben Bernanke announced a large-scale asset purchase program (later known as QE1). As a result, gold began to rebound, while U.S. stocks continued falling until they bottomed in March 2009—only after the Fed officially launched money printing. By early 2010, gold prices were up 30% from Lehman’s collapse, while U.S. equities had risen just 1%.
Bitcoin Value Equation
Bitcoin did not exist during the 2008 financial crisis, but it is now a major financial asset. Bitcoin’s value can be simplified as:
Bitcoin Value = Technology + Fiat Liquidity
Bitcoin’s technology functions well, with no major recent changes—positive or negative. Therefore, Bitcoin trades purely based on market expectations of future fiat money supply. If our analysis of the Fed’s major shift from QT to Treasury QE is correct, then Bitcoin’s recent local low of $76,500 last month marks the beginning of a climb toward a year-end target of $250,000. While not precise science, and considering gold’s behavior in similar environments, Bitcoin is more likely to reach $110,000 before retesting $76,500. Even if U.S. stocks fall further due to tariff policies, collapsing earnings expectations, or weaker foreign demand, Bitcoin still has a strong chance of rising. Investors should deploy capital cautiously, avoid leverage, and buy small positions relative to total portfolio size.
Nevertheless, Bitcoin could still reach $250,000 by year-end—an optimistic outlook supported by multiple factors, including the Fed potentially releasing liquidity to boost markets, and the PBOC possibly loosening policy to maintain RMB stability against the dollar. Additionally, European nations increasing military spending due to security concerns may resort to printing euros, indirectly stimulating global liquidity.
Join TechFlow official community to stay tuned
Telegram:https://t.me/TechFlowDaily
X (Twitter):https://x.com/TechFlowPost
X (Twitter) EN:https://x.com/BlockFlow_News