Decoding the Correlation Between Bitcoin and the Stock Market: How to Make Smarter Investments?
TechFlow Selected TechFlow Selected
Decoding the Correlation Between Bitcoin and the Stock Market: How to Make Smarter Investments?
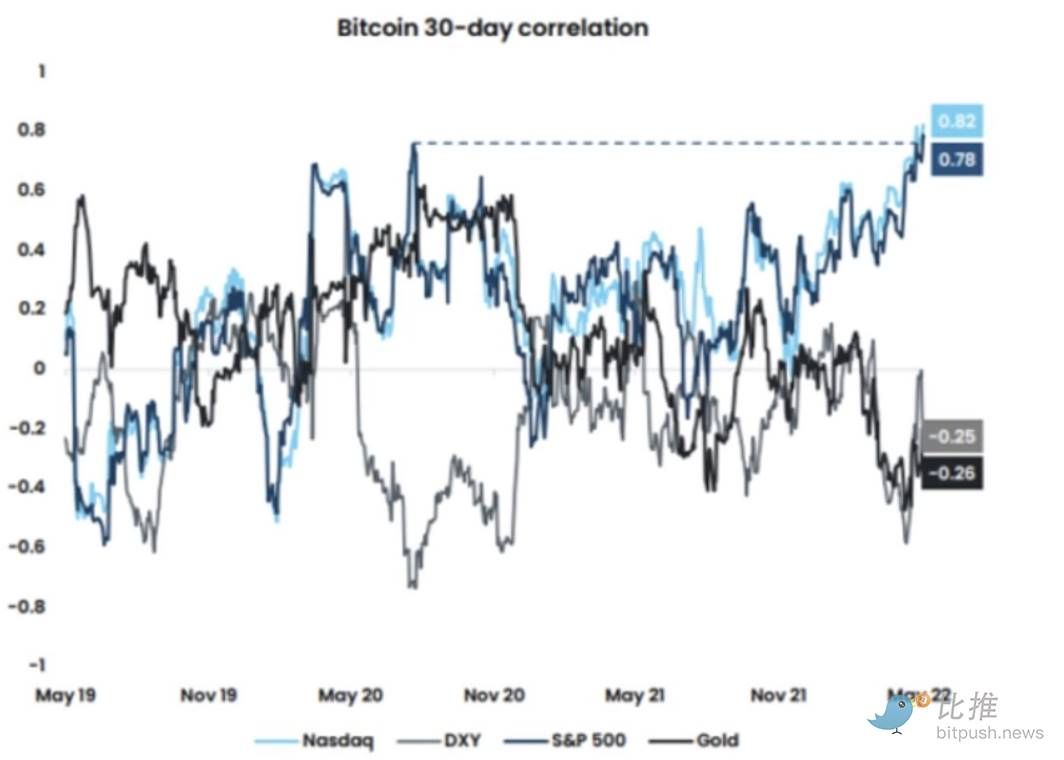
The correlation between Bitcoin and the stock market is continuously increasing.
Source: Bitcoin Magazine Pro Team
Translation: BitpushNews
When investing in Bitcoin, you often struggle to make sense of its extreme price volatility. To understand these sharp fluctuations, you may compare Bitcoin’s performance with traditional assets like stocks. This helps put things into perspective, and you quickly realize that while Bitcoin and the stock market often move in tandem, their charts tell different stories. The comparison chart between Bitcoin and the stock market remains a key component of your Bitcoin investment strategy. In this guide, you'll learn how to analyze and interpret this chart to make more informed and strategic investment decisions.
Is There a Correlation Between Bitcoin and the Stock Market?
Financial markets are considered correlated when they move in sync. For example, if the price of one asset rises or falls and another moves in the same direction, they are positively correlated; if they move in opposite directions, they are negatively correlated; if their price movements are unrelated, they are independent.
Correlation is measured on a scale from -1 to +1:
-
+1 means the assets move perfectly in sync
-
-1 means they move in exactly opposite directions
-
0 means their price movements are independent
In the case of Bitcoin, correlation shows how its price movements relate to other markets such as the stock market. As an emerging digital asset, Bitcoin's correlation with equities has evolved—especially as its popularity and adoption have increased.
Bitcoin vs. Stock Market: An Independent Asset Class
In Bitcoin’s early years after its inception, it had almost no correlation with the S&P 500 Index. Until 2012, Bitcoin prices remained stable while the S&P 500 followed its usual steady upward trend (with minor dips). The first major surge in Bitcoin at the end of 2013 and beginning of 2014 did not coincide with a similar rise in the S&P 500.
A decline in the stock market toward the end of 2016 occurred simultaneously with a rise in Bitcoin prices. Bitcoin experienced sharp volatility, while the S&P 500 changed relatively smoothly. As late as 2018, Bitcoin’s price peaks and troughs showed almost no resemblance to those of the S&P 500.
Bitcoin and Stock Market Correlation from Late 2021 to 2023
From late 2021 through 2022 and into 2023, Bitcoin’s price movements began to resemble those of stocks (albeit with greater volatility). The chart below shows Bitcoin (BTC) compared with the S&P 500 (SPX) and the Nasdaq Composite Index (ICIX) from November 2022 to November 2023.
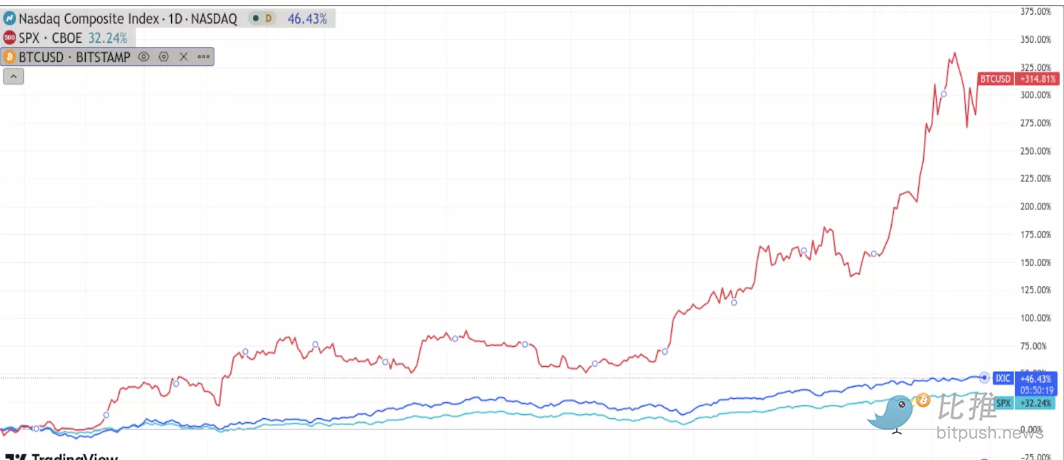
The S&P 500 measures the performance of large-cap stocks, while the Nasdaq Composite tracks around 2,500 market-capitalization-weighted stocks listed on the Nasdaq. There is visible alignment in trends, but Bitcoin exhibits stronger volatility—especially following major events—suggesting that traders and investors are beginning to treat Bitcoin similarly to stocks.
What Does This Mean for Investors?
The correlation between Bitcoin and stock prices could be coincidental—or it might indicate that Bitcoin’s price is following broader market trends. What does this imply for investors?
Since investors appear to be treating Bitcoin like a stock, digital assets may react to market forces in ways similar to equities. For example:
-
May 4, 2022: The Federal Reserve announced an increase in the target range for the federal funds rate to 0.75%-1%
-
May 5, 2022: Bitcoin dropped to around $31,000, the Nasdaq-100 Index (NDX) fell by approximately 1,400 points, and the S&P 500 declined by about 150 points
Bitcoin’s price swing was more pronounced, but the nature of the market reaction was fundamentally the same. Overall, investors may currently be handling Bitcoin temporarily as they would stocks. BTC is still in a price discovery phase, and the market is still determining the role it will play.
Interpreting Bitcoin and Stock Market Charts

Investors looking to profit from Bitcoin’s price swings must first understand how to read price charts. Price charts visually display an asset’s historical price performance over time. A close examination of Bitcoin and the Nasdaq Composite Index over the past four years reveals increasingly evident correlation.
Based on Bitcoin versus stock market charts, here are key instances of correlation:
-
December 2018: Both Bitcoin and Nasdaq prices hit historic lows ($3,689 vs. 6,192 points)
-
June 2019: Both experienced sudden, sharp price spikes
-
February 2020: Sharp decline after quarterly highs
-
March 2021: Prices surged to unusually high levels
-
October 2021: Both declined synchronously after months at elevated levels, without recovery within the year
-
November 2021: Correlation intensified significantly, with Bitcoin nearly mirroring Nasdaq movements
-
May 2022: After a sharp synchronized drop and slight rebound, Bitcoin began reflecting even minor Nasdaq fluctuations
Analyzing the Causes Behind Bitcoin-Stock Market Correlation
The correlation between Bitcoin and the stock market isn’t driven by a single factor. According to comparative analysis of Bitcoin and stock market charts, multiple factors together contribute to their similarity. Like the stock market, Bitcoin’s price is heavily influenced by supply and demand dynamics and investor sentiment:
-
Upside drivers: When demand is strong, market outlook is optimistic, and supply is limited, both prices tend to rise together
-
Downturn triggers: When investors worry about the economic outlook or face adverse policies, prices typically fall collectively
This push-and-pull dynamic causes Bitcoin and stock markets to follow similar rhythms in rising and falling. However, it's important to note that certain factors can weaken this correlation.
Bitcoin and Stock Market Correlation: An Evolving Investment Trend
Bitcoin is not subject to the same regulatory policies and government rules as the stock market. For instance, China’s comprehensive ban on Bitcoin mining in 2021 affected Bitcoin’s price but had no impact on the stock market. Technical differences also exist—the stock market is unaffected by data storage issues or power shortages, which directly affect Bitcoin miners.
Why Do Recent Charts Still Show High Correlation?
The answer lies in growing interconnectivity between Bitcoin and stocks. Although Bitcoin does not depend on the stock market to function, it is no longer seen as an isolated asset. Its increasing popularity has made it highly similar to traditional stock holdings.
Strengthening Ties Between Bitcoin and the Stock Market
BTC is no longer a niche asset traded only by a small group of enthusiasts. Traditional brokerage firms and investment institutions are now involved. The same investors often hold both Bitcoin and stocks, with portfolios containing both assets.
Profits from Bitcoin are frequently reinvested into the stock market, and vice versa. As the correlation between Bitcoin and the stock market continues to strengthen, investors are increasingly recognizing their similarities and making more decisions based on the assumption that “Bitcoin is like stocks.” This tight linkage causes the two markets to mimic each other’s fluctuation patterns.
Pros and Cons of High Correlation
What does the link between Bitcoin and the S&P 500 mean for average investors? The connection between Bitcoin and the stock market has both advantages and disadvantages. If Bitcoin is highly correlated with the stock market, Bitcoin investing becomes more predictable.
When Bitcoin and stock market charts look similar, you can more easily spot market trends and make smarter decisions. Additionally, since stock values tend to rise over the long term, the correlation between Bitcoin and the stock market could mean greater long-term returns for BTC investors.
Potential Benefits of Bitcoin Decoupling From the Stock Market
Despite some benefits, you don’t necessarily need to fear Bitcoin decoupling from the stock market—this could actually be good news for investors seeking portfolio diversification.
A portfolio combining two assets that don’t fall in sync is better protected against financial storms. If decoupling occurs, investors will have more opportunities to hedge against crash risks.
Bitcoin–Stock Market Correlation: Implications for Investment Strategy
Whether Bitcoin decoupling from the stock market is "good" depends on your investment strategy. High correlation between Bitcoin and the stock market benefits those who use stock market forecasts to inform their Bitcoin trading strategies.
Investors whose portfolios aren't well diversified may find that Bitcoin’s correlation with the stock market makes them more vulnerable to market downturns.
Does Bitcoin Follow the Stock Market?
In investing, avoid mistaking correlation for causation. Chart similarities do not necessarily mean there is a direct influence between markets. Just because Bitcoin and stock market charts look so similar doesn’t mean one market greatly affects the other. In some cases, the correlation appears coincidental. For example, the March 2019 stock market drop was due to increased aluminum tariffs, while Bitcoin’s decline that month stemmed from international crackdowns on Bitcoin.
However, there is substantial evidence suggesting the stock market may directly influence Bitcoin. Experts have observed that, regardless of other price-affecting factors, Bitcoin prices often drop when the stock market opens. Investor confidence significantly impacts Bitcoin’s price, so recent Bitcoin crashes often follow stock market crashes. Bitcoin traders reacting to news of stock market weakness often trigger conservative trading behavior.
Will Bitcoin Decouple From the Stock Market?
If your investment strategy relies on Bitcoin following the stock market, watch for signs of decoupling. Experts predict this won’t happen soon. As more people begin to conflate Bitcoin and stock market charts, these two assets are more likely to influence each other. A mild correlation with the stock market is expected to persist through the remainder of the year.
That said, some degree of decoupling between Bitcoin and the stock market is inevitable. The primary reason is Bitcoin’s typically higher volatility. During sell-offs, Bitcoin tends to plummet more drastically than traditional stocks before sharply rebounding.
Signs of Bitcoin Decoupling From the Stock Market and Uncertainty
It's difficult to say whether Bitcoin decoupling from the stock market is positive or negative for Bitcoin investors. Some believe Bitcoin could stabilize during stock market declines; others think Bitcoin’s value might fall even if the stock market recovers. Regardless, signs of Bitcoin-stock market decoupling may include:
-
Tighter government regulation of Bitcoin
-
Loss of confidence in Bitcoin and decentralized finance (DeFi)
-
Increase in token withdrawals
-
Continued decline in stock prices
Join TechFlow official community to stay tuned
Telegram:https://t.me/TechFlowDaily
X (Twitter):https://x.com/TechFlowPost
X (Twitter) EN:https://x.com/BlockFlow_News