2024 Exchange Listing Performance Report: Which of the 9 Centralized Exchanges Delivered the Best Listing Results?
TechFlow Selected TechFlow Selected
2024 Exchange Listing Performance Report: Which of the 9 Centralized Exchanges Delivered the Best Listing Results?
Tokens launched on DEXs with an FDV exceeding $30 million perform comparably to those initially listed on mid-sized CEXs.
Author: Animoca Brands Research
Translation: Felix, PANews
This report analyzes over 3,000 spot token listing events across nine major centralized exchanges (CEXs) and more than 120 decentralized exchanges (DEXs) in 2024. The goal is to assess overall listing trends across platforms and evaluate token price and trading volume performance during these events.
Key Findings
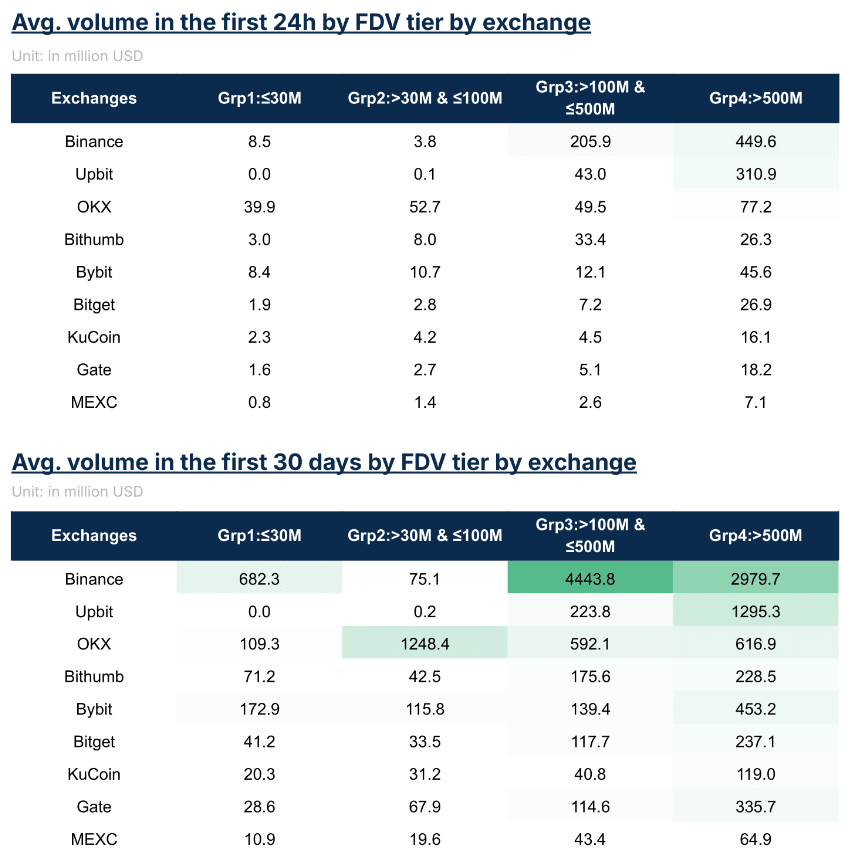
Centralized exchanges adopt different strategies for prioritizing listings, focusing on distinct fully diluted valuation (FDV) tiers. Exchanges with fewer listings tend to prioritize tokens with higher FDVs (over $500 million), while those with higher listing frequency favor tokens with FDVs below $30 million.
Listing activity closely correlates with Bitcoin’s price movements—increasing during bull markets and declining when Bitcoin's upward momentum stalls. While tokens across all FDV sizes are affected by this trend, large-FDV tokens show greater sensitivity to shifts in market sentiment.
Price performance, measured as the 7-day and 30-day change relative to the closing price on the listing day, largely mirrors Bitcoin’s price trend but shows variation across exchanges. A "smile curve" pattern emerges: exchanges with both the highest average listed FDV (e.g., Binance) and lowest (e.g., MEXC) record positive price changes, while mid-tier exchanges (e.g., Bybit, Bitget) see the largest declines.
In terms of trading volume, Binance leads in volume for newly listed tokens, followed by OKX and Upbit. Notably, Upbit’s first 24-hour trading volume rivals Binance’s, while OKX leads in trading volume for tokens within the $30 million to $100 million FDV tier.
Tokens that debut on DEXs with an FDV above $30 million perform comparably to those initially listed on mid-tier CEXs. Price performance (measured from Day 2 to Day 7 and Day 30) for DEX-first tokens outperforms four out of five mid-tier CEXs. Their 30-day trading volume also matches or exceeds that of CEXs like KuCoin, Gate, and MEXC.
It is not uncommon for tokens debuting on DEXs to later appear on mid-tier CEXs, but listings on top-tier CEXs remain rare. Among DEX-first tokens sampled in the second half of 2024, approximately 16% were subsequently listed on a CEX, while only 2% made it onto major exchanges such as Binance, OKX, or Upbit.
CEX Listing Performance
Overview
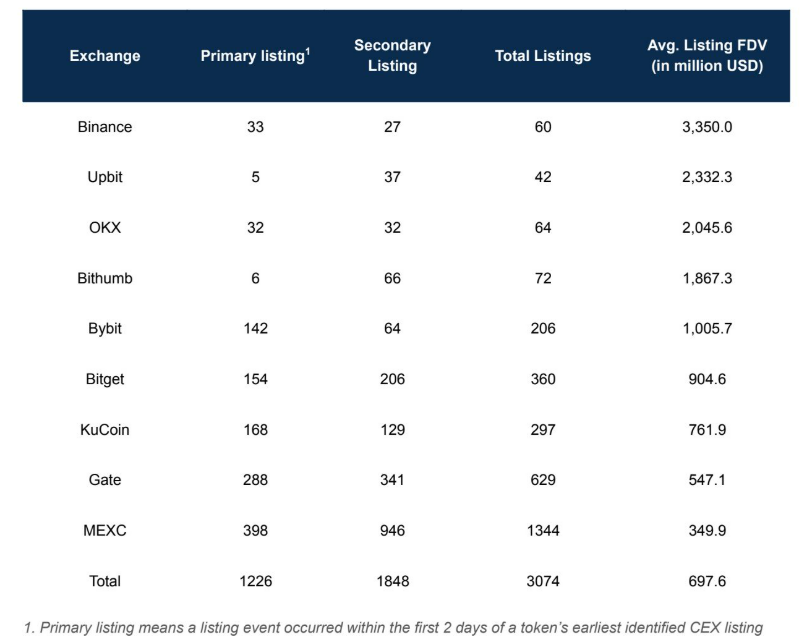
The report documents a total of 3,074 token listing events. Of these, 1,226 events (40%) were identified as primary listings—occurring within the first two days after a token launch—while 1,848 events (60%) were classified as secondary listings.
Most exchanges adopted a balanced approach, participating in roughly equal numbers of primary and secondary listings.
Generally, exchanges listing high-FDV projects focus on fewer, larger-scale listings, while those listing smaller-FDV tokens have a higher number of listing events.
The two South Korean exchanges, Upbit and Bithumb, primarily focus on secondary listings. Due to their practices, a primary listing may not represent the first exchange listing. For the remainder of this report, exchanges are ranked by their average listed FDV, with high-FDV exchanges referred to as “large exchanges” and others as “mid-tier exchanges.”
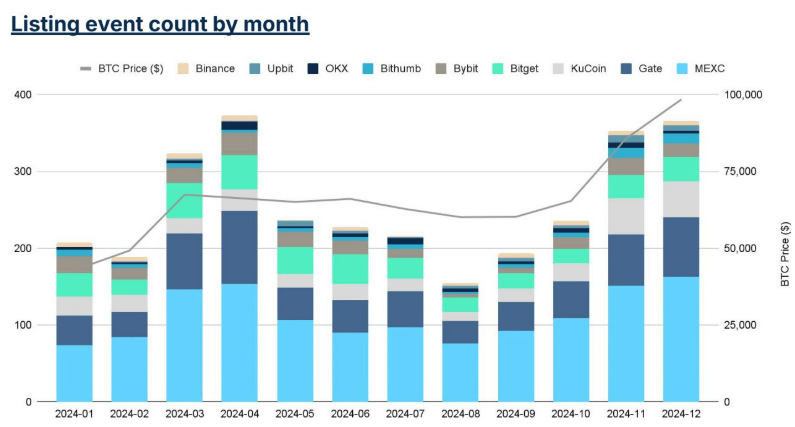
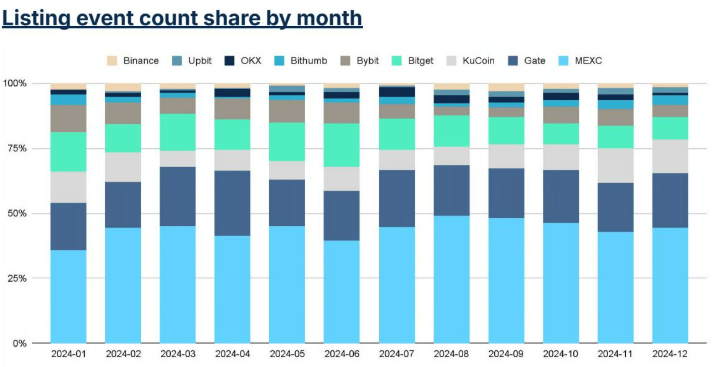
Monthly Summary of Listing Events
Listing activity peaks during bull markets (February–March and August–December) and declines during bearish periods.
April stands out as an exception: despite a reversal in BTC price, listing activity continued to rise. This effect was less evident in December, when BTC stalled after two months of gains.
In terms of event count, top-tier exchanges were less impacted by bear markets, reflected in their growing share of listings during these periods.
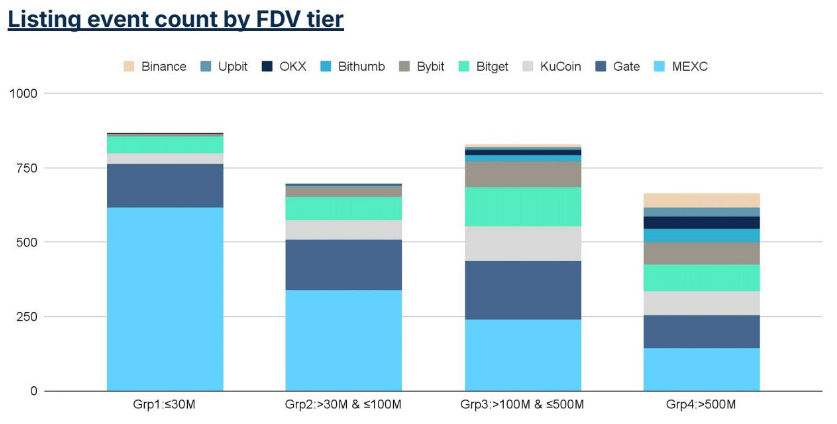
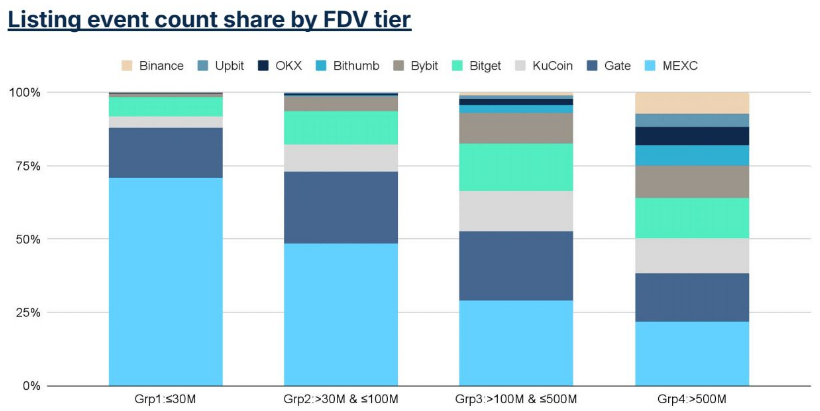
Summary of Listings by FDV
Large exchanges concentrate most of their listing activity in the $500 million+ FDV category, with the top four exchanges accounting for 25% of listings in this tier.
Nevertheless, mid-tier exchanges contribute the majority of listings for tokens above $500 million FDV, likely because large-exchange projects often list simultaneously on mid-tier platforms—but not vice versa.
Mid-tier exchanges such as Bybit, KuCoin, Bitget, and Gate maintain a more balanced distribution across the four FDV tiers, with slightly higher representation in the $30 million to $500 million range. MEXC adopts a different strategy, focusing heavily on tokens with FDV ≤ $30 million, accounting for 70% of listings in this category.
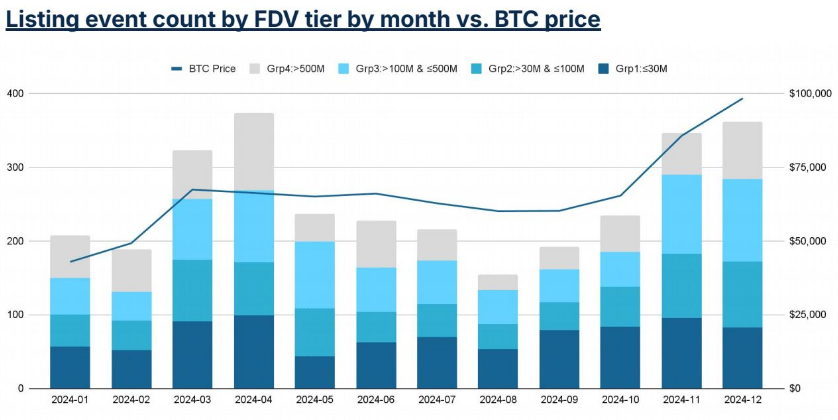
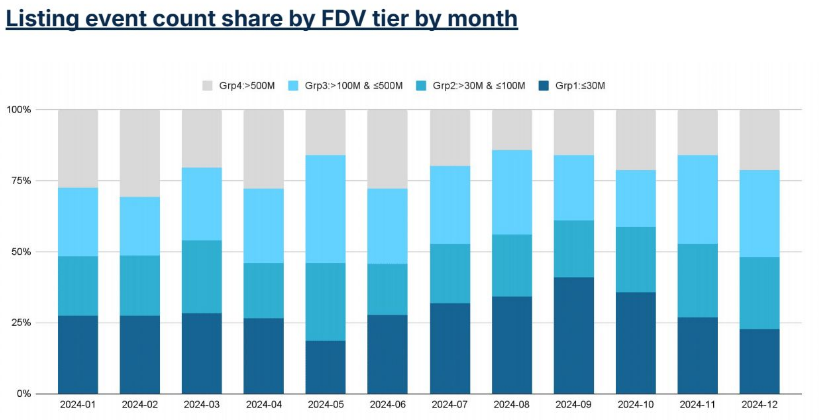
Monthly Listings by FDV Tier
The $500 million+ FDV tier is most sensitive to shifts in market sentiment. Listing activity surged during the February–March rebound, exceeded expectations in April, then contracted until the rally resumed from September to December.
The ≤$30 million FDV tier closely follows overall listing momentum during bull markets but captured a larger share of listings during quieter periods such as June to September.
Listing Price Performance
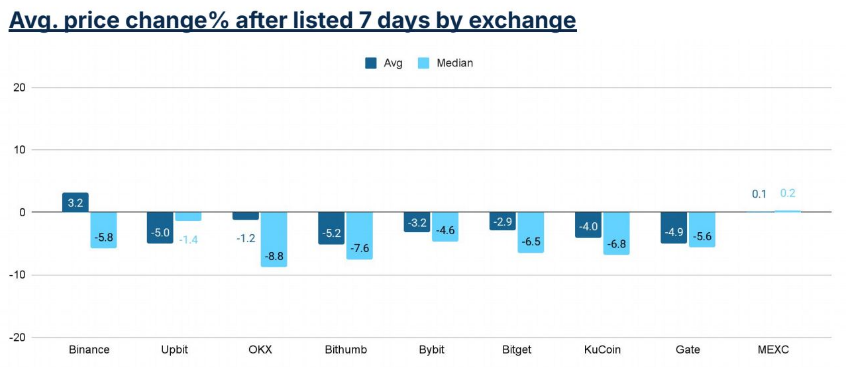
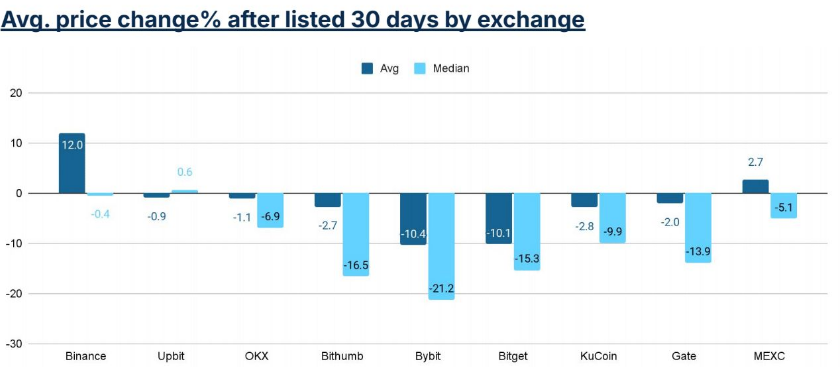
Price performance across exchanges forms a "smile curve," with tokens listed on exchanges at both ends outperforming those in the middle.
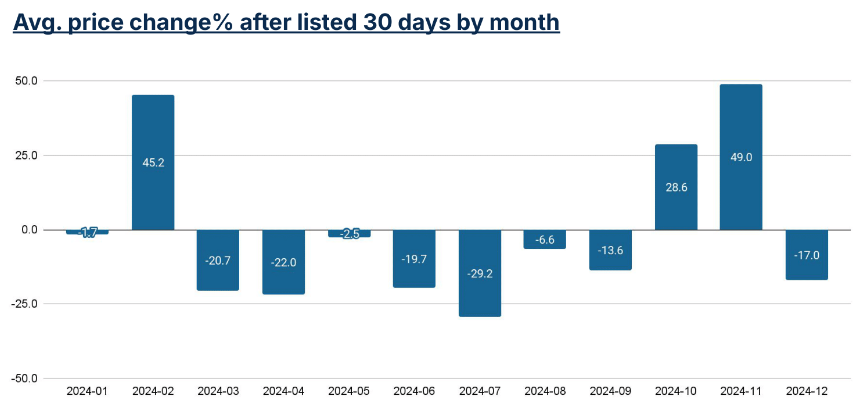
Binance and MEXC, located at the extremes, recorded positive price changes 30 days post-listing, while Bybit and Bitget saw average price declines of about 10%.
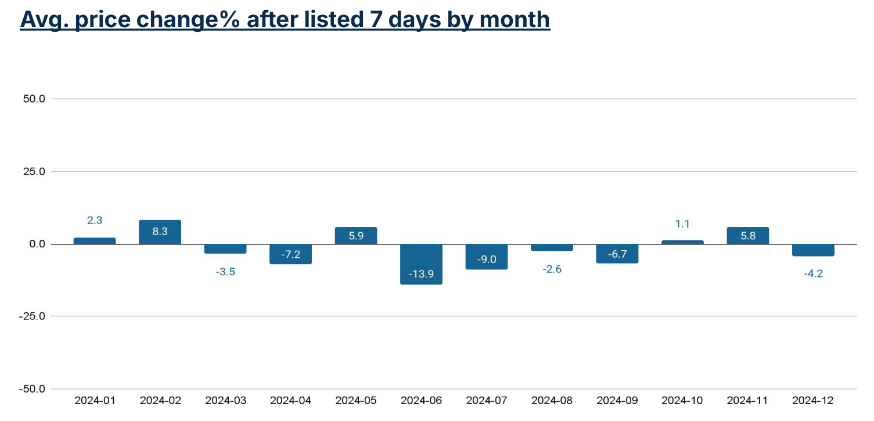
A similar pattern appears in 7-day performance: Binance listings rose ~3%, MEXC listings remained flat, while mid-tier exchanges experienced larger drops.
The median price change is typically lower than the mean, indicating that a small number of listing events dominate overall performance.
Price Performance by FDV Tier
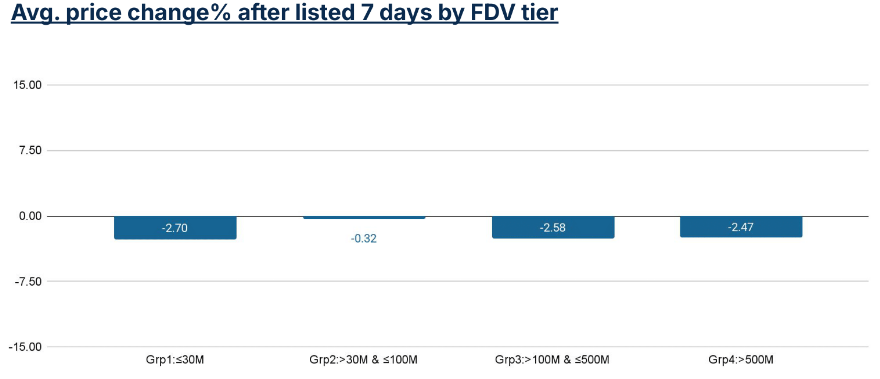
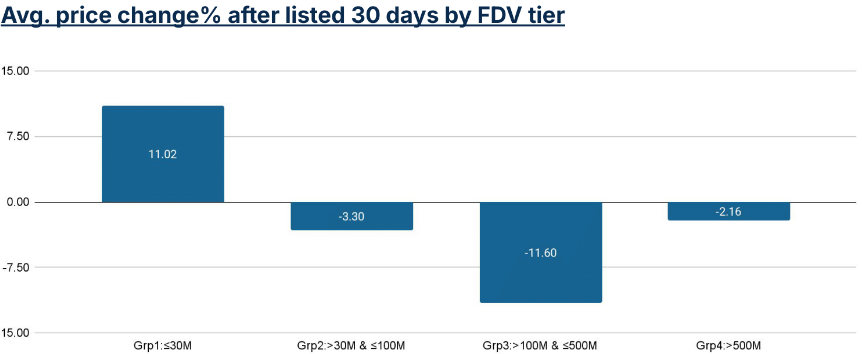
The pattern of 7-day and 30-day price changes varies by FDV tier.
Tokens in the ≤$30 million FDV tier declined in price after 7 days but staged a strong recovery by Day 30, showing the largest contrast among the four tiers. Tokens in the $30 million–$100 million and >$500 million FDV tiers saw mild declines after 7 days and remained relatively stable over 30 days on average.
Tokens in the $100 million–$500 million FDV tier dropped 2% in the first 7 days and fell further to over 11% by Day 30, indicating an overall downward trend after the first week.
Monthly Summary of Listing Price Performance
Over time, price performance is primarily driven by market conditions. During BTC bull markets, listing performance is neutral or positive; during BTC bear markets, it turns negative.
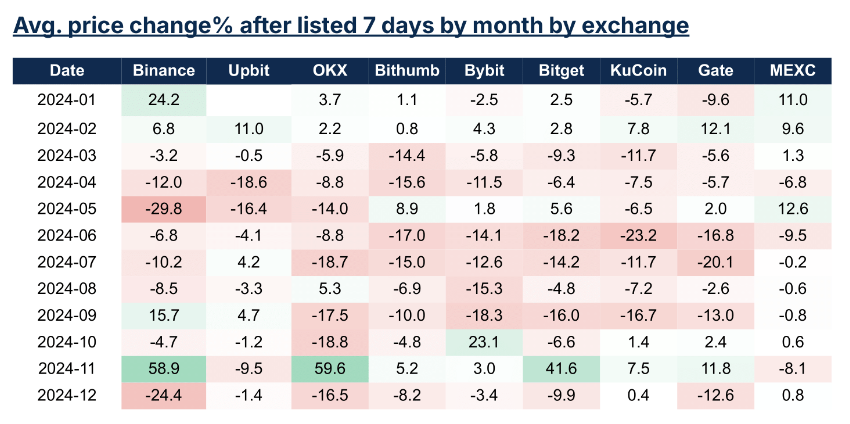
Monthly Price Performance by Exchange
In February, October, and November, most exchanges posted positive price changes, coinciding with strong BTC rallies.
January and May deviated from the broader BTC trend: despite an impending BTC rebound, January listings underperformed; conversely, May listings performed well despite a slow bear market.
Despite neutral market conditions, listings in December underperformed.
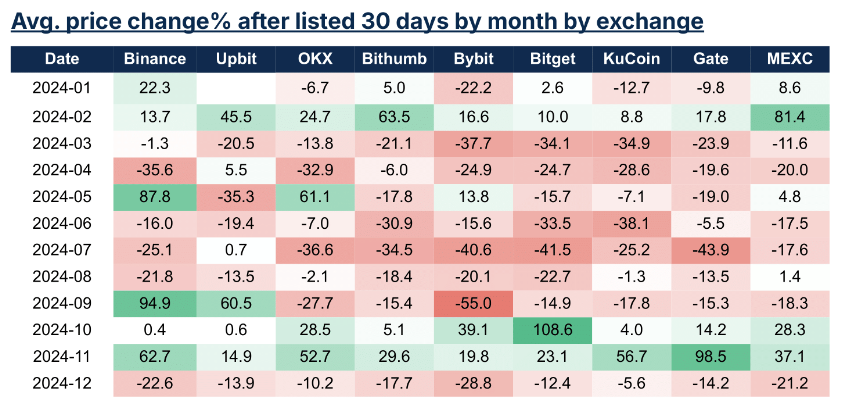
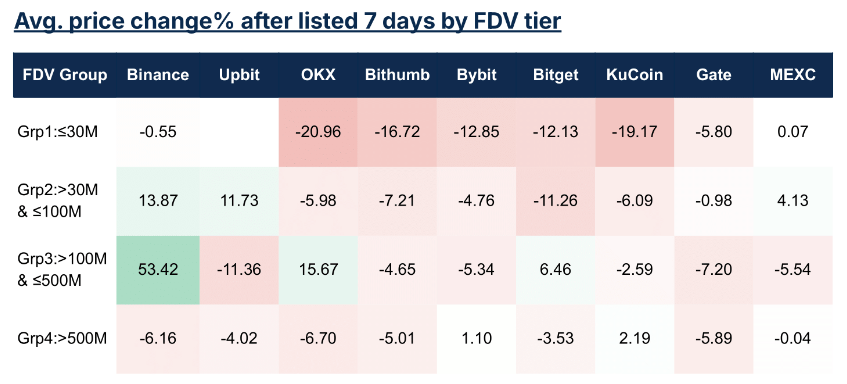
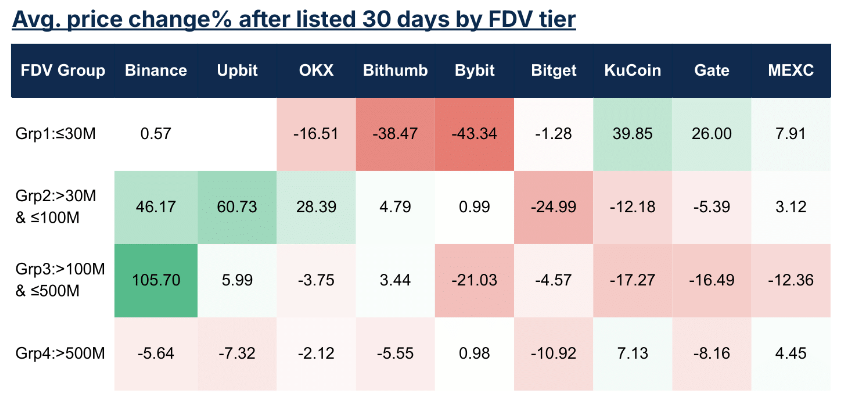
Price Performance by Exchange and FDV Tier
Compared to large exchanges like OKX and Bybit, small-FDV tokens achieve better price performance on mid-tier exchanges such as KuCoin, Gate, and MEXC.
Mid-sized FDV tokens ($30 million–$500 million) perform better when listed on large exchanges than on mid-tier ones. Large-FDV tokens (> $500 million) show consistent performance across exchanges, with minimal price fluctuation from Day 7 to Day 30.
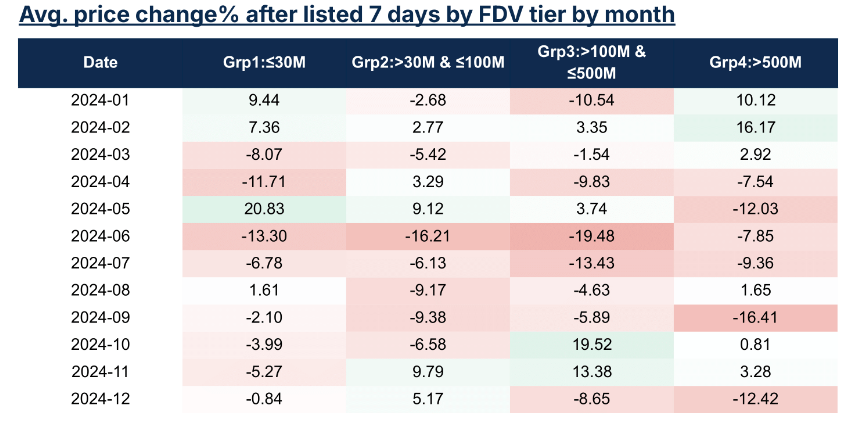
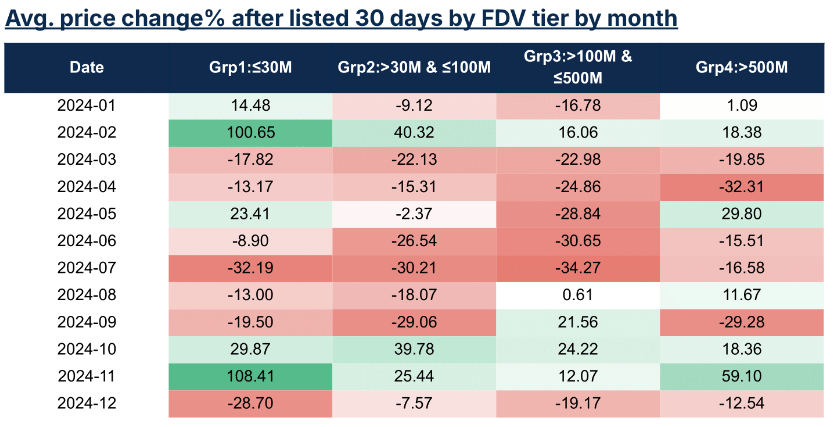
Monthly Price Performance by FDV Tier
Small-FDV tokens show strong price performance, outperforming mid-tier FDV tokens ($30 million–$500 million) in 30-day price change across most months, regardless of bull or bear market conditions.
Mid-tier FDV tokens saw strong 7-day price increases in October and November but still lagged behind other categories by Day 30.
Large-FDV tokens exhibit greater consistency, posting positive 7-day and 30-day price changes in half of the observed months.
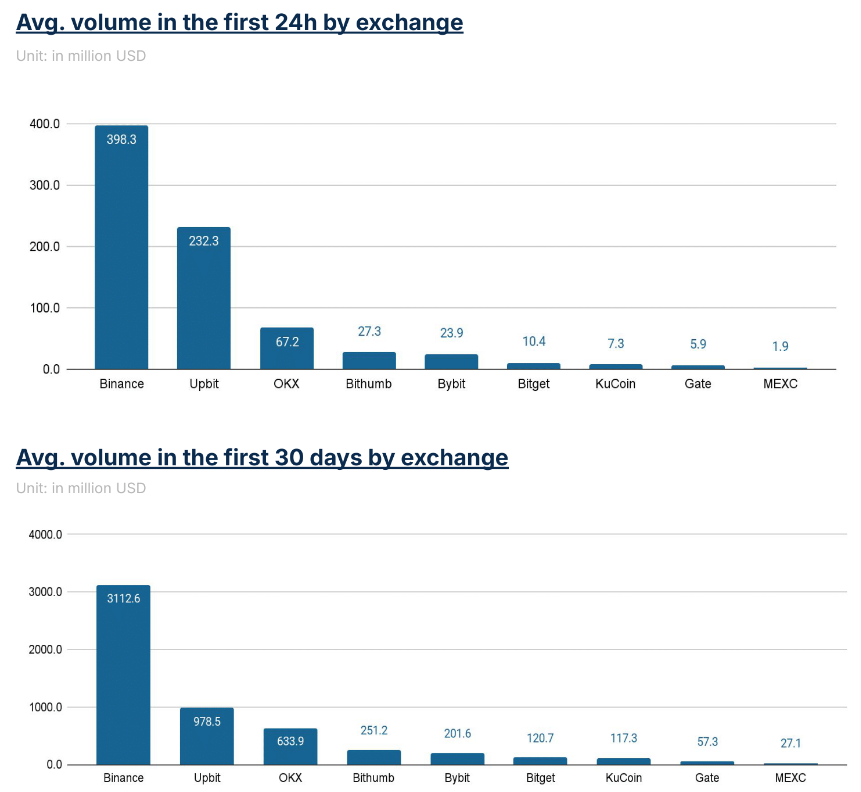
Exchange Trading Volume
Binance leads in trading volume for newly listed tokens, followed by Upbit and OKX. Upbit shows strong initial 24-hour volume, nearly matching Binance, though its 30-day volume settles at levels similar to OKX.
Among mid-tier exchanges, Bybit demonstrates consistently strong volume in both the first 24 hours and over the full 30 days.
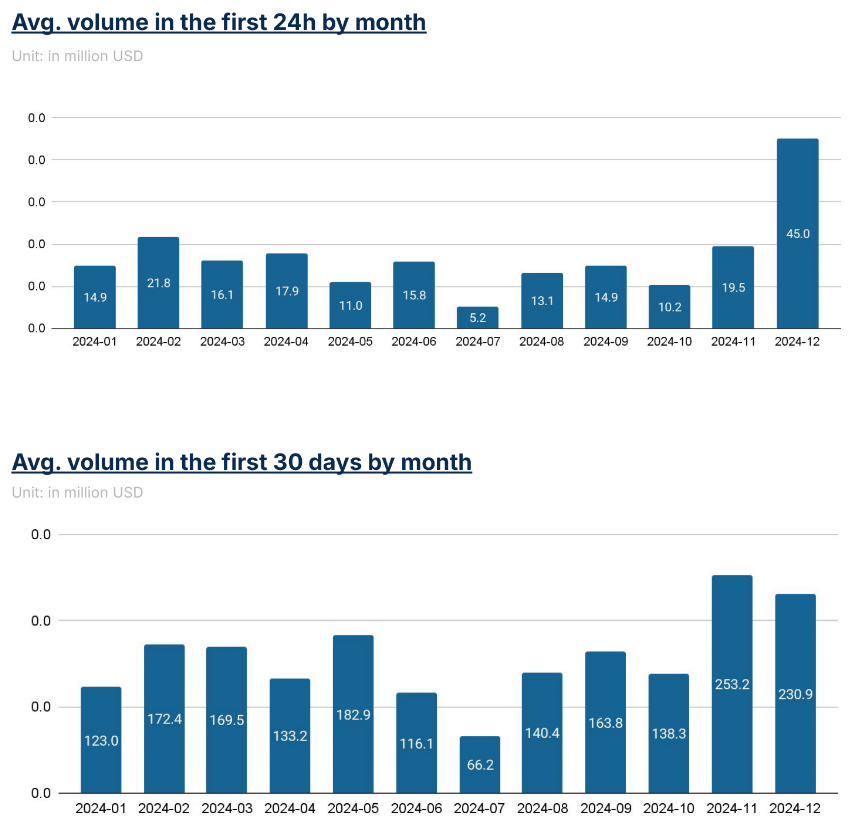
Monthly Volume Summary
Initial listing volumes largely follow the bull/bear cycle, peaking between February–March and September–December.
In April—following the first wave of price increases—listing activity exceeded expectations, but trading volume fell below the 30-day average. This suggests excessive listings during calmer market periods may dilute trading volume for new tokens.
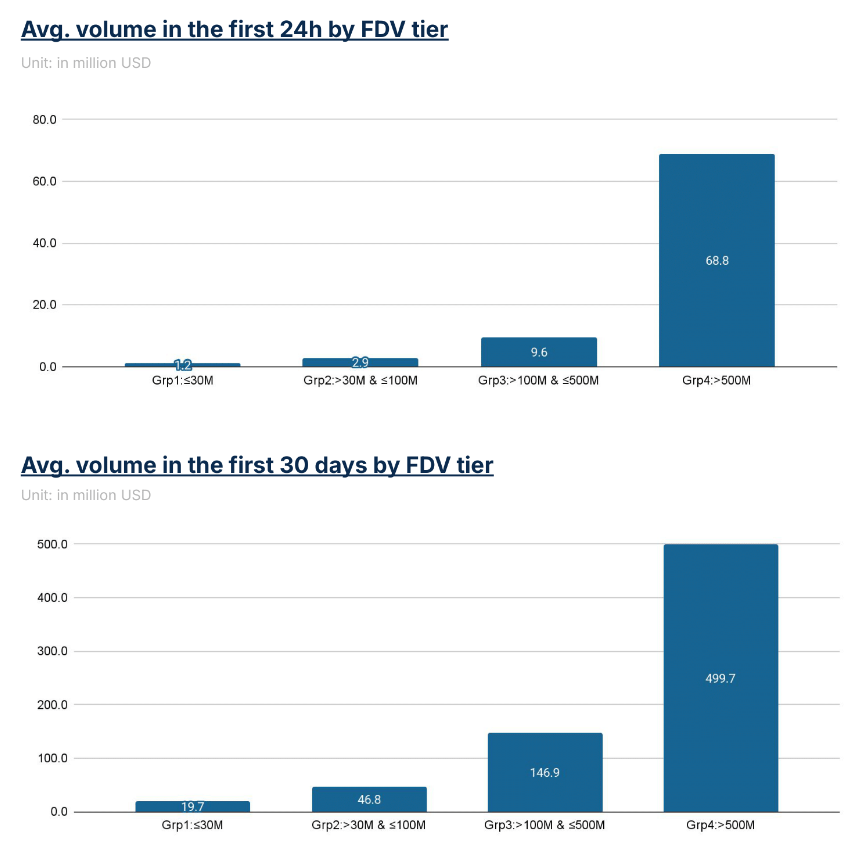
Volume by FDV Tier
Trading volume generally aligns with token FDV tiers. The largest FDV tier sees 60 times more volume in the first 24 hours and 25 times more over 30 days compared to the smallest FDV tier.
Monthly Volume Summary by Exchange
In most months, Binance leads in trading volume for newly listed tokens. Upbit exhibits high variability in initial volume for new listings.
While it leads in 30-day volume in February, July, and December, there are also months where its new listing volume is very low.
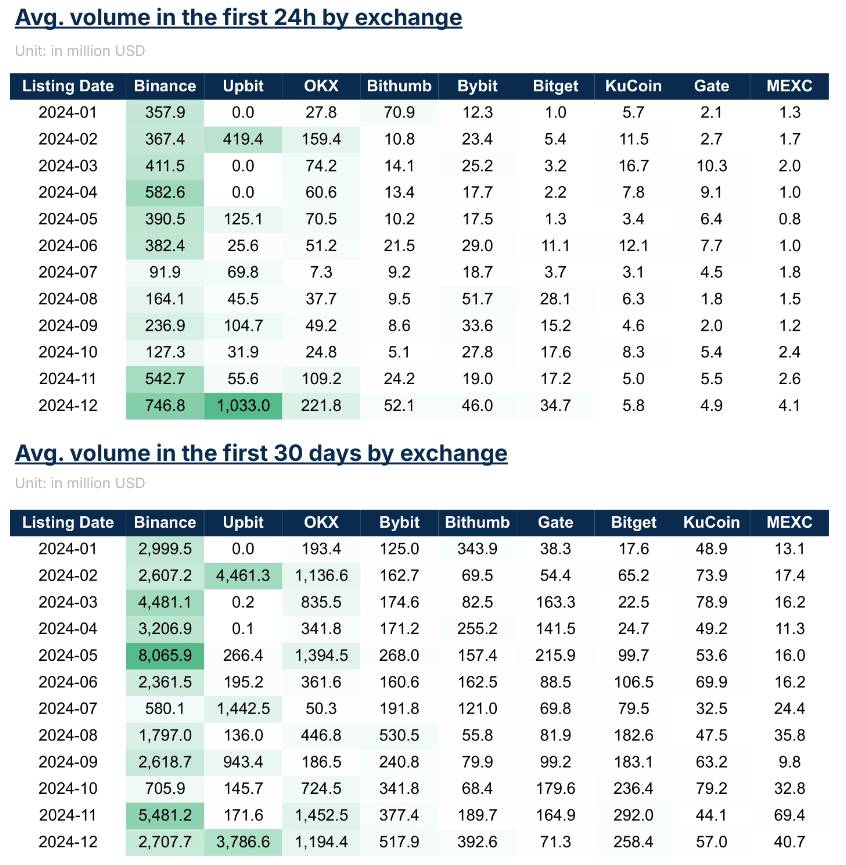
Volume by Exchange and FDV Tier
Binance records the highest listing volumes, concentrated in the $100 million–$500 million FDV tier.
OKX, in contrast, shows significant volume in the mid-tier FDV range ($30 million–$100 million).
Among mid-tier exchanges, Bybit maintains relatively stable volume across all FDV tiers, while others typically concentrate volume in mid-tier FDV tokens.
DEX vs CEX
DEX listings are often seen as complementary to CEX listings. Liquidity pools on DEXs are typically created concurrently with initial CEX listings, allowing users flexibility to trade either on-chain or via CEX. In contrast, exclusive DEX listings are usually associated with a more decentralized approach, commonly used by long-tail tokens with limited mainstream appeal.
However, an increasing number of projects are recently choosing DEXs as their sole initial listing platform, delaying or forgoing CEX listings for some time. To assess the viability and impact of this strategy, this report analyzes relevant data and metrics to compare DEX and CEX listings.
To ensure objective comparison, a DEX listing is defined as a token that exclusively maintains liquidity on decentralized exchanges for at least 30 days. For CEX listings, the analysis focuses on primary listing events—those introducing the token to a centralized exchange as its main trading venue. To avoid skewing results from long-tail tokens, the analysis is limited to tokens with FDVs between $30 million and $500 million, ensuring balance between the two groups.
For measuring price performance, the percentage change from Day 2 to Day 7 and Day 2 to Day 30 is used, rather than from listing day to Day 7 or 30. This adjustment accounts for differing price discovery mechanisms between CEX and DEX on listing day, which would otherwise invalidate direct comparisons. For volume, a consistent method is maintained, using 24-hour and 30-day trading volumes as key metrics.
Listing Event Summary: DEX vs CEX
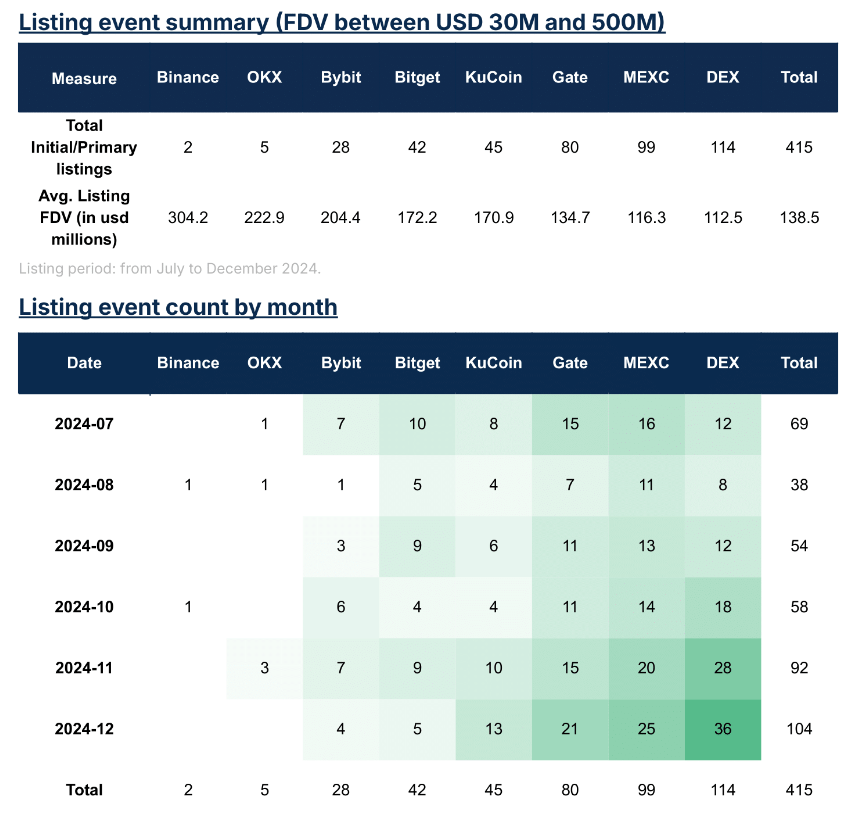
The analysis sampled 415 primary listing events in the second half of 2024, focusing on tokens with FDVs between $30 million and $500 million. Of these, 114 were classified as DEX-first listings, meaning the token was listed exclusively on DEXs during its first month.
In August, after a slowdown sensitive to market momentum, DEX-first activity rebounded in Q4. In Q3, DEX-first listings accounted for less than 20% of new tokens, but by November and December, this share surged to over 30%.
Most CEX listings in this analysis were concentrated on mid-tier exchanges. In contrast, Binance and OKX had only a few listing events.
Price Change at Initial Listing: DEX vs CEX
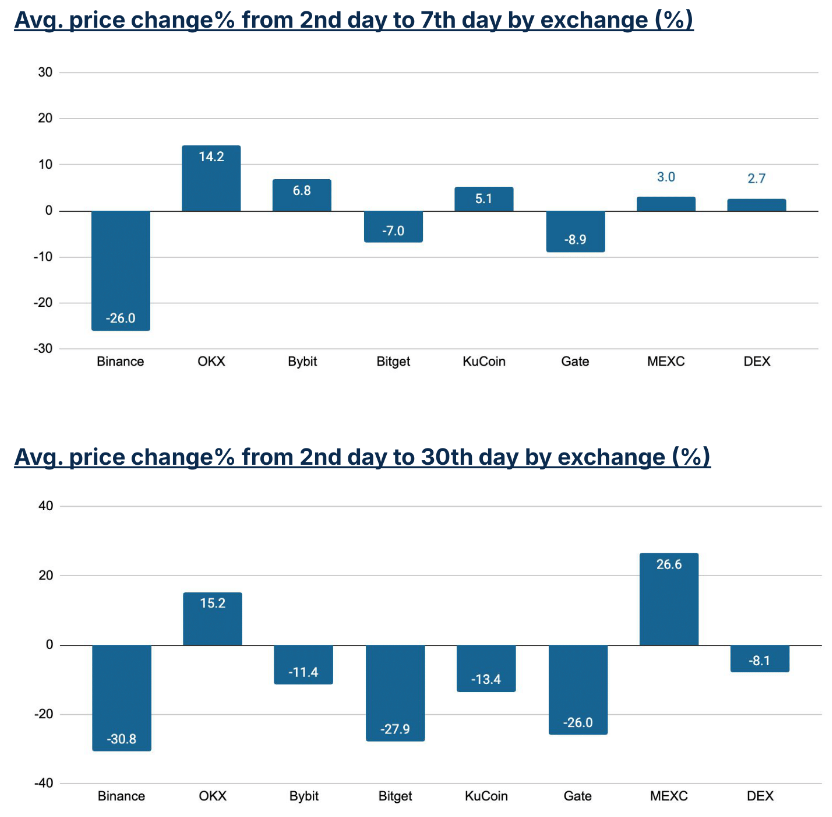
Among mid-tier CEXs, performance from Day 2 to Day 7 was mixed. By Day 30, all listed tokens except those on MEXC showed negative price changes.
In contrast, DEX-first tokens posted positive growth by Day 7 and only slight declines by Day 30, outperforming most mid-tier CEX listings.
Among large CEXs, OKX led in price performance, with tokens rising ~14% from Day 2 to Day 7 and maintaining those gains at 30 days. However, due to limited data, Binance and OKX results should be interpreted cautiously.
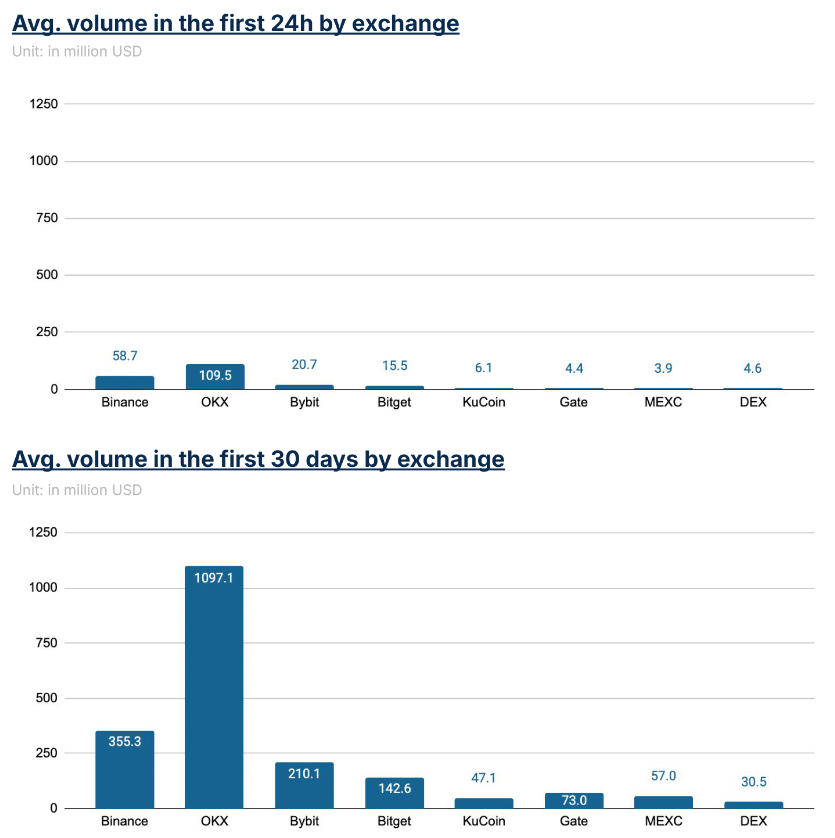
Average Trading Volume at Initial Listing: DEX vs CEX
DEX trading volume is comparable to mid-tier CEXs like KuCoin, Gate, and MEXC, while Binance and OKX show higher average volumes.
The concentration of trading volume in the first 24 hours shows a similar pattern between DEXs and CEXs, suggesting aligned market attention trends.
This volume performance, combined with post-listing price trends, indicates that DEX-first listings can match the impact of mid-tier CEX listings on token performance.
Token Listing Tier Analysis
The 415 sampled listing events covered 238 unique tokens. Of these, 126 were initially listed exclusively on DEXs, while the rest debuted on mid-tier or large centralized exchanges. Note that DEX-listed tokens included in this analysis are limited to those indexed on CoinMarketCap.
Among tokens initially listed on DEXs, about 16% were later listed on a CEX, primarily mid-tier exchanges. However, only 2% of DEX-first tokens eventually gained support on top-tier CEXs such as Binance, Upbit, or OKX. For tokens that debuted on mid-tier CEXs, approximately 3% later appeared on high-FDV CEXs—a probability similar to that of DEX-first tokens.
These findings suggest that while DEX-first tokens have a reasonable chance of being listed on a CEX, they are most likely to land on mid-tier platforms. Regardless of whether a token starts on a DEX or a mid-tier CEX, the likelihood of a mid-FDV token reaching a top-tier CEX remains low.
Join TechFlow official community to stay tuned
Telegram:https://t.me/TechFlowDaily
X (Twitter):https://x.com/TechFlowPost
X (Twitter) EN:https://x.com/BlockFlow_News