Changes in crypto companies from data: Coinbase transaction revenue accounts for over 50%, USDC weekly trading volume reaches $24 billion
TechFlow Selected TechFlow Selected
Changes in crypto companies from data: Coinbase transaction revenue accounts for over 50%, USDC weekly trading volume reaches $24 billion
Binance's weekly trading volume reached $24 billion in January this year, accounting for 49% of the global USDC trading volume.
Author: The Kaiko Research Team
Compiled by: TechFlow
As North America swiftly resolves tariff disputes, global markets are gradually stabilizing. Meanwhile, the U.S. is actively exploring the establishment of its own sovereign wealth fund, while crypto regulator David Sacks optimistically predicts that digital assets are about to enter a "golden age."
This week, we will explore the following areas in depth:
-
Coinbase's market performance ahead of earnings release
-
Significant growth in USDC trading volume on Binance
-
Altcoin market liquidity trends
How Crypto Data Becomes a Key Tool for Predicting Earnings Performance
Coinbase Earnings Preview: Market Data Provides Early Insights
Coinbase will release its Q4 2024 earnings report this Thursday (February 13). Prior to the announcement, analyzing market data can offer preliminary clues about its performance. While analyst expectations and forward guidance directly impact stock prices, crypto market data often serves as a leading indicator of exchange health.
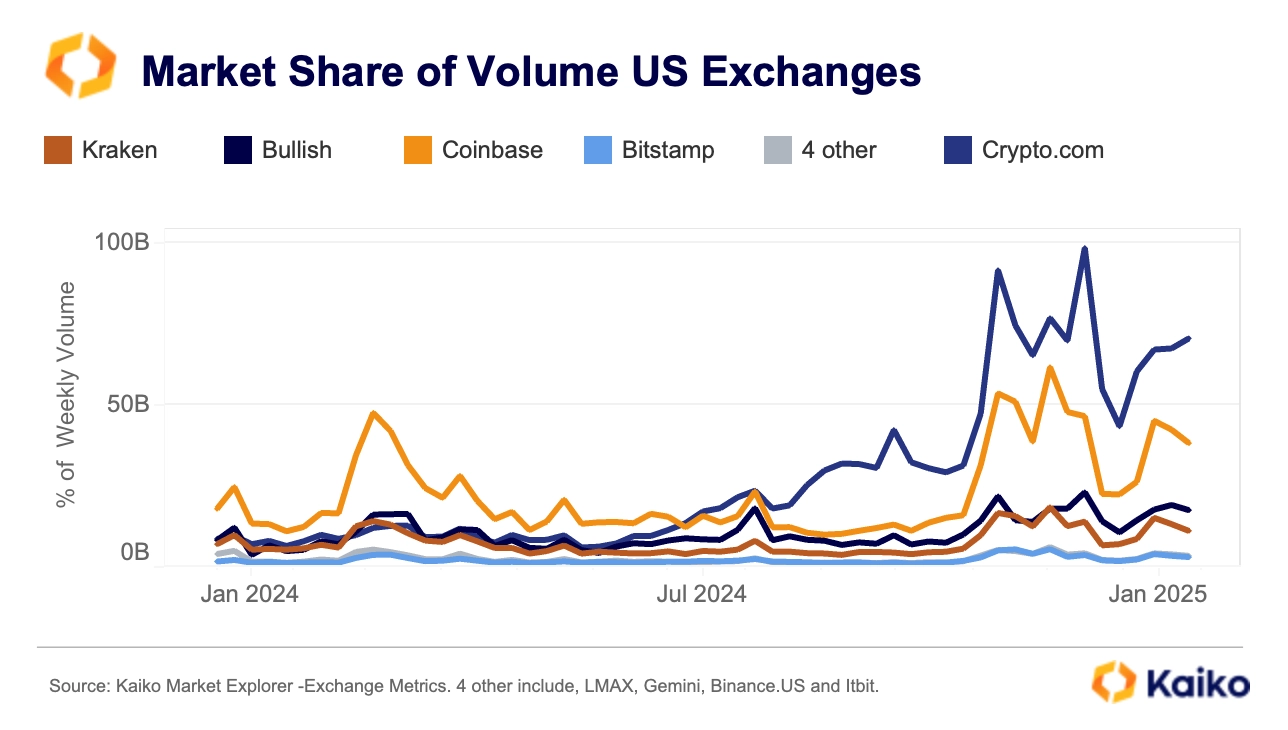
Data shows that Coinbase's weekly trading volume in Q4 reached the highest level in two years. This trend indicates that the platform has significantly benefited from the post-U.S. election market rebound.
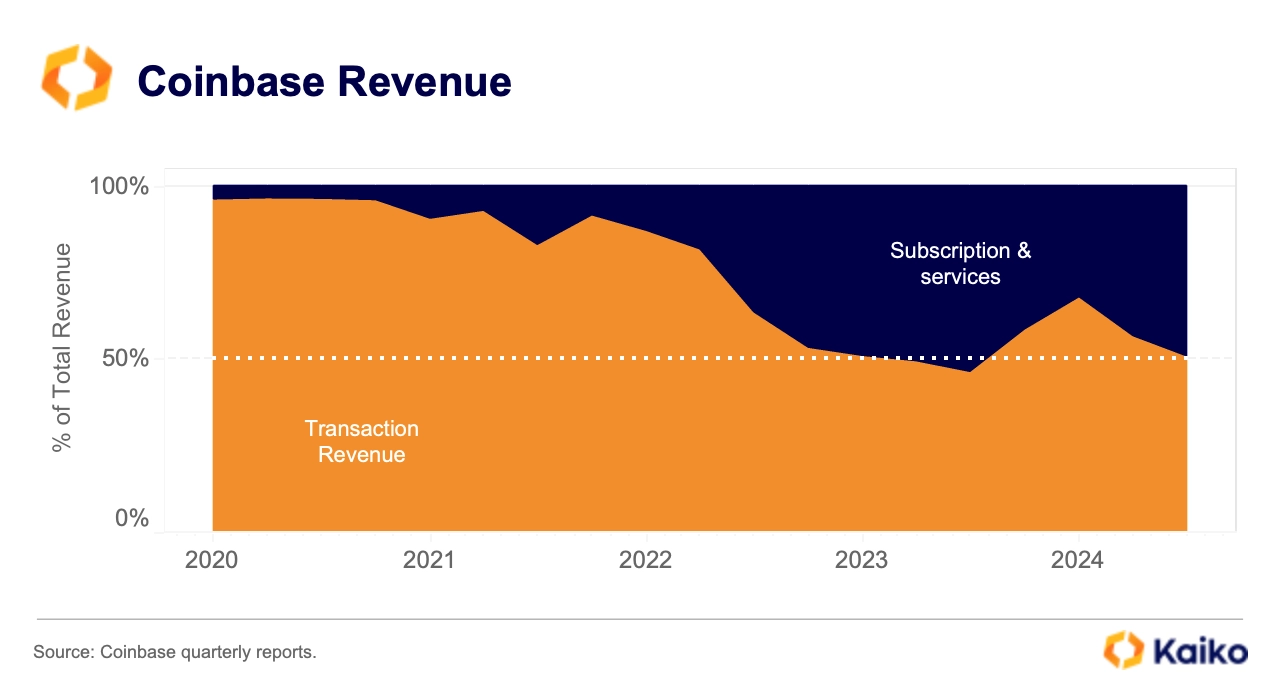
In recent years, Coinbase has diversified its revenue streams, with its "Subscription and Services" segment—including staking rewards, custody fees, and USDC interest—increasingly contributing to total revenue.
However, trading revenue remains Coinbase's core business. Except for one quarter in 2023, trading revenue has consistently accounted for over 50% of total revenue.
It should be noted that subscription and service income is closely tied to overall crypto market activity and does not effectively diversify risk. Therefore, during periods of low trading activity or falling market prices, subscription and service income is also significantly affected.
For example, in Q3 2024, due to declines in ETH and SOL prices, Coinbase's blockchain reward income fell by 16%.
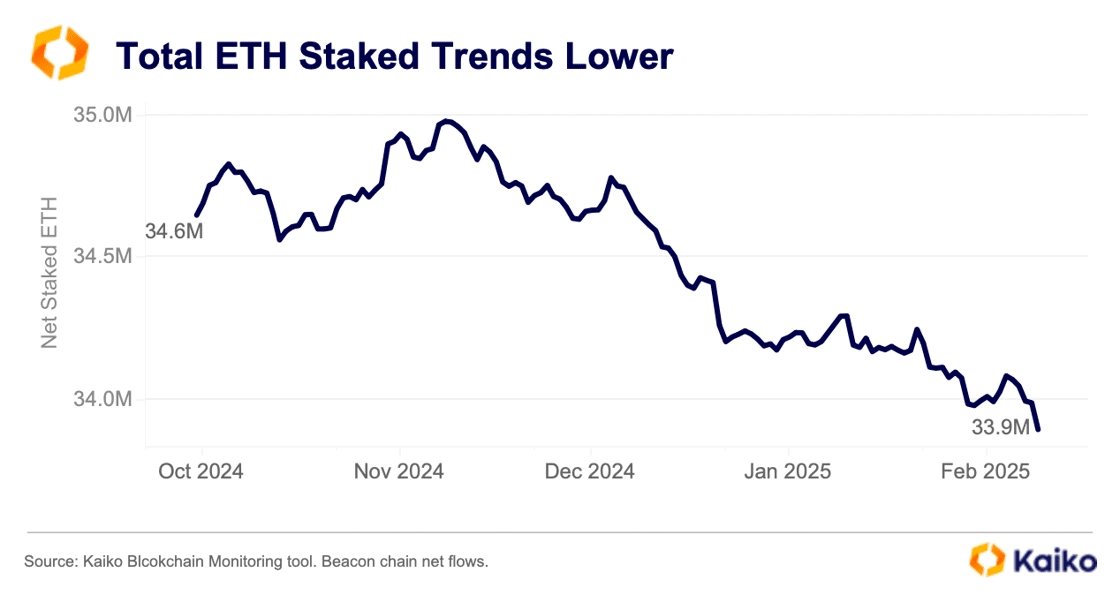
Kaiko's blockchain monitoring tools reveal that net flow on the Ethereum Beacon Chain declined in Q4 2024. As the second-largest ETH staking entity after Lido, Coinbase was one of the main contributors to this decline. Data shows that Coinbase's share of the staking market dropped by 3.8% over the past six months, with a net outflow of 1.29 million ETH during the same period.
This trend suggests that although Coinbase still holds a significant position in staking, its market share is being gradually eroded by competitors, potentially negatively affecting its long-term revenue growth and competitiveness.
Although rising prices of ETH and SOL during the quarter partially offset the impact of reduced staking, overall data still indicates a likely decline in Coinbase's blockchain reward income in Q4. Particularly in the ETH staking market, Coinbase's 3.8% market share loss has had a direct impact on staking-related revenue.
Coinbase's commercial agreement with Circle provides it with a steady source of income from USDC-related activities. Notably, Circle's new partnership with Binance and record-breaking USDC trading volumes may partially offset the decline in staking income. This offers Coinbase additional revenue cushioning, especially when both staking and trading revenues are under pressure.
Retail traders, who pay the highest trading fees, have seen their trading volume share drop sharply from 40% in 2021 to just 18% today. Although Coinbase's subscription services (such as blockchain rewards and custody) have grown, the loss of retail traders continues to exert significant pressure on its trading revenue.
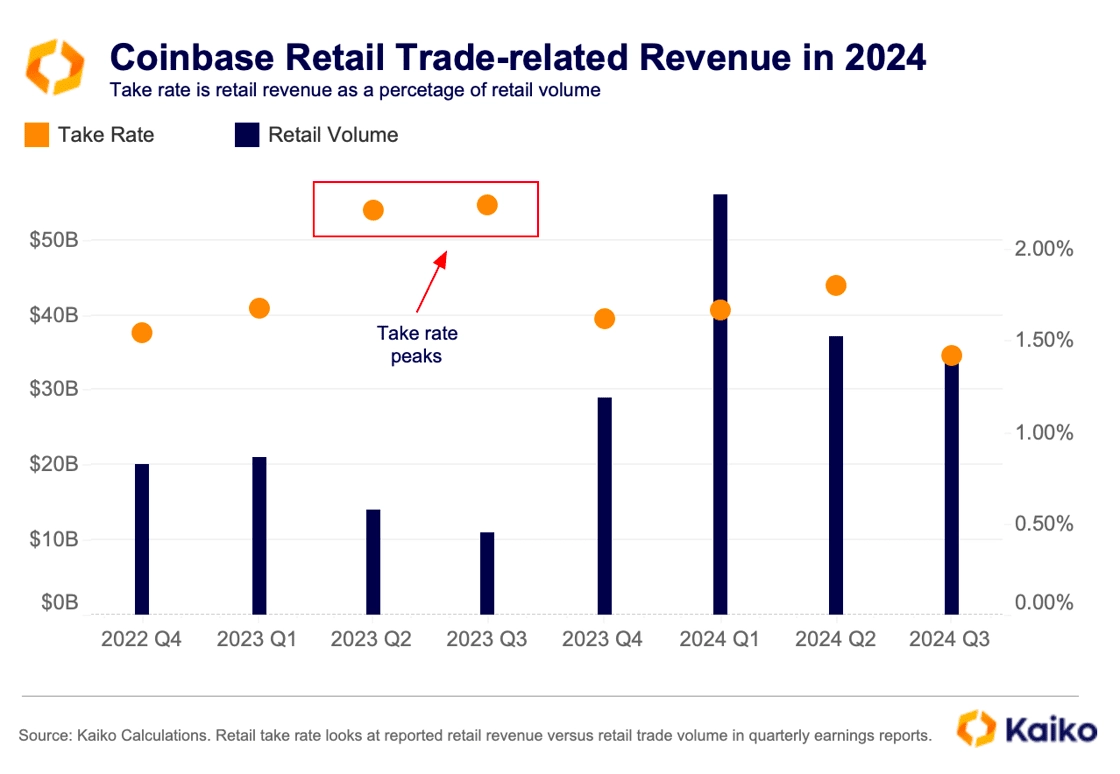
Since peaking in mid-2023, Coinbase's "take rate" (the proportion of revenue derived from retail traders) has fallen to its lowest level since the Terra Luna collapse in the first half of 2022.
This revenue decline coincides with intensifying competition in the U.S. market, where some platforms attract users by drastically lowering trading fees, further increasing pressure on platforms like Coinbase.
Although Coinbase remains one of the most liquid exchanges in the U.S., with a fee structure that relatively favors market makers over takers, the shrinking retail trader base undoubtedly exacerbates pressure on this revenue stream.
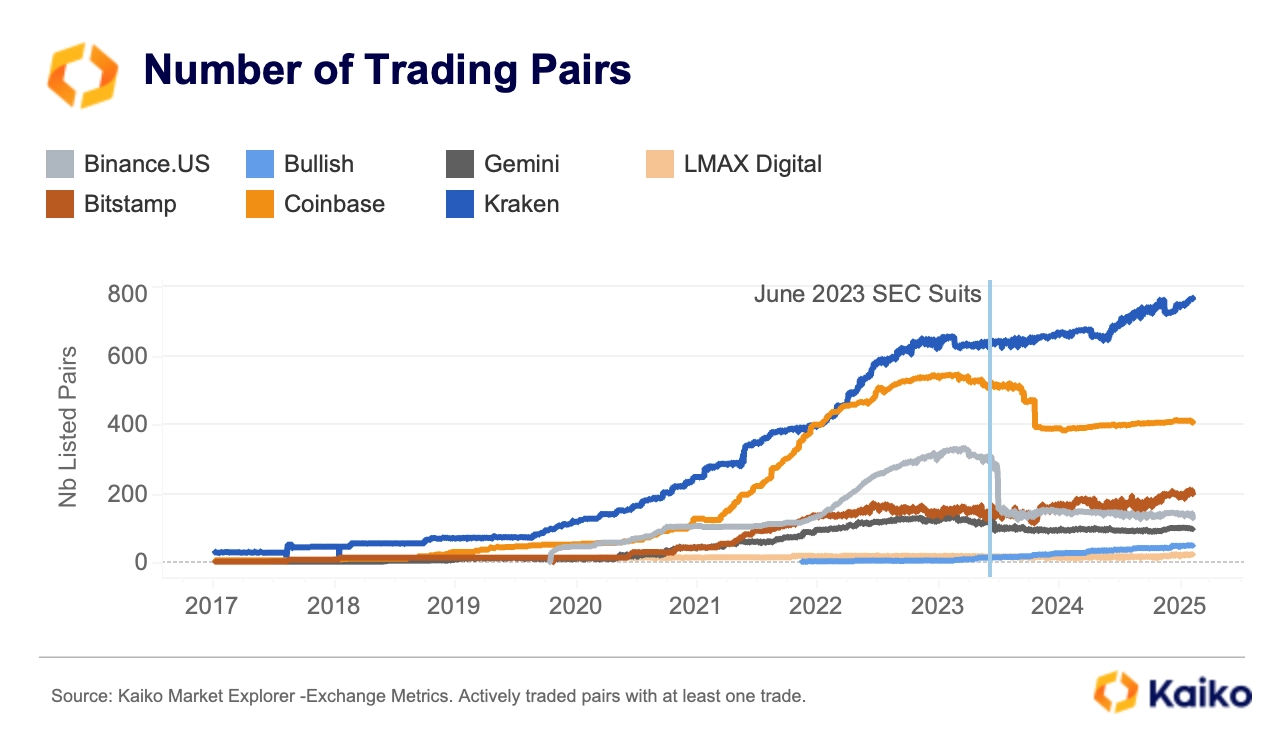
Furthermore, despite continuously expanding its product offerings and gaining more cross-product synergies, Coinbase’s listing of new assets has clearly slowed due to the strict U.S. regulatory environment.
The chart below shows that since the SEC filed lawsuits against Binance.US and Coinbase in June 2023, both platforms have experienced a significant decline in the number of active trading pairs. However, if the regulatory environment improves in the future, Coinbase may accelerate listings again, which could enhance its appeal to retail traders.
Data Points
USDC Trading Volume Hits Record High: Binance’s Dominance
Binance has now become the world's largest USDC trading market, achieving a weekly trading volume of $24 billion in January 2025, accounting for 49% of global USDC trading volume—the highest market share since September 2022. This significant growth stems from Binance’s strategic partnership with Circle at the end of 2024, aimed at driving broader adoption of USDC.
In contrast, Bybit’s market share has sharply declined, falling from 38% in October 2023 to just 8% today.
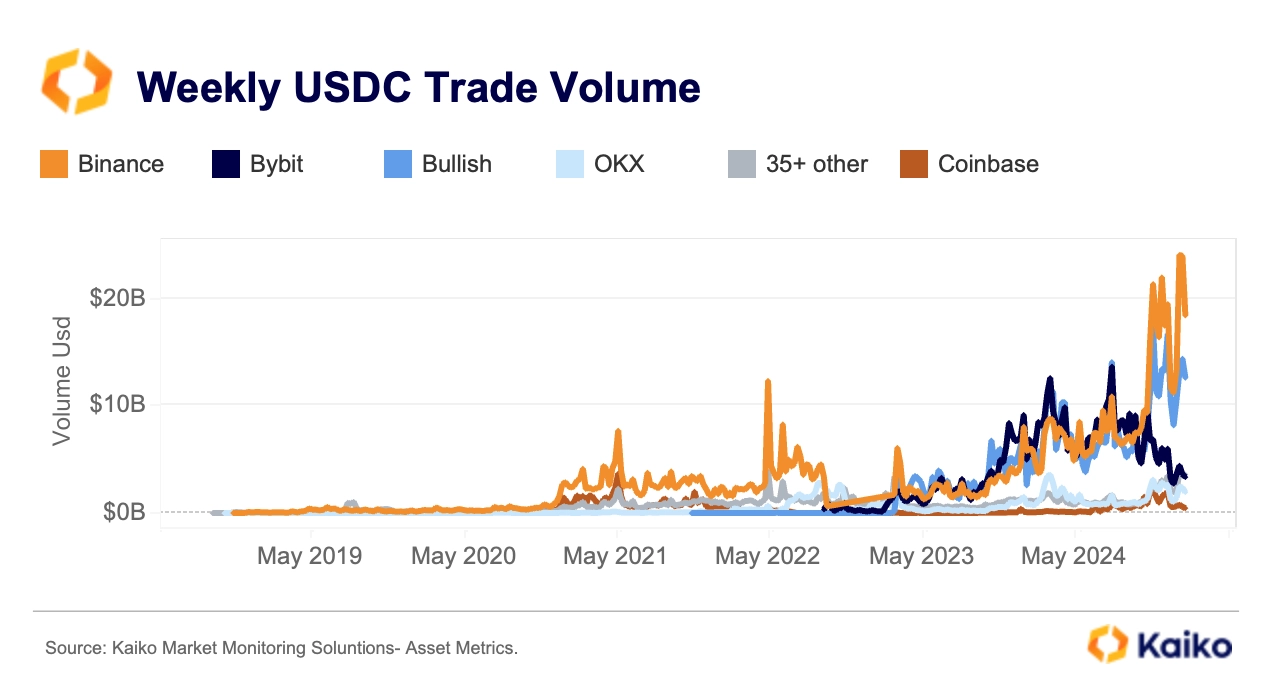
Meanwhile, Bullish has rapidly emerged as a major competitor to Binance, capturing 32% market share.
This shift in market dynamics also reflects intensified competition among stablecoins. Data shows that the proportion of newly listed trading pairs quoting USDT has dropped from 77% in 2023 to below 63% in 2024, and so far in 2025, it has further declined to 50%.
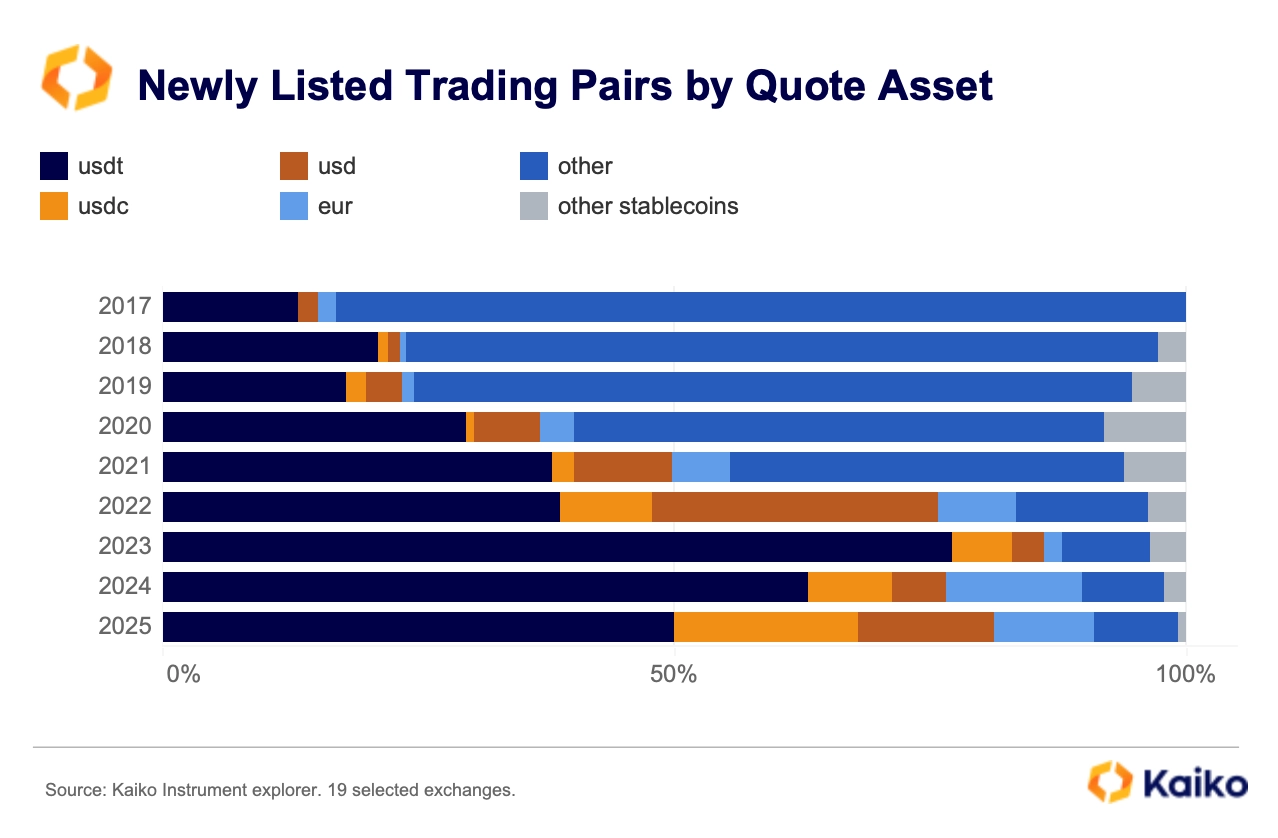
Notably, euro-denominated trading pairs are gradually gaining market attention. This may indicate a recovery in the EU market following the implementation of MiCA regulations in 2024. For a more detailed analysis of euro market trends, please refer to our latest research report.
Altcoin Liquidity: Centralization Trend and Rise of Small-Cap Tokens
Since the U.S. election, market sentiment and outlook for altcoins have clearly improved. This positive sentiment has driven a surge in new altcoin ETF applications and boosted trading activity.
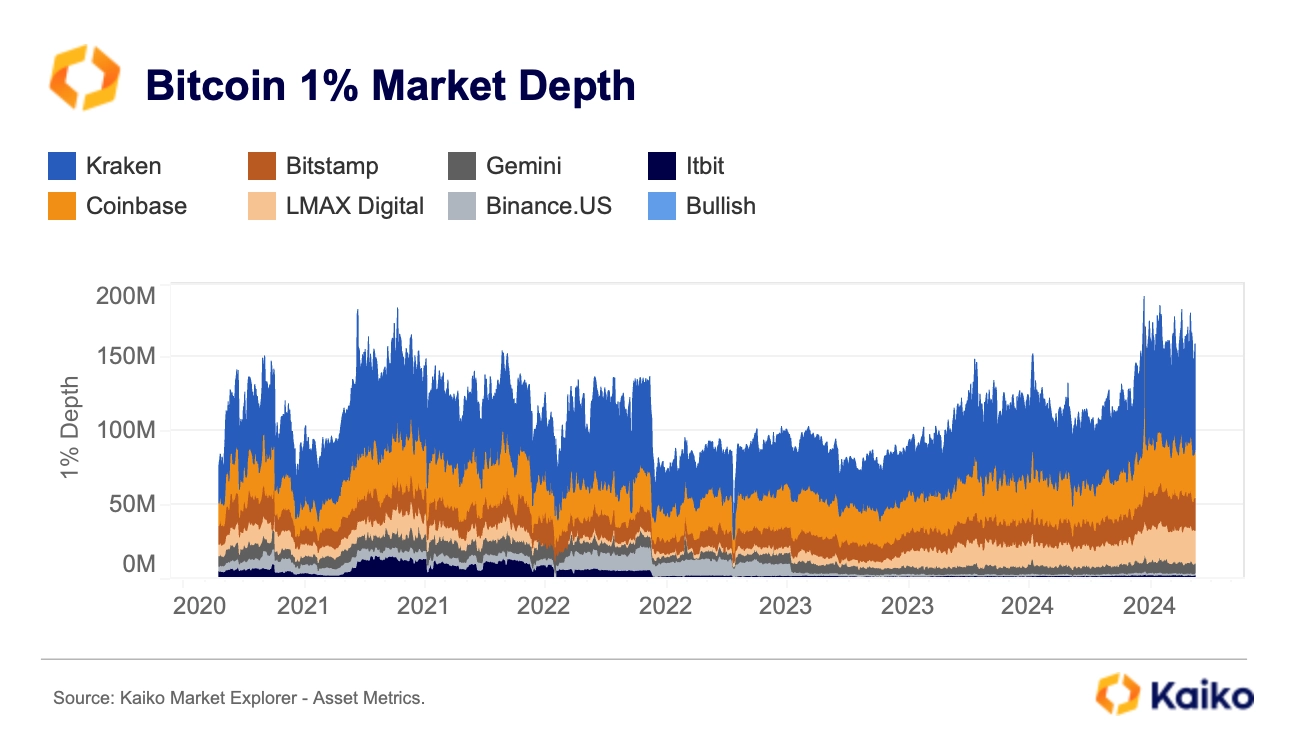
Data shows that the daily altcoin liquidity metric (measured by 1% market depth of the top 50 tokens) has nearly doubled since September 2023, reaching $960 million.
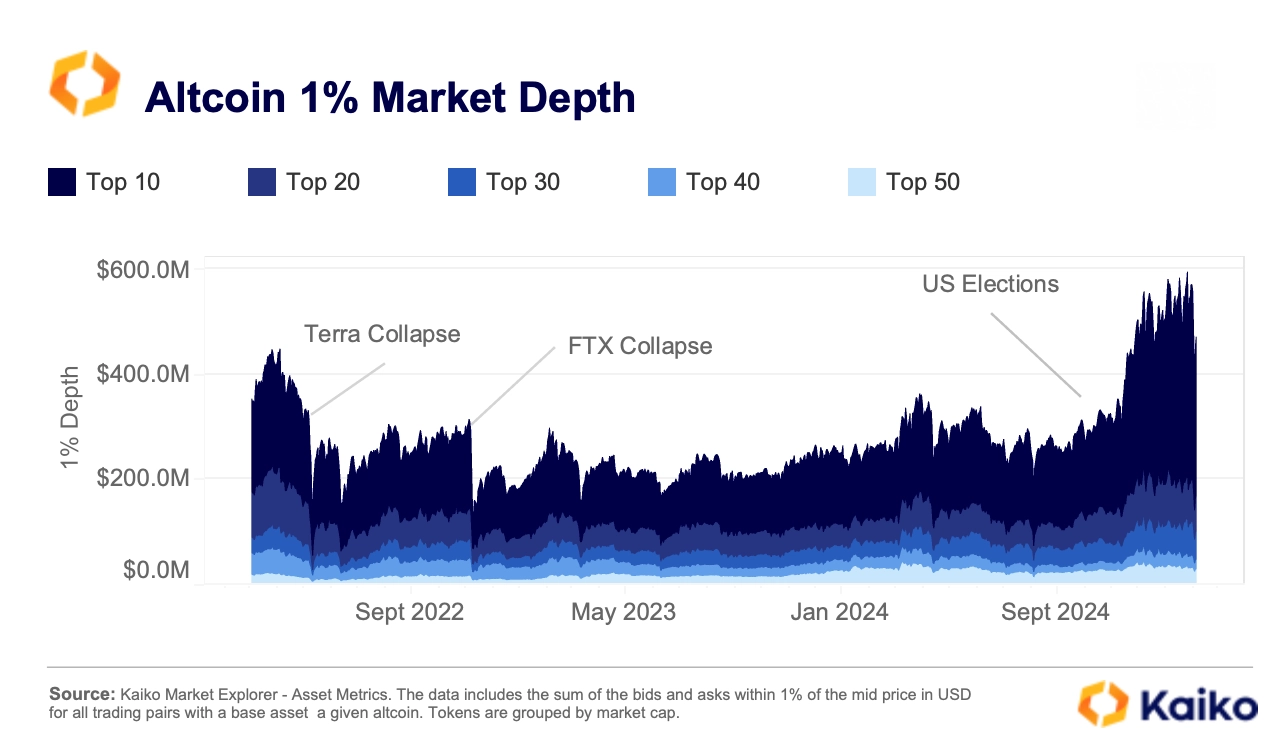
However, liquidity distribution remains uneven and highly concentrated among the top 10 alts, which account for 64% of total market depth. In comparison, mid-cap tokens (ranked 20–30) have seen a decline in liquidity share, while small-cap tokens (ranked 50) have shown surprising growth, even surpassing higher-market-cap groups (ranked 40) in liquidity share.
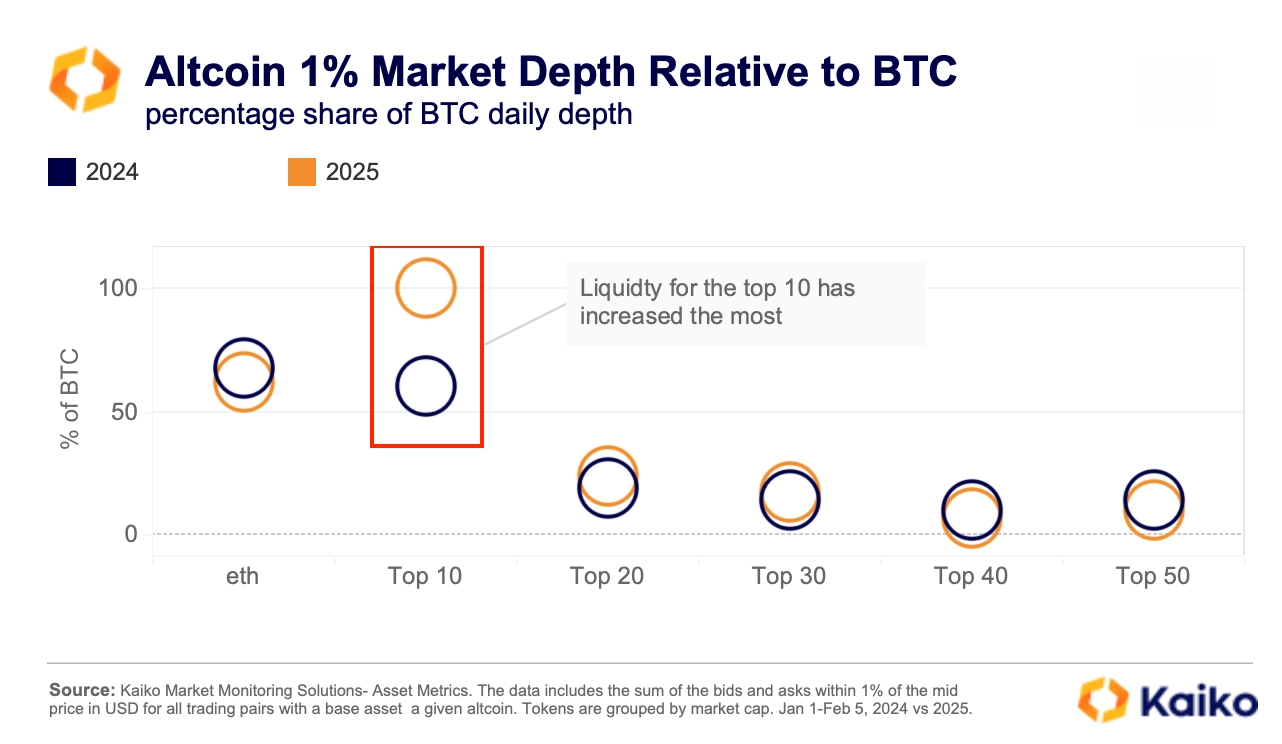
Nonetheless, market liquidity remains highly concentrated, with the top 10 alts occupying 64% of total market depth. In contrast, mid-cap tokens (ranked 20–30) have seen reduced market share, while small-cap tokens (top 50) have unexpectedly grown, with liquidity share even exceeding that of higher-market-cap token groups (top 40).
Join TechFlow official community to stay tuned
Telegram:https://t.me/TechFlowDaily
X (Twitter):https://x.com/TechFlowPost
X (Twitter) EN:https://x.com/BlockFlow_News