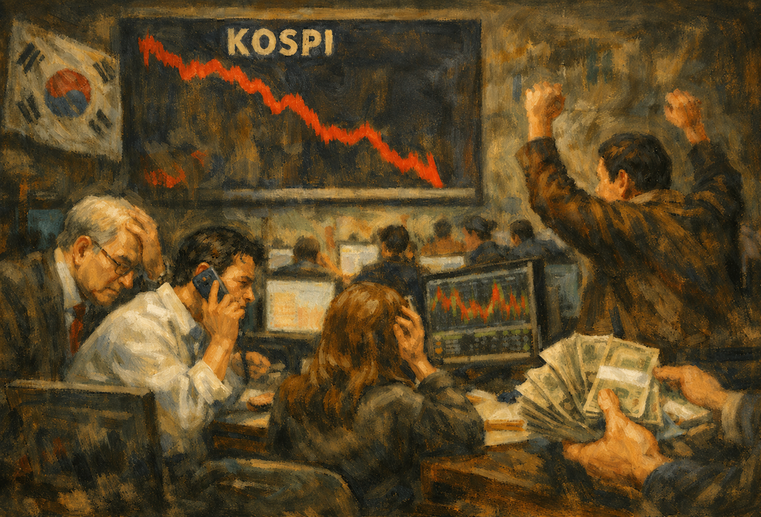
Does the crypto market need to exit at the top? Nearly 20% of indicators have already peaked and started to decline
TechFlow Selected TechFlow Selected
Does the crypto market need to exit at the top? Nearly 20% of indicators have already peaked and started to decline
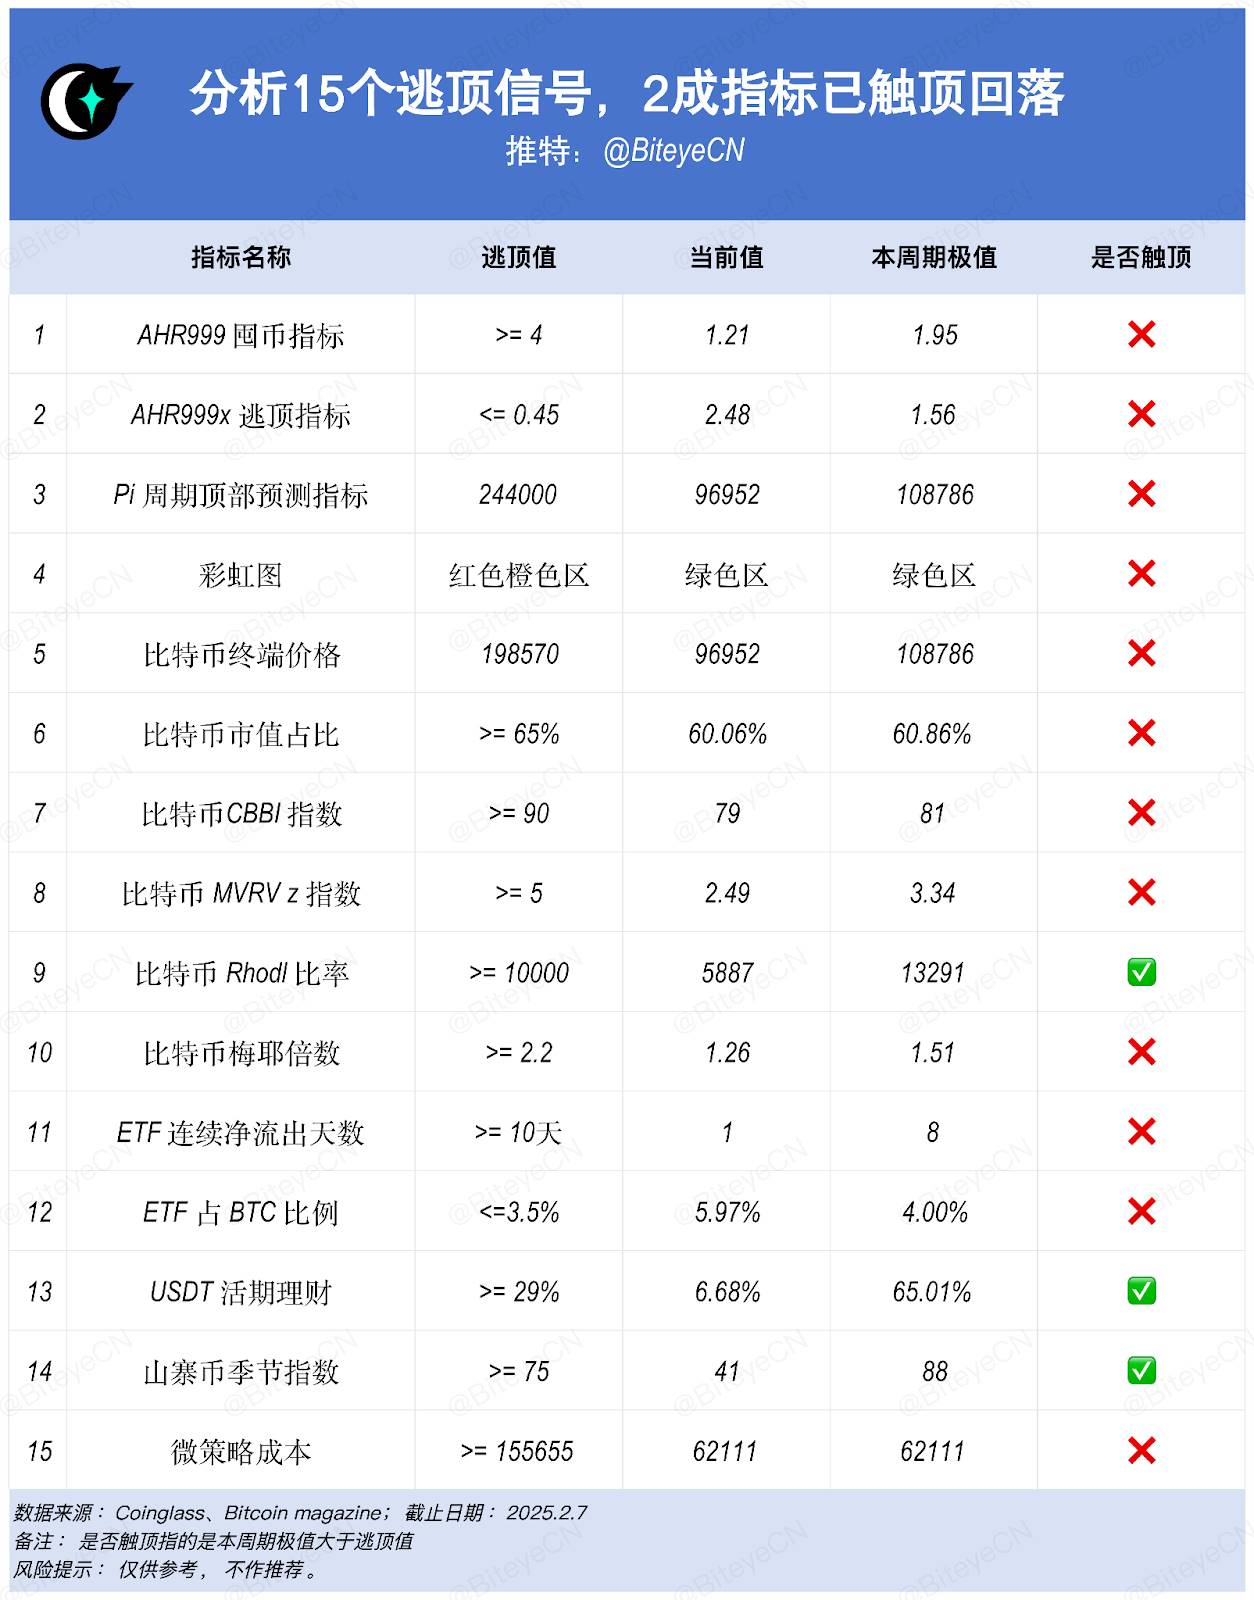
This article analyzes 15 commonly used market peak indicators and finds that one-fifth of them have already peaked in 2024.
 Navigating Web3 tides with focused insights
Author: Viee, Core Contributor at Biteye
Every bull market not only creates wealth but also generates countless illusions of wealth. When the market is euphoric, few can calmly and elegantly "exit at the top." Facing a volatile market with sharp rises and falls, knowing when to exit near peak levels—avoiding asset erosion from deep corrections—requires comprehensive analysis of multiple market indicators.
In this article, Biteye analyzes 15 commonly used top-exit indicators and finds that one-fifth of them have already entered the exit zone in 2024: Bitcoin Rhodl Ratio, USDT money market rates, and Altcoin Season Index. Given this, how should we respond to future market developments?
1. Indicator Introduction
1. AHR999 HODL Indicator
This indicator was created by Weibo user ahr999 to help Bitcoin dollar-cost averaging (DCA) investors make strategic timing decisions. It reflects both short-term DCA returns and the deviation of Bitcoin's price from its expected valuation.
Indicator ranges:
-
>4: Significantly reduce holdings
-
1.2–4: Watch zone, remain cautious
-
0.45–1.2: DCA zone, gradually build positions
-
<0.45: Strong accumulation zone
🔥 Current status: The indicator reads 1.21, not yet at peak, within the watch zone—caution advised.
Link: https://www.coinglass.com/zh/pro/i/ahr999
2. AHR999 Top-Exit Indicator
The AHR999 top-exit indicator is a sister metric to the HODL indicator, specifically designed to identify market tops. It gauges market overheating by measuring price deviation from long-term trend lines. It accurately signaled the tops in both the 2017 and 2021 bull markets, making it a key tool to avoid buying at peaks.
Indicator range:
-
<=0.45: Severely overheated, consider exiting
🔥 Current status: The indicator reads 2.48, and no top signal has appeared in this cycle.
Link: https://www.coinglass.com/zh/pro/i/ahr999-escape
3. Pi Cycle Top Indicator
The Pi Cycle Top Indicator predicts potential market peaks by comparing the 111-day moving average to the 350-day moving average. Historically, when these averages cross, Bitcoin prices are typically near a cycle top, signaling a potential market reversal.
Signal characteristics:
-
Crossover: Top signal triggered
-
Rapid divergence: Bearish outlook
-
Gradual convergence: Warning sign
🔥 Current status: The two moving averages are still far apart, no top signal yet. The next crossover is expected around October 2025.
Link: https://www.bitcoinmagazinepro.com/charts/pi-cycle-top-prediction/
4. Bitcoin Rainbow Chart
The Rainbow Chart is an intuitive long-term valuation model that divides Bitcoin’s price into nine color-coded zones. Based on logarithmic regression, it accounts for Bitcoin’s long-term growth and cyclical nature. Across past market cycles, the Rainbow Chart has proven effective, especially in identifying extreme zones.
Indicator ranges:
-
Red: Bubble zone, sell signal
-
Yellow: Overheated zone, stay alert
-
Green: Healthy zone, hold
-
Blue: Value zone, buy opportunity
🔥 Current status: Price is in the green zone, indicating reasonable valuation—no top signal present.
Link: https://www.coinglass.com/zh/pro/i/bitcoin-rainbow-chart
5. Bitcoin Terminal Price Indicator
The terminal price is calculated as the transferred price multiplied by 21. The transferred price is derived by dividing the coin-days destroyed by the existing Bitcoin supply and its circulation time. This indicator effectively filters out speculative noise, reflecting Bitcoin network’s intrinsic value.
Signal characteristic: The closer Bitcoin’s price gets to the red line, the nearer the market is to a top.
🔥 Current status: Not yet at top level.
Link: https://www.bitcoinmagazinepro.com/charts/terminal-price/
6. Bitcoin Market Cap Dominance
This indicator measures Bitcoin’s dominance in the overall cryptocurrency market. It helps assess market cycles and capital flows. A declining dominance often signals capital rotation into altcoins. Historical data shows that shifts in Bitcoin’s market cap share frequently precede broader crypto market turning points.
Indicator ranges:
-
65%: Bitcoin strength phase
-
40–65%: Balanced phase
-
<40%: Altcoin active phase
🔥 Current status: Market cap share is around 60%, within a relatively balanced range.
Link: https://www.coinglass.com/zh/pro/i/MarketCap
7. Bitcoin CBBI Index
The Combined Bitcoin Binary Index (CBBI) is a composite index integrating multiple technical and on-chain metrics, effectively identifying bull-bear transitions. Its strength lies in reducing the limitations of single indicators through multi-dimensional data fusion.
Indicator range: Above 90 indicates market top.
🔥 Current status: Index reads 79, slightly overheated but not at top.
Link: https://www.coinglass.com/zh/pro/i/cbbi-index
8. Bitcoin MVRV Z-Score
The MVRV Z-Score is a key on-chain metric that evaluates market cycles by measuring the deviation between market value and realized value. A high score suggests overvaluation, which may pressure Bitcoin’s price; a low score suggests undervaluation. Historically, elevated readings increase the likelihood of downward price trends—highlighting risks of chasing highs.
Indicator range: Above 5 indicates market top.
🔥 Current status: Score is 2.5, not yet at top.
Link: https://www.coinglass.com/zh/pro/i/bitcoin-mvrv-zscore
9. Bitcoin Rhodl Ratio
The Rhodl Ratio is a composite on-chain indicator that identifies potential market turning points by analyzing behavioral patterns of holders across different timeframes. When the ratio approaches the red zone, it may indicate market overheating. Historically, this has been a strong signal for investors to take profits at cycle peaks.
Indicator range: Ratio >= 10,000 suggests market is nearing a top.
🔥 Current status: Currently not in the red zone, but the indicator did enter the top zone during November 2024.
Link: https://www.coinglass.com/zh/pro/i/r-hodl-ratio
10. Bitcoin Mayer Multiple
The Bitcoin Mayer Multiple, proposed by Trace Mayer, is a technical indicator assessing Bitcoin’s market condition by comparing its current price to its 200-day moving average (200DMA).
Indicator ranges:
-
Mayer Multiple > 1: Current price above 200DMA, market possibly overbought
-
Mayer Multiple < 1: Current price below 200DMA, market possibly oversold
-
Mayer Multiple ≈ 1: Price near 200DMA, market likely balanced
-
Historically, readings above 2.4 suggest market overheating and potential correction or bear market. Readings below 0.8 suggest undervaluation and possible buying opportunity.
🔥 Current status: Reading is 1.26, market overbought but not at top.
Link: https://www.coinglass.com/zh/pro/i/mayer-multiple
11. Consecutive Days of ETF Net Outflows
This indicator tracks fund flows in Bitcoin ETFs. Prolonged net outflows often reflect weakening institutional confidence. A relatively new metric, it has gained attention since the launch of spot ETFs.
Signal characteristics:
-
10 days: Strong bearish signal
-
5–10 days: Caution required
-
<5 days: Normal volatility
🔥 Current status: One consecutive day of net outflow—within normal fluctuation range. Maximum in this cycle was 8 days, no 10-day streak observed.
Link: https://www.coinglass.com/zh/bitcoin-etf
12. ETF Share of BTC Supply
This indicator measures the proportion of Bitcoin held by ETFs relative to total circulating supply, assessing institutional participation. It reflects traditional finance’s acceptance and depth of engagement with Bitcoin.
Signal characteristic: <=3.5% serves as a top-exit signal, indicating low institutional involvement.
🔥 Current status: Share is close to 6%, showing healthy institutional growth.
Link: https://www.coinglass.com/zh/bitcoin-etf
13. USDT Money Market Rates
USDT money market rates measure the cost of capital in the crypto market, reflecting overall liquidity conditions.
Signal characteristic: >=29% marks the top-exit zone.
🔥 Current status: Rate is approximately 6.68%, within normal range. However, in March 2024, this indicator entered the top zone, reaching 65%.
Link: https://www.coinglass.com/zh/pro/i/MarginFeeChart
14. Altcoin Season Index
This indicator determines whether the market has entered an altcoin-active phase. By comparing Bitcoin’s performance against major altcoins, it reveals whether capital is rotating into higher-risk smaller coins.
Indicator ranges:
-
75: Altcoin season begins; above 75 suggests market nearing top
-
25–75: Balanced phase
-
<25: Bitcoin-dominated phase
🔥 Current status: Index is 41, but it entered the top zone in December 2024, reaching 88.
Link: https://www.coinglass.com/zh/pro/i/alt-coin-season
15. MicroStrategy Cost Indicator
This tracks MicroStrategy’s average Bitcoin acquisition cost, serving as a benchmark for institutional investors. As one of the largest corporate Bitcoin holders, its cost basis often becomes a key psychological support level.
Indicator ranges:
-
Current price above cost: Institutional profit zone
-
Current price near cost: Support level
-
Current price below cost: Potential buying opportunity
🔥 Current status: MicroStrategy’s average cost is around $60,000—currently in the profit zone.
Link: https://www.coinglass.com/zh/pro/i/micro-strategy-cost
2. Summary
"Bear markets make you go broke; bull markets make you poor again." Staying rational during market euphoria and exiting entirely during mania is far harder than buying at the bottom. Currently, only some indicators show top-exit signals—this doesn’t confirm the market has definitively topped. If you perceive top risk, consider the following:
-
Set staggered profit-taking levels—don’t aim for the perfect top.
-
Cash out gains into stablecoins or fiat instead of rotating into riskier altcoins.
-
When at high levels, better to sell early than late. Taking profits isn’t the end—it’s stockpiling ammunition for the next cycle.
Remember, every top is a wealth creation opportunity for some and a wealth trap for most. The market offers equal opportunities to all, but only those who are prepared can seize them.
Join TechFlow official community to stay tuned
Telegram:https://t.me/TechFlowDaily
X (Twitter):https://x.com/TechFlowPost
X (Twitter) EN:https://x.com/BlockFlow_News
 @BiteyeCN