VanEck Research: Bitcoin to Rise to $180,000 in This Cycle
TechFlow Selected TechFlow Selected
VanEck Research: Bitcoin to Rise to $180,000 in This Cycle
Why?
Authored by: Nathan Frankovitz, Matthew Sigel
Translated by: Wu Shuo Blockchain
Driven by regulatory optimism following Trump's election victory, Bitcoin has successfully surpassed its previous all-time high. As market attention continues to rise, various key indicators suggest that the strong momentum of this bull market is likely to persist.
As we predicted in September, Bitcoin (BTC) entered a period of high-volatility upward movement after the election. Now, Bitcoin has moved into uncharted territory with no technical price resistance ahead, and we believe the next phase of the bull market has only just begun. This pattern mirrors the post-2020 election rally, when Bitcoin doubled by year-end and rose approximately 137% further in 2021. With a significant shift toward supportive government policies on Bitcoin, investor interest is rapidly increasing. Recently, we have seen a surge in investment inquiries, as many investors realize they are significantly underexposed to this asset class. While we remain vigilant for signs of overheating, we reiterate our cycle price target of $180,000 per BTC, as tracked key metrics continue to show bullish signals.
Bitcoin Price Dynamics
Market Sentiment
Bitcoin’s 7-day moving average (7 DMA) reached $89,444, setting a new record high. On Tuesday, November 5—the night of the election—Bitcoin surged about 9%, hitting a fresh high of $75,000. This aligns with our earlier observation: Bitcoin prices tend to rise as the likelihood of a Trump victory increases. During his campaign, Trump explicitly pledged to end the U.S. Securities and Exchange Commission’s (SEC) "regulation by enforcement" approach and position the United States as the “global capital of crypto and Bitcoin.”
With Trump elected president, regulatory headwinds are turning into tailwinds for the first time. Trump has begun appointing pro-crypto officials within the executive branch, and with Republicans holding a unified government, the chances of passing supportive legislation have increased. Key proposals include plans to establish a national Bitcoin reserve, rewrite crypto market structure rules, and introduce stablecoin legislation. FIT21 is expected to be revised with market- and privacy-friendly terms, while a new stablecoin bill may allow state-chartered banks to issue stablecoins without Federal Reserve approval.
As countries like the BRICS explore alternatives such as Bitcoin to circumvent dollar sanctions and currency manipulation, stablecoins offer a strategic opportunity for the U.S. dollar to maintain global reach. By removing regulatory barriers and allowing state-chartered banks to issue stablecoins, the U.S. can preserve the dollar’s global influence and leverage crypto for faster adoption in emerging markets—regions where demand for financial services, hedging against local currency inflation, and decentralized finance (DeFi) is exceptionally strong.
We expect the SEC Accounting Bulletin (SAB) 121 will be repealed within the first quarter of Trump’s term—if not by the SEC itself, then by Congress—prompting banks to announce crypto custody solutions. If Gary Gensler has not yet resigned, Trump is likely to fulfill his promise to replace the SEC chair with a more crypto-friendly candidate, ending the agency’s notorious era of “regulation by enforcement.” Additionally, by 2025, U.S. Ethereum (ETH) ETFs are expected to be updated to support staking, the SEC will approve Solana (SOL) ETF 19b-4 filings, and ETF creations/redemptions in physical form will make these products more tax-efficient and liquid. Given Trump’s prior recognition of the shared energy-intensive nature of Bitcoin mining and artificial intelligence (AI), energy regulations are expected to ease, making baseload power (such as nuclear) cheaper and more abundant, thereby strengthening U.S. global leadership in energy, AI, and Bitcoin.
This election marks a bullish inflection point, reversing previous hardline policies that led to capital and job outflows. By revitalizing entrepreneurial activity, the U.S. is poised to become the global leader in crypto innovation and employment, transforming cryptocurrency into a key domestic growth sector and an important export to emerging markets.
Bitcoin Dominance
The 7-day moving average of Bitcoin dominance—a measure of Bitcoin’s market cap relative to the total crypto market cap—rose 2 percentage points this month to 59%, the highest level since March 2021. Although this upward trend, which began at 40% in November 2022, may continue in the short term, it could soon peak. In September, we noted that a Harris victory might boost Bitcoin dominance due to clearer regulatory classification of Bitcoin as a commodity. In contrast, Trump’s pro-crypto stance and expanded cabinet team may drive broader investment across the crypto market. As Bitcoin reaches new highs under innovation-friendly regulation, the wealth effect and reduced regulatory risk are expected to attract both native crypto capital and new institutional investors into DeFi, enhancing returns for smaller projects within the asset class.
Regional Trading Dynamics
At first glance, Asian market traders appear to have significantly increased their Bitcoin holdings this month—contrary to recent years’ trend where Asian traders typically net sold while European and U.S. traders were net buyers. However, the surge in Bitcoin price on election night occurred during the Asian trading session, likely driven by heavy trading from U.S. investors around the election. This special event makes it difficult to fully attribute the price movement to regional dynamics. Consistent with historical behavior, traders in U.S. and European time zones continued to accumulate Bitcoin, maintaining the price performance trend observed in October.
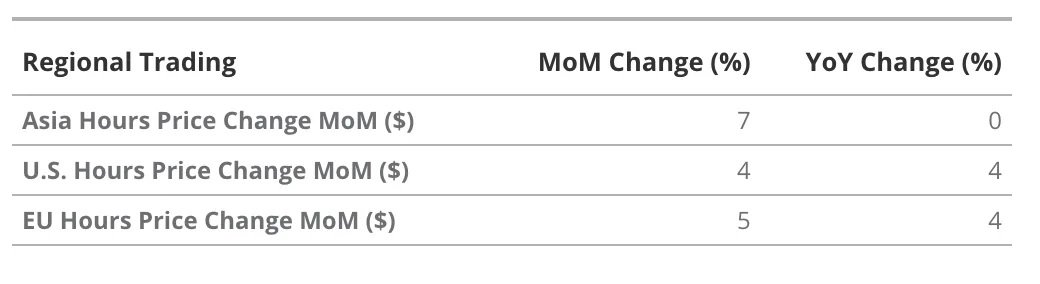
Source: Glassnode, 11/18/24 (Past performance is not indicative of future results.)
Key Metrics
To assess the potential upside and duration of this bull run, we analyze key indicators that help evaluate market risk levels and possible price tops. This month, we begin with perpetual contracts (“perps”), where funding rates provide insight into market sentiment and help gauge overheating risks.
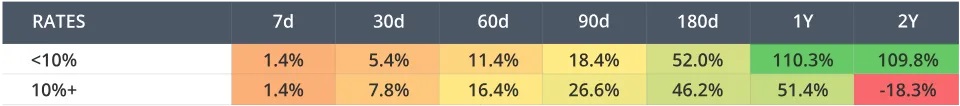
Bitcoin prices often show signs of overheating when the 30-day moving average of perp funding rates exceeds 10% for 1 to 3 months.
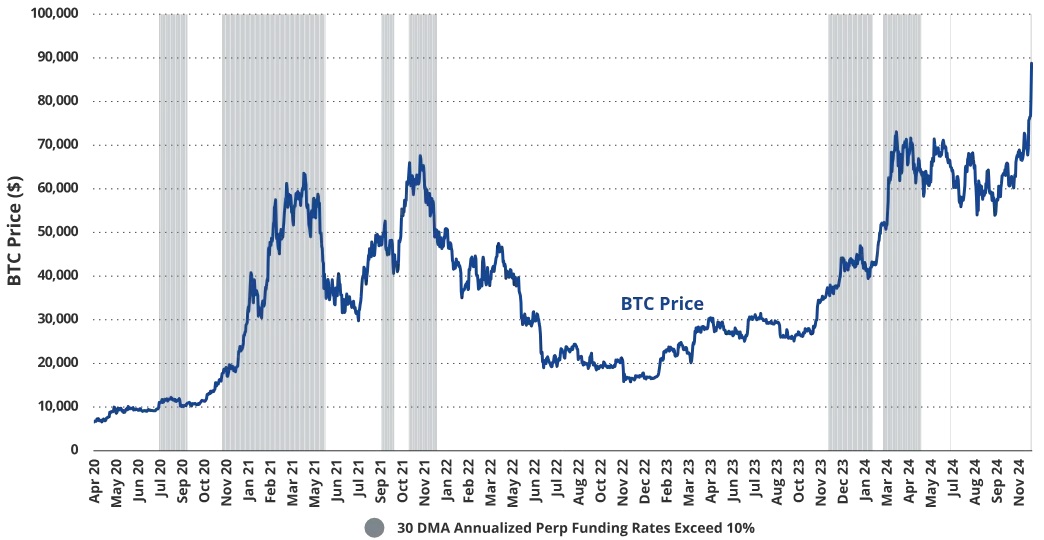
BTC Average Returns vs. Perpetual Funding Rates (Jan 4, 2020 – Nov 11, 2024)
BTC Price Performance When 30 DMA Annualized Perps Fee Exceeds 10%
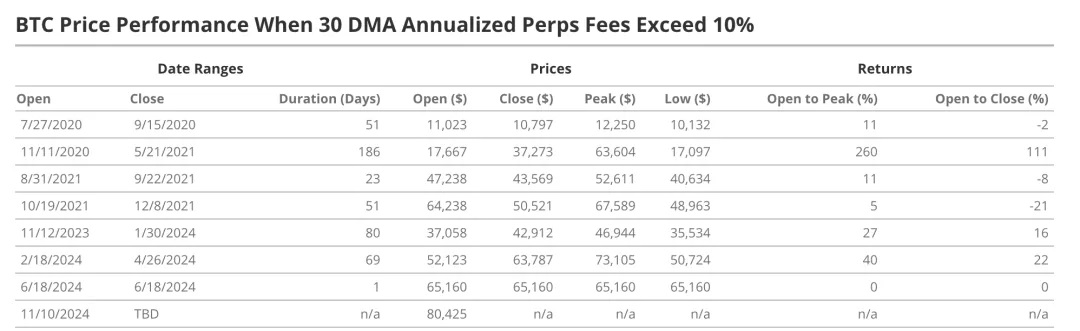
Source: Glassnode, as of November 12, 2024
Since April 2020, we analyzed periods when the 30-day moving average (DMA) of perp funding rates exceeded 10%. These periods averaged about 66 days in duration, with an average return from start to finish of 17%, although durations varied significantly. The sole exception was a one-day spike on June 18, 2024, reflecting short-term market sentiment. Other instances lasted weeks, highlighting structural bullish sentiment that typically leads to strong short- to medium-term gains.
For example, the high funding rate period beginning August 31, 2021, lasted 23 days, followed by a 28-day cooling-off period, then another 51-day stretch starting October 19. Counting the brief gap, the total duration of elevated funding rates in 2021 reached 99 days. Similarly, the current high-funding-rate phase beginning November 12, 2024, lasted 80 days, followed by a 19-day break, then resumed for another 69 days—totaling 168 days, comparable to the 186-day stretch from November 11, 2020, to May 21, 2021. Notably, buying Bitcoin during periods when funding rates exceed 10% has historically delivered higher average returns over 30-, 60-, and 90-day horizons than during low-rate periods.
However, data shows a pattern of underperformance over longer timeframes. On average, Bitcoin purchased during >10% funding rate days begins to underperform from the 180-day mark onward, with the underperformance becoming more pronounced over 1-year and 2-year periods. Since market cycles typically last about four years, this suggests sustained high funding rates often coincide with cycle peaks and may serve as early warnings of overheating, indicating greater vulnerability to long-term downside risks.
Source: Glassnode, as of November 13, 2024
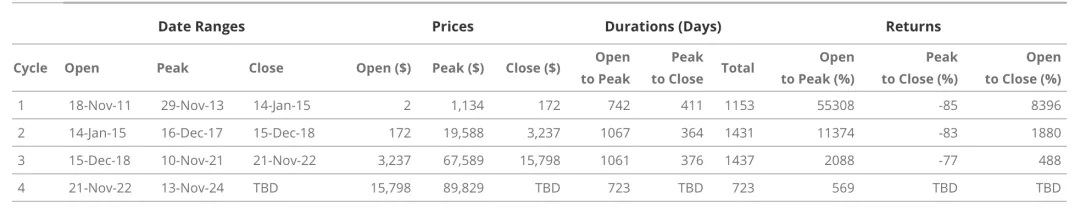
As of November 11, Bitcoin entered a new phase with funding rates again exceeding 10%. This shift indicates stronger short- to medium-term momentum, as historically, higher funding rates correlate with higher 30-, 60-, and 90-day returns, reflecting elevated bullish sentiment and demand. However, as funding rates remain elevated, we may be moving away from a period where long-term (1–2 year) returns are equally favorable. Given the current pro-Bitcoin regulatory environment, we anticipate another high-performance phase similar to the post-2020 election period, when sustained funding rates above 10% drove a 260% gain over 186 days. With Bitcoin now trading near $90,000, our $180,000 price target remains achievable, reflecting a potential ~1,000% cycle return from trough to peak.
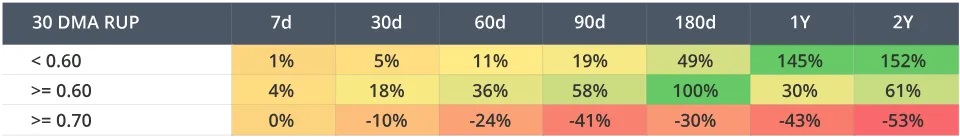
Elevated levels of the 30-day moving average (DMA) Relative Unrealized Profit (>0.60 and 0.70) have historically signaled Bitcoin price tops.
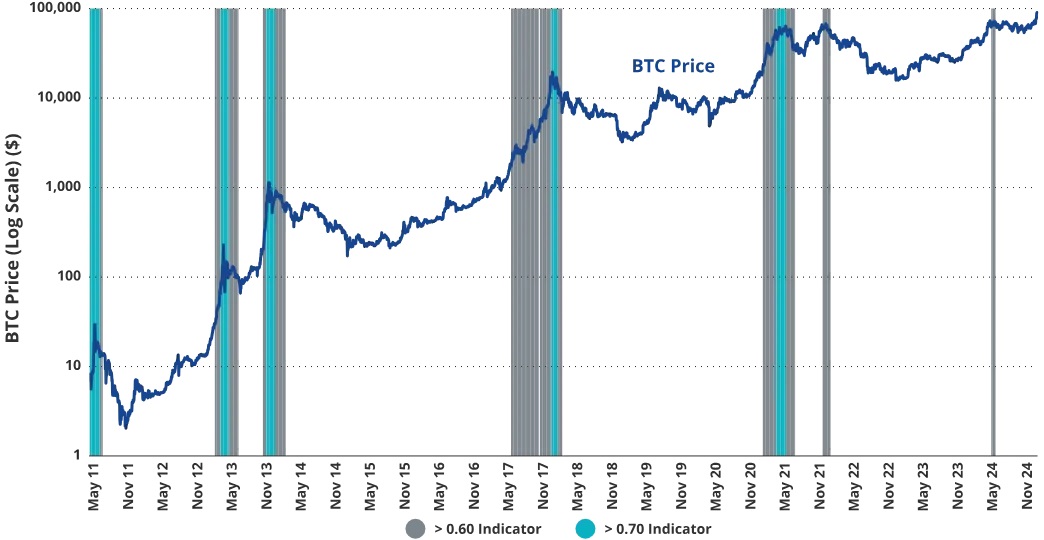
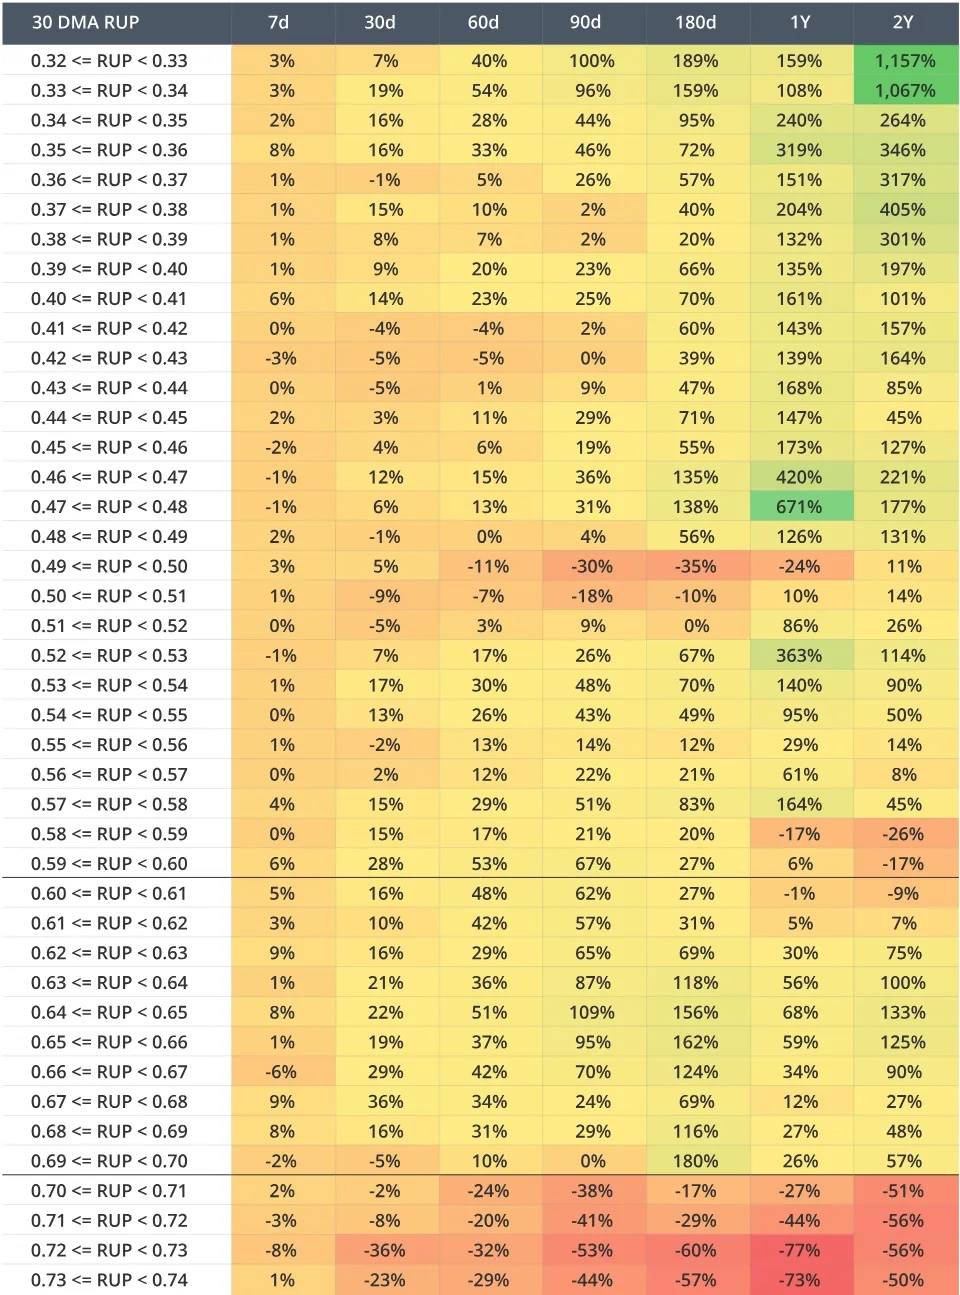
BTC Average Returns vs. 30-Day Moving Average Relative Unrealized Profit (RUP) (Nov 13, 2016 – Nov 13, 2024)
Source: Glassnode, as of November 13, 2024
BTC Average Returns vs. 30-Day Moving Average Relative Unrealized Profit (RUP) (Nov 13, 2016 – Nov 13, 2024)
Source: Glassnode, as of November 13, 2024
Next, we examine Relative Unrealized Profit (RUP), another critical metric for assessing whether the Bitcoin market is overheating. RUP measures the proportion of Bitcoin’s total market cap represented by unrealized profits (paper gains not yet realized through selling). The indicator rises when Bitcoin’s price exceeds the last purchase price for most holders, signaling more of the market is in profit and reflecting optimistic sentiment.
Historically, high 30-day moving average (DMA) RUP levels—especially above 0.60 and 0.70—often indicate strong and potentially overheated market sentiment. As shown by the red zones in the chart, RUP 30 DMA values above 0.70 frequently coincide with market tops, as high unrealized profit ratios trigger increased profit-taking. Conversely, RUP levels below 0.60 suggest more favorable conditions for long-term buying, with historical data showing higher 1-year and 2-year returns when purchases are made below this threshold.
Analysis of the past two market cycles shows that 30 DMA RUP levels between 0.60 and 0.70 typically yield the highest short- to medium-term returns (7 days to 180 days). This range usually reflects the mid-bull phase, where market optimism is rising but not yet excessive. In contrast, when RUP exceeds 0.70, returns across all timeframes consistently turn negative, reinforcing its role as a strong sell signal.
As of November 13, Bitcoin’s 30 DMA RUP stood at approximately 0.54, though daily readings have exceeded 0.60 since November 11. According to our detailed dataset, risk gradually increases as RUP approaches 0.70, underscoring the importance of tactical short-term positioning within the 0.60–0.70 range. However, if the 30 DMA RUP climbs close to 0.70, it may signal market overheating, warranting caution for long-term positions.
U.S. Google Search Interest in "Cryptocurrency"
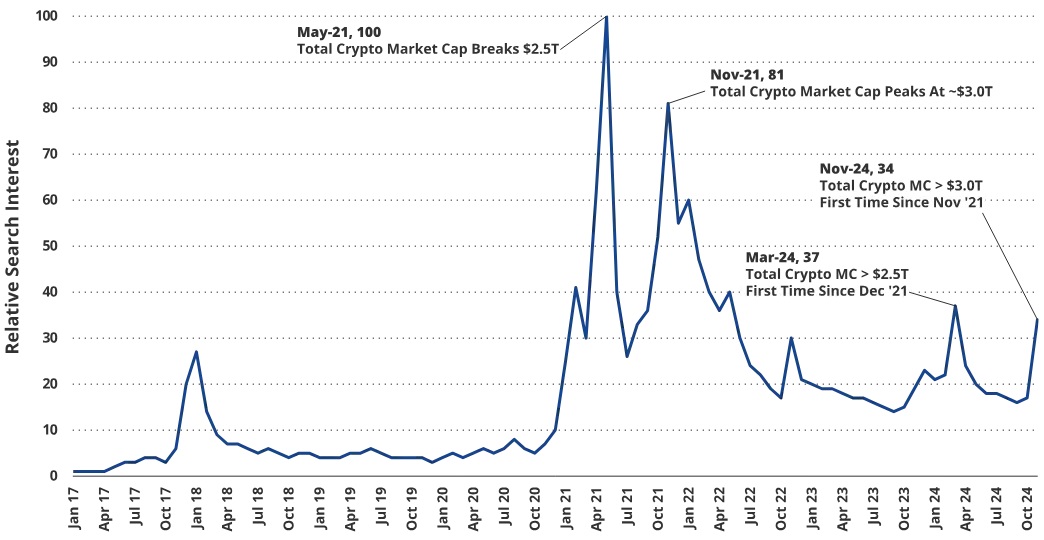
Source: Google Trends, as of November 18, 2024
Search interest in “cryptocurrency” on Google is a key indicator of retail investor interest and market momentum. Historically, peaks in search volume closely align with peaks in total crypto market capitalization. For instance, after reaching all-time highs in May and November 2021, the market saw significant downturns: a ~55% correction within about two months following the May peak, and a ~12-month bear market with a total drawdown of ~75% after the November peak.
Currently, search interest stands at 34% of the May 2021 peak, slightly below the 37% local high observed in March 2024—when Bitcoin tested its cycle high near $69,000. This relatively low search interest suggests that Bitcoin and the broader crypto market have not yet entered a speculative frenzy, leaving room for further growth and indicating that mainstream attention has not yet reached levels typically associated with market tops.
Coinbase App Store Ranking
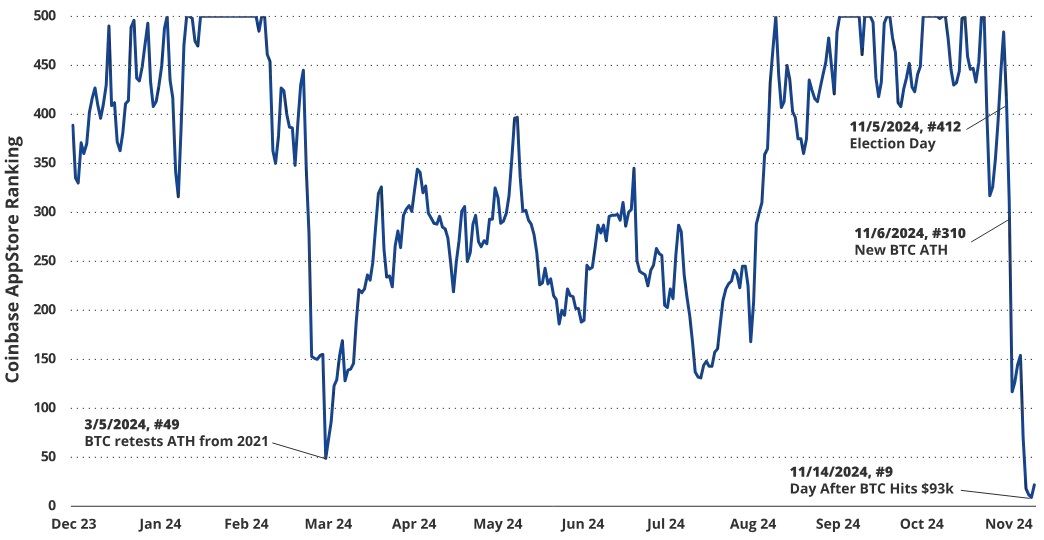
Source: openbb.co, as of November 15, 2024
Similar to Google search trends for “cryptocurrency,” Coinbase’s ranking in app stores is another important proxy for retail investor interest. On March 5 this year, as Bitcoin surged ~34% over nine days and retested its 2021 all-time high near $69,000, Coinbase re-entered the top 50 apps. Despite Bitcoin later reaching a new high of ~$74,000 that same month, retail interest waned during the summer lull in volatility and as public attention shifted toward the presidential election. However, Bitcoin’s breakout on election night reignited retail interest, propelling Coinbase’s app store ranking from #412 on November 5 to #9 on November 14. This surge in engagement helped fuel further price gains and coincided with record inflows into Bitcoin ETFs.
Bitcoin Network Activity, Adoption, and Fees
Daily Transaction Volume: The 7-day moving average of daily transactions is approximately 543,000, down 15% month-on-month. Despite the decline, activity remains robust, sitting at the 96th percentile of Bitcoin’s historical activity. While transaction counts have decreased, larger transaction payloads have offset this, evident in rising transfer volumes.
Ordinals Inscriptions: Daily inscription (NFTs and meme coins on the Bitcoin blockchain) volume surged 404% MoM, reflecting a resurgence in speculative enthusiasm driven by price appreciation and regulatory tailwinds.
Total Transfer Volume: Bitcoin transfer volume rose 118% MoM, with a 7-day moving average reaching ~$85 billion.
Average Transaction Fee: Bitcoin transaction fees declined 5% MoM, averaging $3.58, with an average transaction payload of ~$157,000, resulting in a fee rate of approximately 0.0023%.
Bitcoin Market Health and Profitability
Proportion of Profitable Addresses: With Bitcoin reaching new all-time highs, approximately 99% of Bitcoin addresses are now in profit.
Net Unrealized Profit/Loss Ratio: This ratio increased 21% over the past month to 0.61, indicating a significant improvement in the balance between unrealized profits and losses. As a market sentiment gauge, the ratio currently sits in the “Belief-Denial” zone, corresponding to phases in the market cycle marked by rapid expansion and contraction between peaks and troughs.
Bitcoin On-Chain Monthly Dashboard
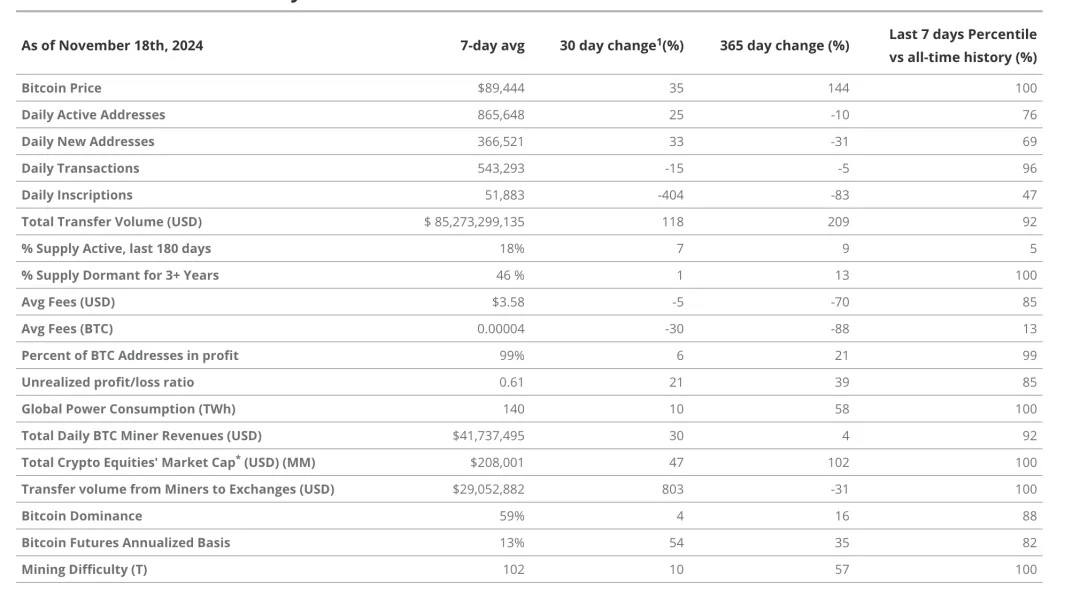
Source: Glassnode, VanEck Research, as of October 15, 2024
Bitcoin Miners and Total Crypto Market Cap
Mining Difficulty (T):
Bitcoin’s block difficulty increased from 92 T to 102 T, reflecting miners expanding and upgrading their equipment fleets. The Bitcoin network automatically adjusts difficulty every 2,016 blocks (approximately every two weeks) to maintain an average block time of about 10 minutes. Rising difficulty indicates intensifying competition among miners and reflects a strong, secure network.
Daily Miner Revenue:
Miners’ daily revenue increased 30% MoM, driven by higher Bitcoin prices, though transaction fees denominated in BTC declined by 30%, partially offsetting total revenue gains.
Miner Transfers to Exchanges:
On November 18, miners transferred approximately $181 million worth of Bitcoin to exchanges—equivalent to 50 times the previous 30-day average—pushing the 7-day moving average up 803% MoM. This extreme move is the highest since March and resembles levels seen before Bitcoin’s most recent halving. While sustained high miner outflows to exchanges could signal market overheating, this spike follows a summer period of low miner selling, suggesting these transfers are likely for operational and growth-related profit-taking rather than a sign of an impending market top.
Total Market Cap of Crypto Equities:
The 30-day moving average of the MarketVector Digital Asset Equity Index (MVDAPP) rose 47% MoM, outperforming Bitcoin. Major index constituents like MicroStrategy and Bitcoin mining firms benefit directly from rising Bitcoin prices through their BTC holdings or mining operations. Meanwhile, companies like Coinbase benefit from broader crypto market gains, as price increases raise expectations for higher trading fees and other revenue streams.
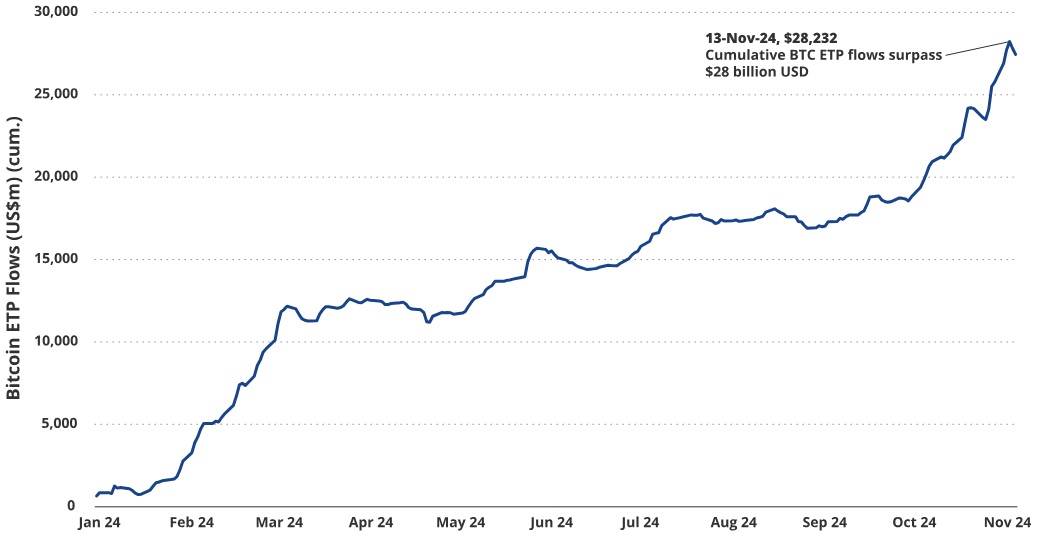
Source: farside.co.uk, as of November 18, 2024
Join TechFlow official community to stay tuned
Telegram:https://t.me/TechFlowDaily
X (Twitter):https://x.com/TechFlowPost
X (Twitter) EN:https://x.com/BlockFlow_News