

Five Technical Indicators from Veteran Traders to Help You Quickly Capture Meme Trends
TechFlow Selected TechFlow Selected
Five Technical Indicators from Veteran Traders to Help You Quickly Capture Meme Trends
Don't overreact because you missed a good deal.
Author: Minty
Translation: TechFlow
For entertainment purposes only, not financial advice.
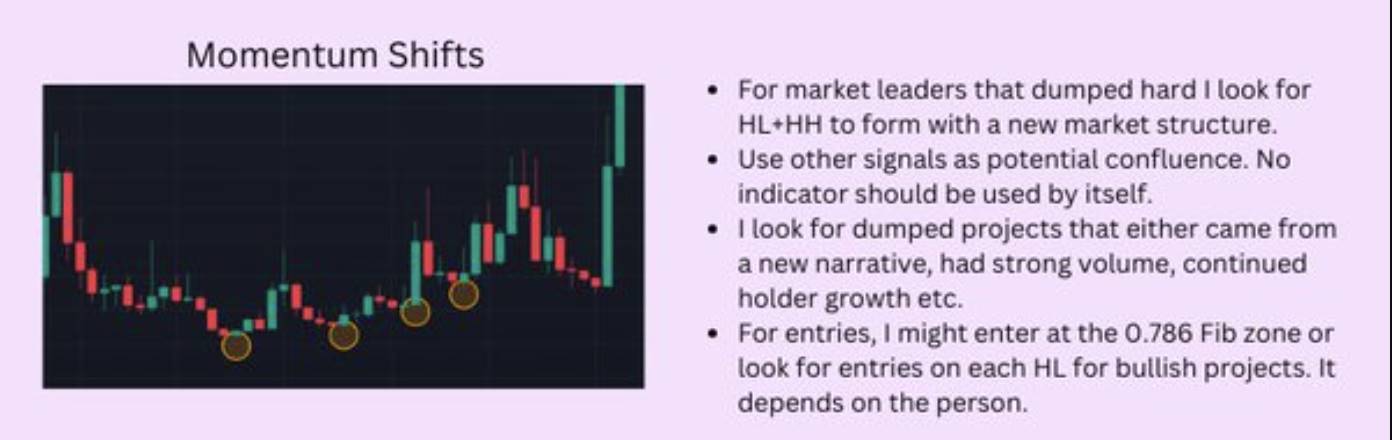
Momentum Shift: Observe changes in market momentum to identify potential trading opportunities.
-
For market leaders that have experienced severe sell-offs, I look for the formation of higher lows (HL) and higher highs (HH) to establish new market structure.
-
Use other signals as potential confluence references; no single indicator should be used in isolation.
-
Seek out sold-off projects driven by new narratives, strong trading volume, and steadily increasing holder counts.
-
Entry strategies may include entering around the 0.786 Fibonacci level, or looking for bullish entry points at each higher low (HL), depending on personal preference.
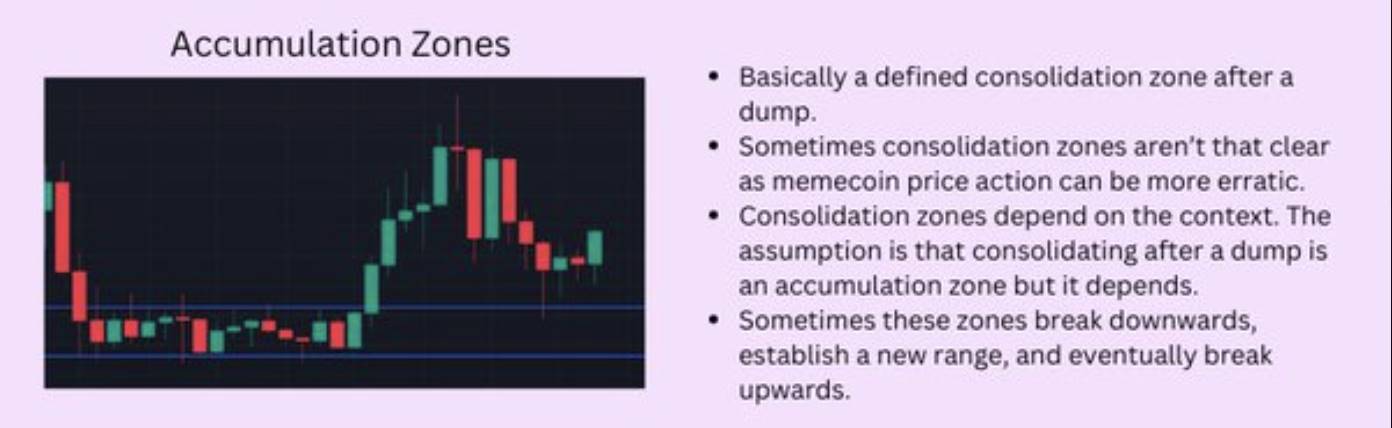
Accumulation Zone: After a market downturn, look for price consolidation within a range, typically seen as an accumulation phase.
-
Usually defines a clear consolidation area following a sell-off.
-
Sometimes the consolidation zone is less obvious, as meme coin price movements can be more volatile.
-
The definition of a consolidation zone depends on market context. While consolidation after a sell-off is often viewed as accumulation, specific cases may vary.
-
Sometimes these zones first break downward, forming a new trading range, before eventually breaking upward.
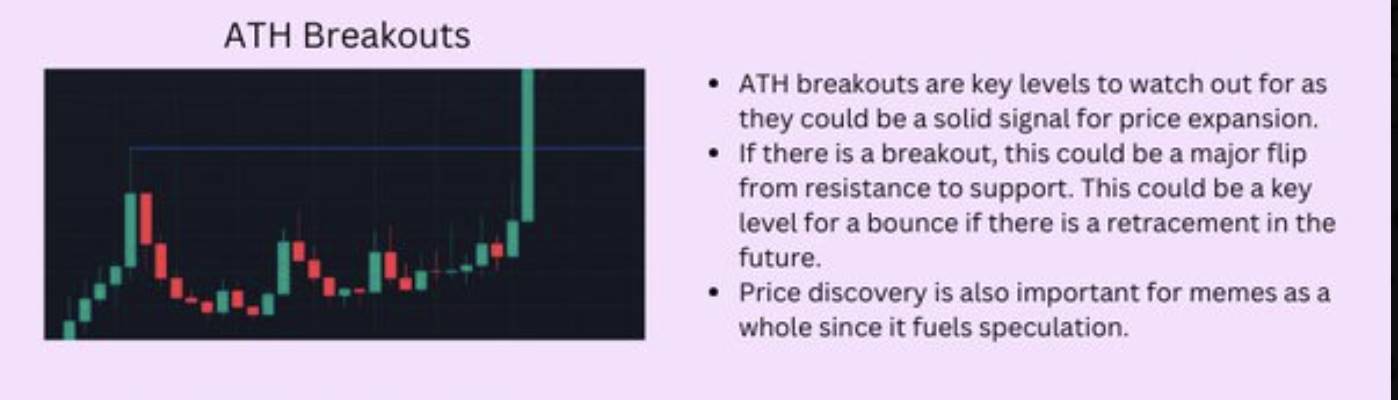
All-Time High Breakouts (ATH Breakouts): When price breaks above its historical high, it may signal the start of a new uptrend.
-
Breaking through all-time highs (ATH) is a key level to watch, as it can be a strong signal for price expansion.
-
If a breakout occurs, it may indicate that resistance has turned into support, potentially serving as a critical bounce point during future pullbacks.
-
Price discovery is especially important for meme coins overall, as it drives market speculation.
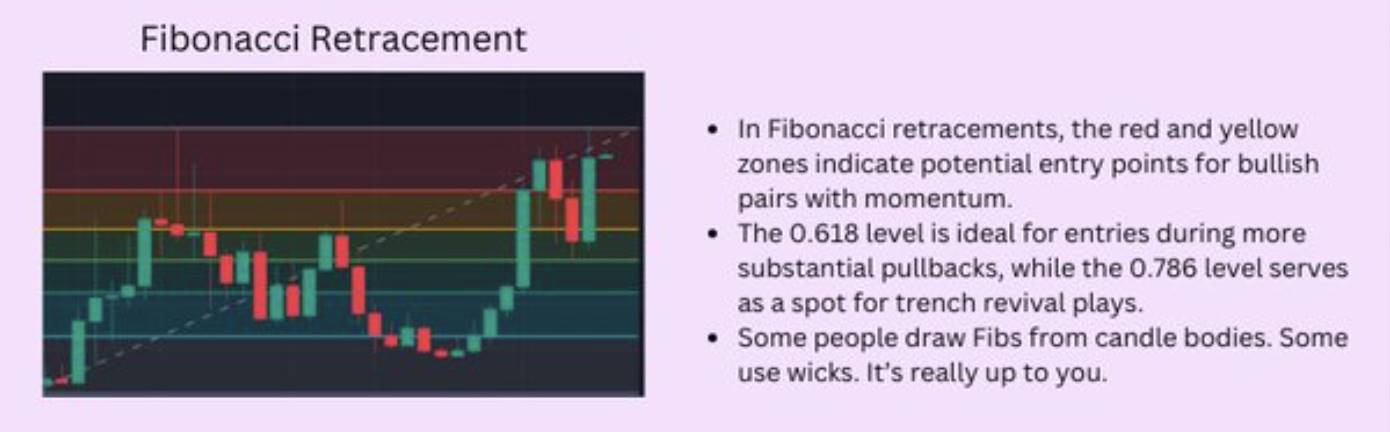
Fibonacci Retracement: Use Fibonacci ratios to identify potential support and resistance levels.
-
In Fibonacci retracements, red and yellow zones are often seen as potential entry points for bullish pairs showing momentum.
-
The 0.618 level is ideal for entries during deeper pullbacks, while the 0.786 level suits bounce plays after deep corrections.
-
Some traders draw Fibonacci levels from candle bodies, others from wicks—this is entirely based on personal preference.
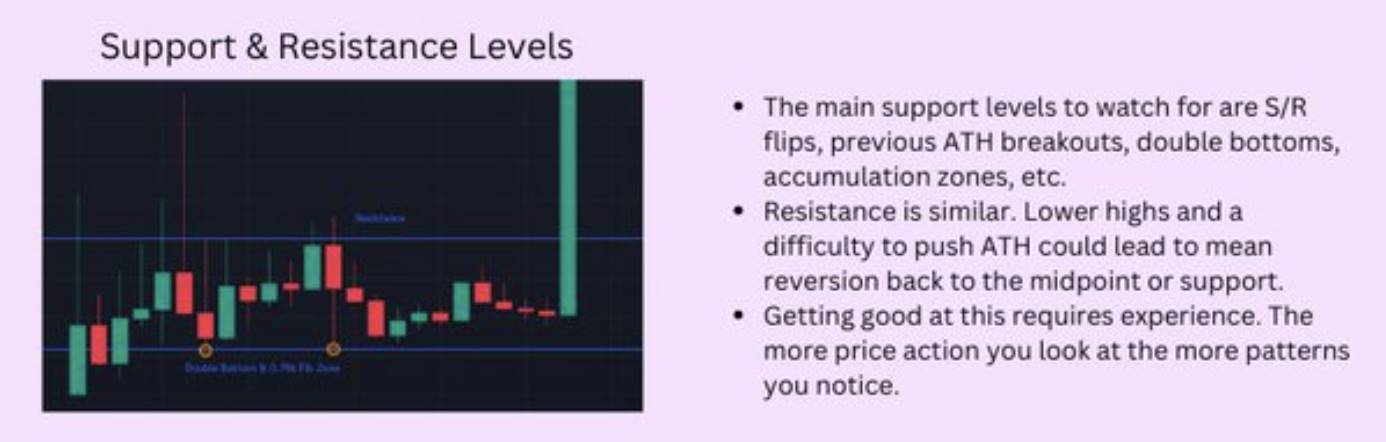
Support & Resistance Levels: Price levels where upward or downward movement may encounter barriers or support.
-
Key support levels include support/resistance (S/R) flips, previous ATH breakouts, double bottom patterns, and accumulation zones.
-
On the resistance side, lower highs and failure to break ATHs may lead price back toward mid-range or support levels.
-
Mastery of these analytical methods requires experience. The more price action you observe, the more patterns you’ll be able to recognize.
Some Notes
-
Key patterns aren't always accurate. Combining multiple confluence signals increases the probability of success.
-
Execution tends to be more rewarding in bullish markets; in bearish conditions, strategic operation becomes more crucial.
-
Using Dexscreener filters can help you track price movements when targets are reached.
-
Especially with trending new projects, don’t expect to always get ideal entry points. You might get front-run due to higher gas fees or limit orders.
-
Don’t overreact to missed trades. Based on experience, forcing trades out of fear of missing out (FOMO) often leads to greater losses.
-
I usually default to checking daily and weekly charts, and at minimum review 4-hour charts, since shorter timeframes carry more market noise.
Join TechFlow official community to stay tuned
Telegram:https://t.me/TechFlowDaily
X (Twitter):https://x.com/TechFlowPost
X (Twitter) EN:https://x.com/BlockFlow_News


