

Data Interpretation: Listing Performance of Top Five Exchanges Including Binance and OKX in the First Three Quarters
TechFlow Selected TechFlow Selected
Data Interpretation: Listing Performance of Top Five Exchanges Including Binance and OKX in the First Three Quarters
The average return rate of the five major exchanges—Binance, OKX, Bitget, KuCoin, and Bybit—is negative.
Author: Animoca Digital Research
Translation: Felix, PANews
Animoca Digital Research has released a research report analyzing the listing activities of five major exchanges—Binance, OKX, Bitget, KuCoin, and Bybit—from a data-driven perspective. The full report is as follows:
Overview of Listing Performance
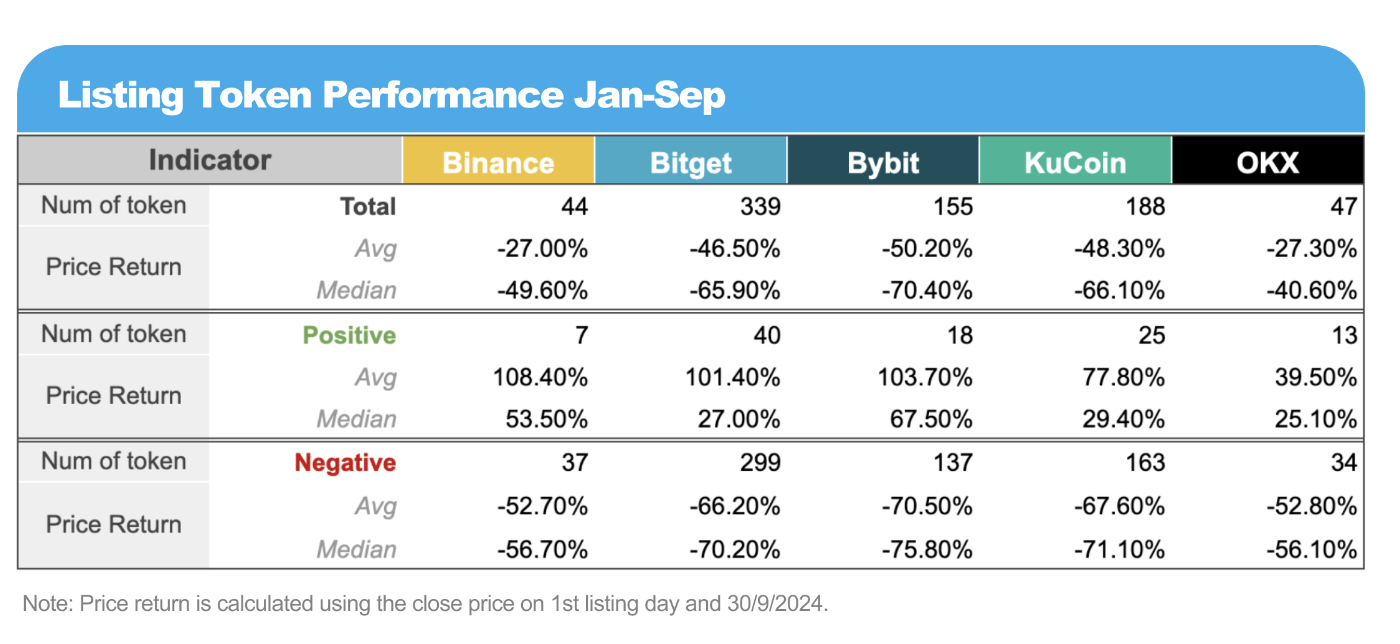
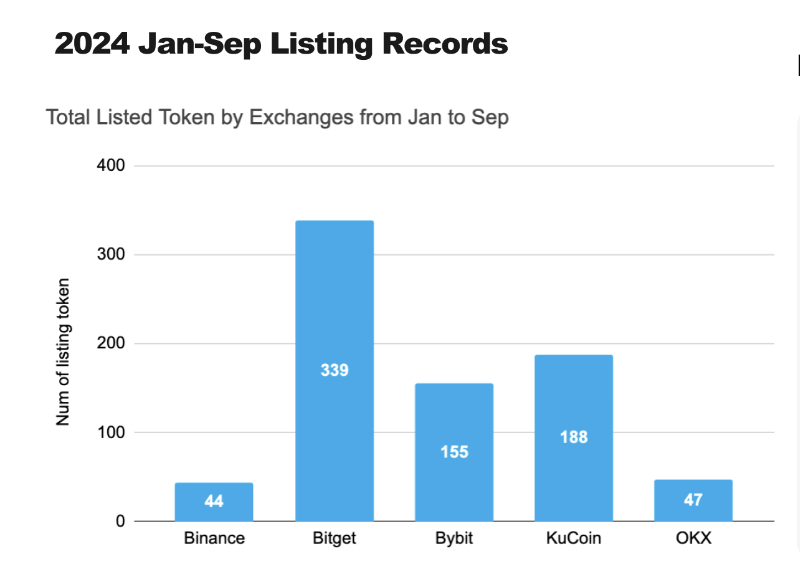
This year, leading exchanges have adopted different token listing strategies.
Binance and OKX are more selective among mainstream exchanges, having listed only 44 and 47 tokens respectively year-to-date.
In sharp contrast, Bitget has pursued a more aggressive listing strategy with 339 listed tokens, far exceeding its competitors and significantly increasing its market share in 2024.
KuCoin and Bybit have each listed over 150 tokens so far this year.
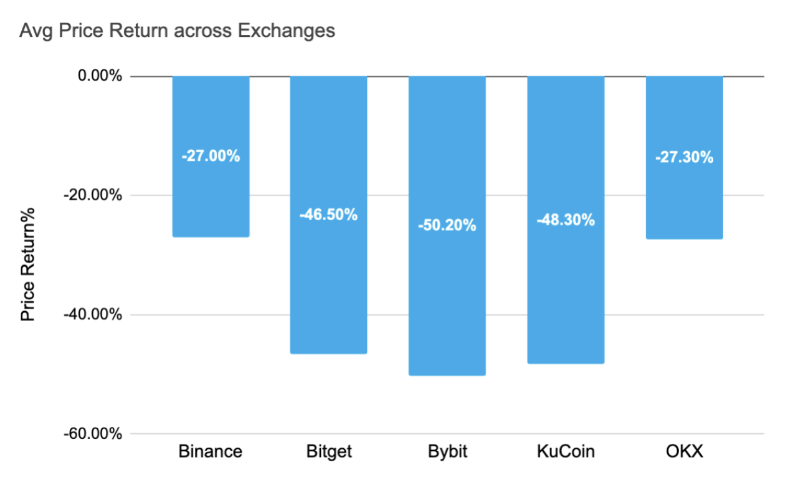
Average return per exchange
Year-to-date, the average return for most exchanges has been negative, with Bybit experiencing the largest decline at -50.20%.
KuCoin follows closely with an average return of -48.30%, while Bitget's average return stands at -46.50%.
In comparison, Binance and OKX performed relatively better, with average returns of -27.00% and -27.30% respectively. This suggests that Binance and OKX implemented more effective selective listing strategies, resulting in relatively stronger token price performance amid a challenging altcoin market environment.
Monthly Token Listings Count
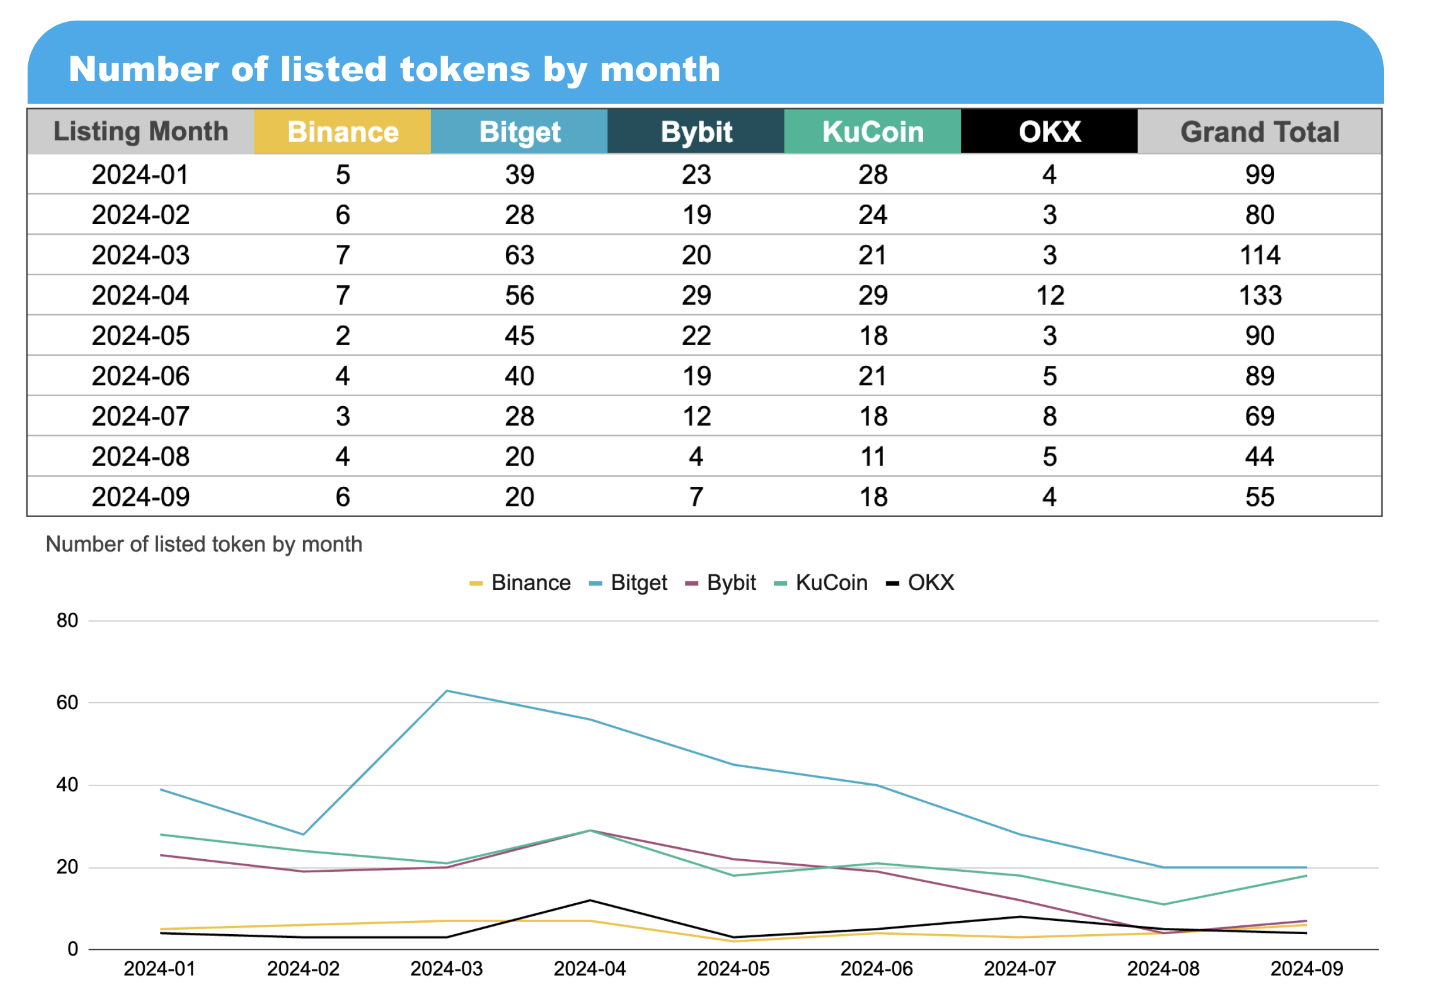
Given favorable market conditions at the beginning of the year, March and April became peak months for listing activity across exchanges, especially for Bitget, Bybit, and KuCoin, which saw a significant surge in listings. April recorded the highest number of new listings—133—while August had the lowest, with only 44. Since April, the number of listings on most exchanges has steadily declined until August.
Total Trading Volume in First Month After Listing
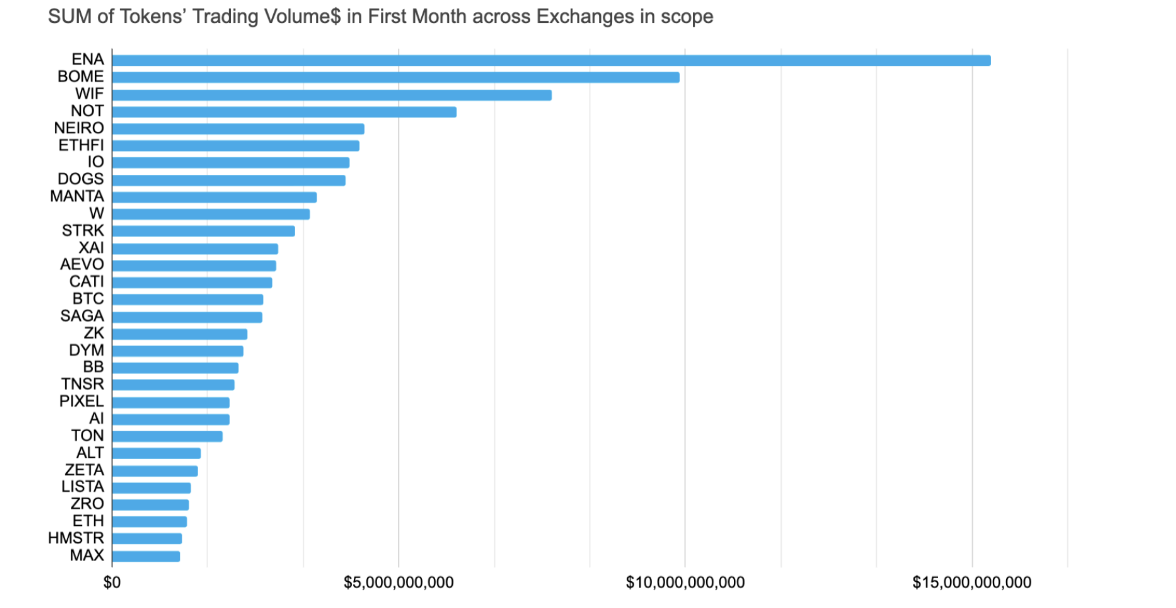
The chart above shows the 30 tokens with the highest trading volume to date this year. ENA leads with over $15 billion in trading volume during its first month. Among popular meme tokens, BOME, NEIRO, and WIF saw notably high trading activity. Meanwhile, tokens such as ZRO, TON, and IO generated first-month trading volumes ranging from $1 billion to $5 billion.
MC/FDV Ratio and Average Token FDV
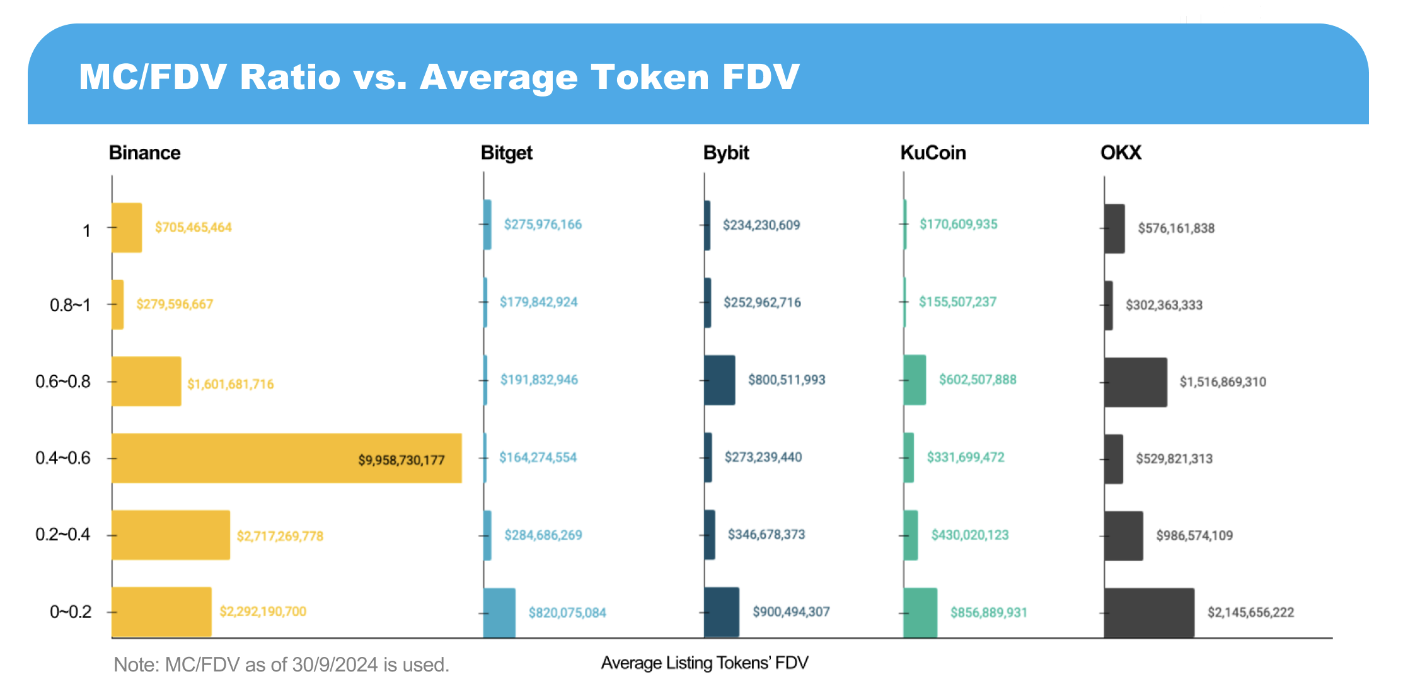
The MC/FDV (Market Cap to Fully Diluted Valuation) ratio is a key metric for assessing a token’s floating market cap relative to its total valuation. Analysis reveals that projects with lower circulation ratios tend to inflate their valuations.
For Binance, tokens within the 0.4 to 0.6 range account for the largest share of listed tokens by fully diluted valuation (FDV). This is primarily driven by recently listed tokens such as TON, BANANA, and XAI. At the same time, tokens in the 0 to 0.4 range—such as TAO, JUP, ENA, and ZRO—also make significant contributions to overall FDV.
OKX shows higher concentration in the 0.6 to 0.8 and 0 to 0.2 ranges. Notable high-FDV listings on OKX so far this year include JUP, ONDO, ZRO, STRK, and ZK.
The remaining three exchanges have lower FDV listings, reflecting a more diversified token selection strategy, or possibly due to Binance and OKX lagging in listing high-FDV tokens.
Number of Listed Tokens Across Different MC/FDV Ratios
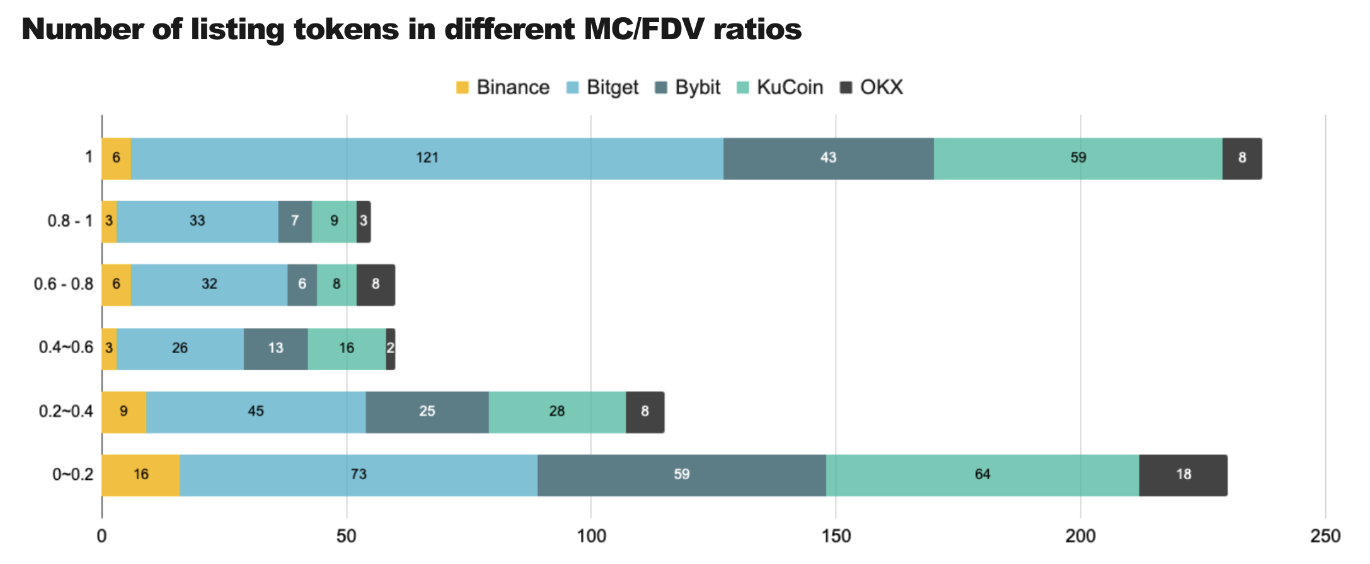
When analyzing the distribution of tokens across various MC/FDV ratios, a notable trend emerges: most tokens tend to cluster at extremely high or low MC/FDV ratios, similar to their circulating supply percentages.
Interestingly, the highest-valued tokens are those falling within the mid-range MC/FDV ratios. This indicates that tokens demonstrating both established market presence and growth potential tend to attract greater investor interest.
Trading Volume by Exchange and Listing Month
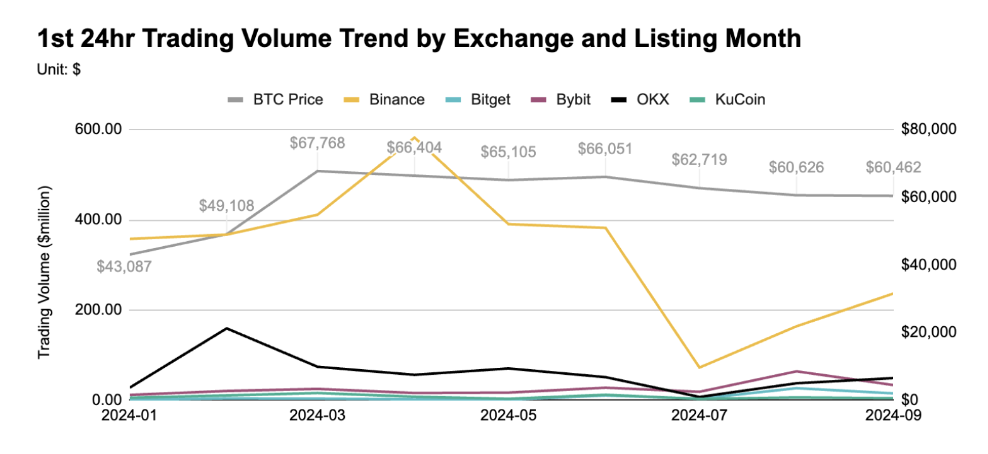
Trend in first 24-hour trading volume (by exchange and listing month)
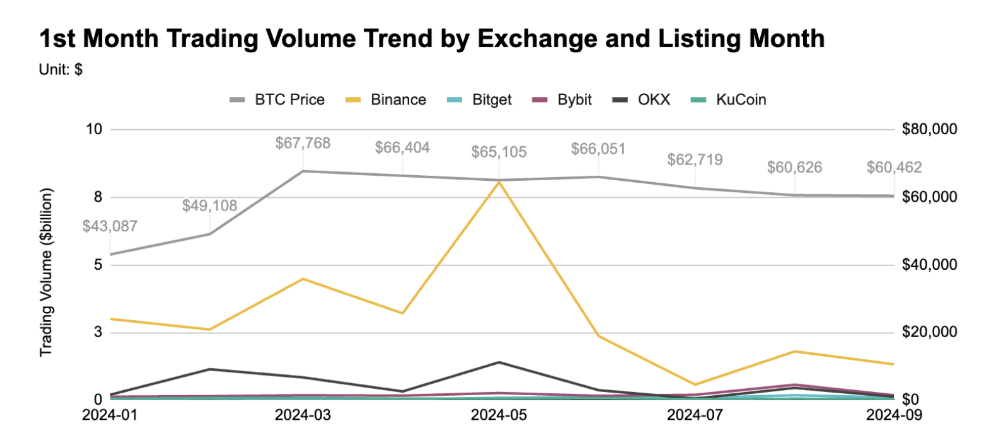
Trend in first-month trading volume (by exchange and listing month)
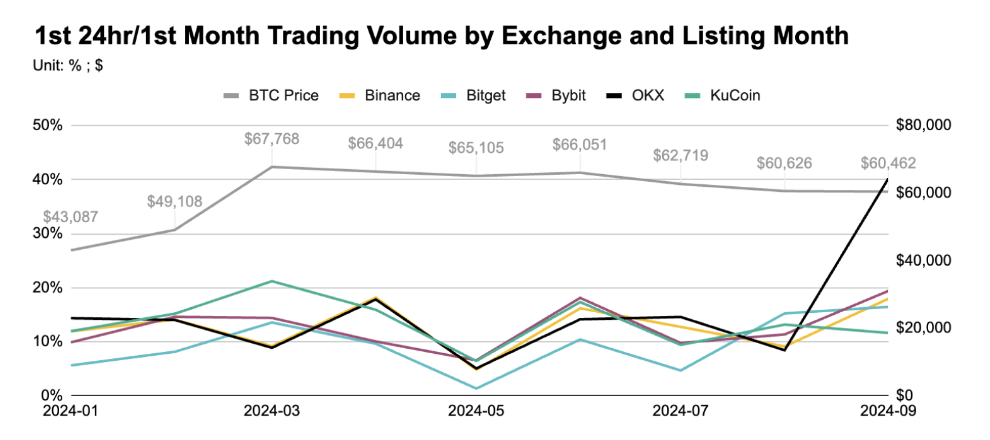
First 24-hour vs. first-month trading volume (by exchange and listing month)
Initial trading activity:
After listing, the first 24-hour trading volume typically accounts for 5–20% of the first-month volume, depending on the exchange. OKX was an outlier in September, where 40% of its volume was driven by CATI and HMSTR tokens, while KuCoin showed stronger early engagement in the earlier months.
Trading volume:
Among the five exchanges, Binance leads the market in both average first 24-hour and first-month trading volumes, followed by OKX. For Binance, April marked the peak in average first-day trading volume, while May saw the highest first-month volume. Both metrics hit their lowest point in July and partially recovered in August and September. A similar pattern of decline and recovery is observed on OKX.
First-Day Closing Price vs. ATH Price (by Exchange and Listing Month)
Average Days from Listing to ATH (by Exchange and Listing Month)
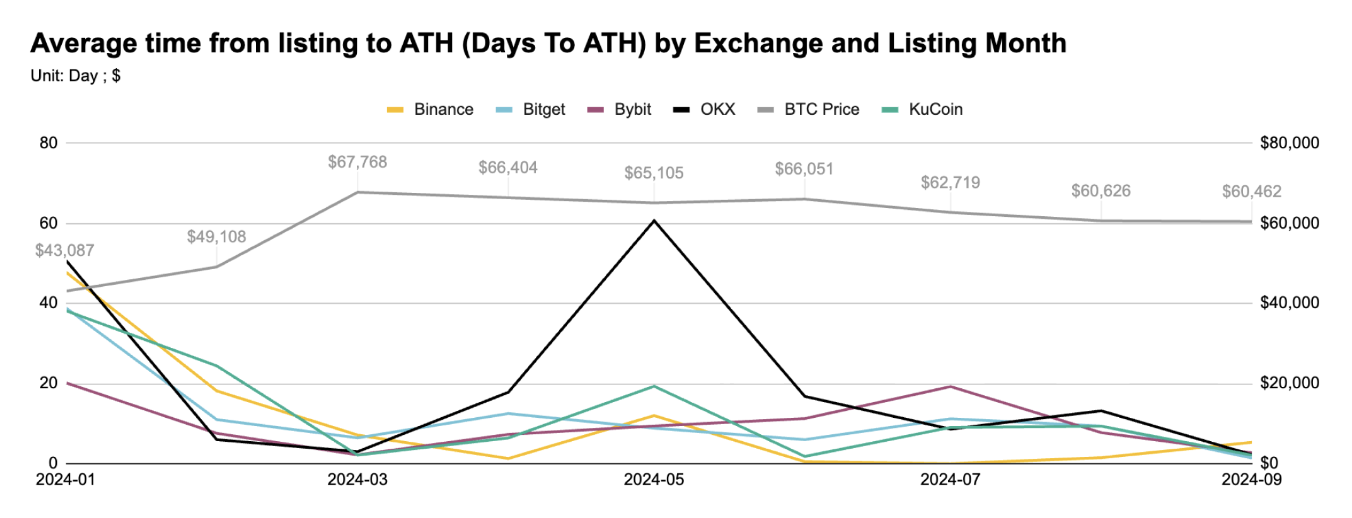
Average number of days for newly listed tokens to reach all-time high (ATH) after listing
Average ATH ROI by Exchange and Listing Month
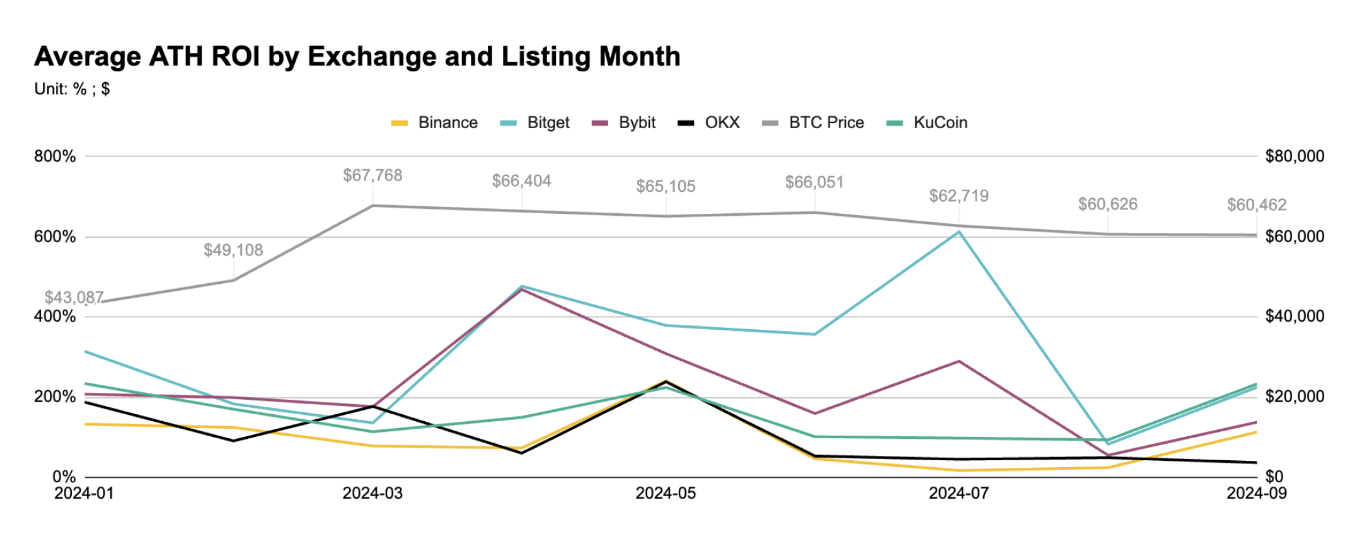
ATH ROI % (average percentage change between ATH and listing price)
Listing performance:
In terms of the ratio between ATH price and first-day closing price, Bybit and Bitget recorded the highest average ATH ROIs between April and July. Meanwhile, Binance was the fastest among the five exchanges to reach ATH between January and March—a period marked by significant Bitcoin price volatility.
Shift in market greed:
The number of days required to reach ATH decreases when BTC prices rise sharply, likely due to increased investor interest in newly listed tokens during periods of strong BTC price movements, such as from January to March.
Join TechFlow official community to stay tuned
Telegram:https://t.me/TechFlowDaily
X (Twitter):https://x.com/TechFlowPost
X (Twitter) EN:https://x.com/BlockFlow_News


