Will the market reverse? Reviewing 7 Bitcoin bottom-picking indicators
TechFlow Selected TechFlow Selected
Will the market reverse? Reviewing 7 Bitcoin bottom-picking indicators
Judging Bitcoin's price position from 7 perspectives.
Author: Viee, Core Contributor at Biteye
Editor: Crush, Core Contributor at Biteye
What phase is the market in?
Is the market bullish or bearish? Is it still possible to buy the dip?
Falling prices are nerve-wracking—does the bull market still exist?
To better analyze the current trend, Biteye has compiled 7 BTC dip-buying indicators.
Use them to assess market sentiment and price volatility from multiple angles! Share and save for future study!
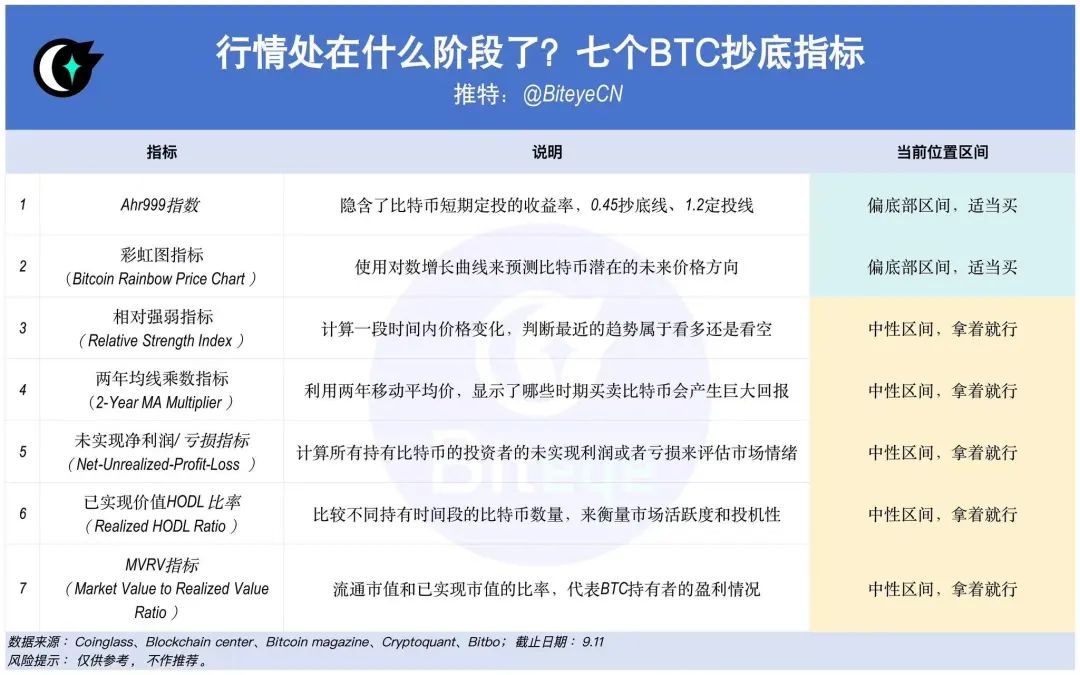
01 Ahr999 Index
Current value: 0.6, within the dollar-cost averaging (DCA) range
Interpretation: This indicator reflects the short-term DCA return rate of Bitcoin and the deviation between Bitcoin's price and its expected valuation.
Buy-the-dip threshold: 0.45; DCA threshold: 1.2
- When the AHR999 index < 0.45, the indicator suggests buying the dip
- When the AHR999 index is between 0.45 and 1.2, the indicator suggests DCA purchases
- When the AHR999 index > 1.2, the price is relatively high and not suitable for active operations
Trend review: Since mid-April, the index has fluctuated around 1.2. It definitively dropped below 1.2 since June, entering the DCA zone. Over the past three months, it has been steadily approaching the buy-the-dip threshold of 0.45.
02 Rainbow Chart Indicator (Bitcoin Rainbow Price Chart)
Current value: In a relatively cold market zone, suitable for buying
Interpretation: Uses a logarithmic growth curve to predict Bitcoin’s potential future price direction. There are 10 color bands—warmer colors at the top indicate overheated markets and good selling points, while cooler colors suggest low market sentiment and favorable buying opportunities.
Trend review: This year, Bitcoin’s price has mostly stayed within the cooler color bands. The market hasn’t heated up yet, making current prices suitable for buying.
03 Relative Strength Index (RSI)
Current value: 58.41, not yet in the buy-the-dip zone
Interpretation: The RSI evaluates recent price changes to determine whether the trend is bullish or bearish. The score is assessed relative to the previous 12 months.
- High RSI means the price trend is very positive compared to the past 12 months
- Low RSI means the price movement is very negative compared to the past 12 months
- RSI > 70: Bitcoin is overbought, likely to fall soon—consider selling
- RSI < 30: Bitcoin is oversold, likely to rebound—good time to buy the dip
Trend review: Historically, the RSI has not yet fallen below 30. When using this indicator, consider values closer to 30 as increasingly oversold, and those near 70 as increasingly overbought.
04 Two-Year Moving Average Multiplier (2-Year MA Multiplier)
Current value: BTC at $57,604, in a neutral price range
- Two-year MA (2YMA): 38,018
- Two-year MA times five (2YMA x5): 190,092
Interpretation:
Uses the two-year moving average line (2YMA, green line) and its fivefold multiplier (red line) to highlight periods when buying or selling Bitcoin could yield significant returns.
- Price < 2YMA (green line): Price at historical lows—ideal for buying the dip
- Price > 2YMA x5 (red line): Price at historical highs—time to sell and exit
- Price between the two lines: Neutral zone
Trend review: Currently in the neutral range—not yet time for full-scale dip buying. From May 2022 to October 2023, the indicator was in the buy-the-dip zone.
05 Net Unrealized Profit/Loss (NUPL) Indicator
Current value: 45.33%, not the optimal buying zone
Interpretation: Evaluates market sentiment by calculating the unrealized profit or loss across all Bitcoin holders.
- NUPL < 0: Market in extreme fear due to losses—ideal for buying the dip
- NUPL 0–0.25: Slight profit zone—still suitable for buying
- NUPL 0.25–0.5: Transition between bear and bull markets—gradually entering a bull phase
- NUPL 0.5–0.75: Strong bullish sentiment
- NUPL 0.75–1: Extreme greed—consider exiting positions
In other words, the further NUPL deviates from 0, the closer the market is to a bottom or peak.
Trend review: Since January 2023, the market has moved out of the loss zone into profitability. From February to July this year, NUPL exceeded 0.5, indicating strong bullish sentiment. However, over the past two months, NUPL has dropped to the 0.25–0.5 range, reflecting a cooling market mood.
06 Realized HODL Ratio (RHODL Ratio)
Current value: 2689.22, in the neutral zone
Interpretation: Measures market activity and speculation by comparing Bitcoin holdings over different timeframes—such as short-term (within 1 month) versus long-term (over 1 year) UTXOs (unspent transaction outputs). A higher value indicates more short-term holders and higher speculation; a lower value suggests a higher proportion of long-term holders and a more stable market.
- Approaching the red zone: Market overheating—ideal for taking profits
- Approaching the green zone: Cold market—favorable for buying the dip
Trend review: Since January 2023, the RHODL Ratio has gradually risen from the green zone. Over the past few months, it has entered a downtrend, reflecting declining market enthusiasm but not yet fully cooled down.
07 MVRV Indicator (Market Value to Realized Value Ratio)
Current value: 1.83, market has not yet reached the bottom zone
Interpretation: MVRV is a relative metric—the ratio of market cap (MV) to realized cap (RV), i.e., total market value divided by the value calculated based on the last active price of each BTC. It reflects the profitability of Bitcoin holders.
- MVRV > 3.5: Market at peak levels—holders have large profits and are more inclined to sell
- MVRV < 1: Market at bottom—most holders are at a loss, with holding preference outweighing selling intent, increasing the likelihood of price recovery
Trend review: Over the past three to four months, the indicator has shown a downward trend, meaning holder profits are gradually shrinking. The closer it gets to the bottom zone, the higher the probability of a market rebound.
Join TechFlow official community to stay tuned
Telegram:https://t.me/TechFlowDaily
X (Twitter):https://x.com/TechFlowPost
X (Twitter) EN:https://x.com/BlockFlow_News