

The calm before the rate cut: BTC's effective breakout requires more patience
TechFlow Selected TechFlow Selected
The calm before the rate cut: BTC's effective breakout requires more patience
The market remains in a fragile balance ahead of the clear rate cut in September.
By Shang2046
The market, projects, cryptocurrencies, information, opinions, and judgments mentioned in this report are for reference only and do not constitute any investment advice.
After six months of consolidation at high levels, BTC has squeezed out excess liquidity and is poised for a breakout. However, U.S. macroeconomic conditions have temporarily become the dominant force shaping market direction.
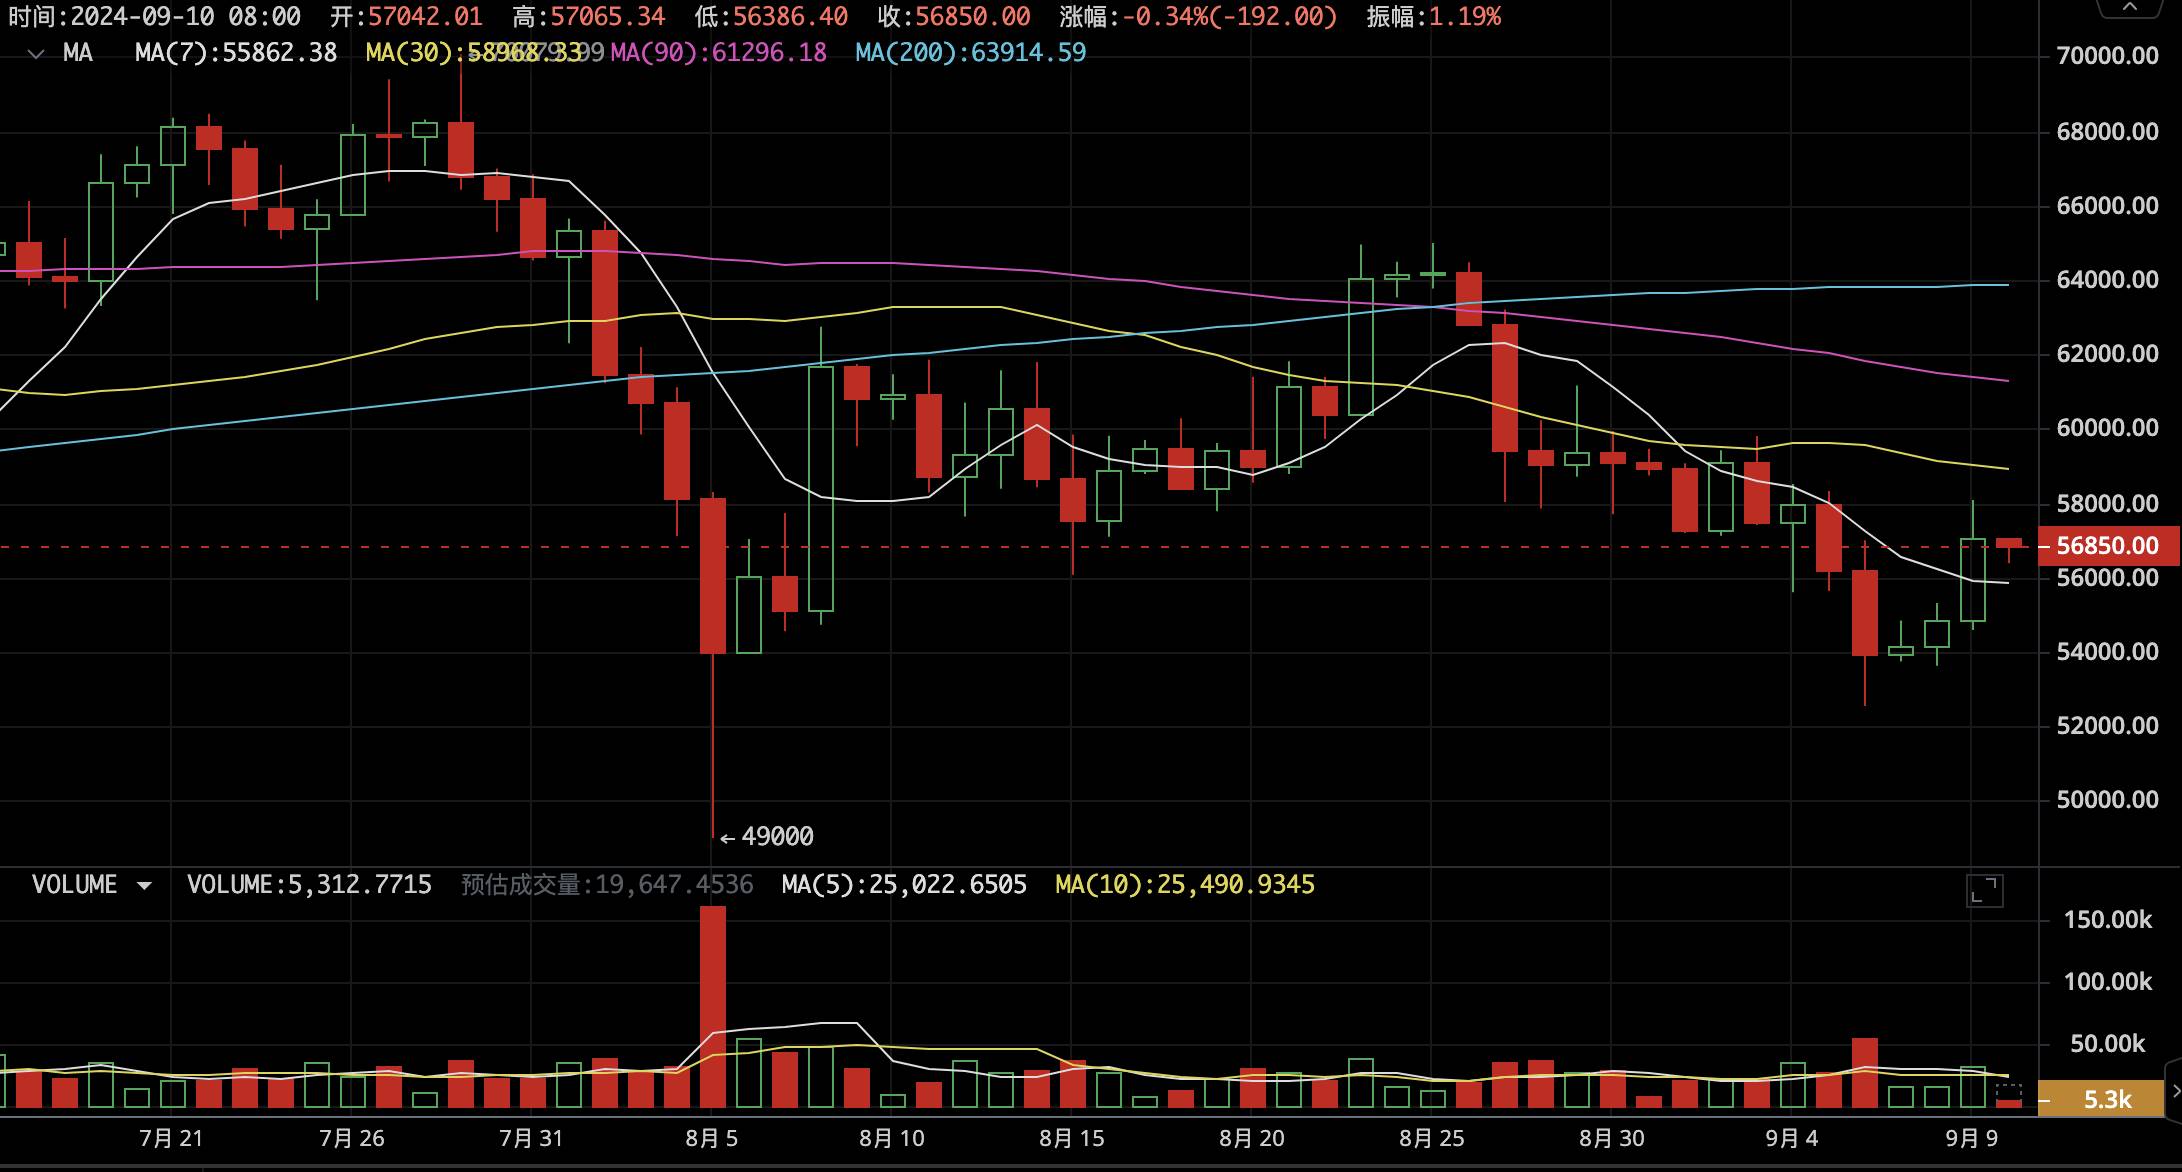
Market Weekly Recap
This week, BTC opened at $57,301 and closed at $54,867, with a volatility of 12.6%. The price briefly dipped into the $52,000 range—very close to the $49,000 level from one month ago during the sharp correction, which marked the lowest point of this new consolidation zone. The gains accumulated over the prior two weeks' rebound toward $65,000 have been completely erased. For the past month, the market has hovered below the 200-day moving average, with the fear index dropping to 26—approaching levels typically seen at bear market bottoms.
As noted in our monthly report, within the $54,000–$73,700 range, nearly 2.9 million BTC have been newly accumulated over the past six months, forming a theoretically strong support base. On-chain data indicates we are returning to a situation similar to September last year: after an extended period of structural consolidation, Bitcoin’s internal market structure resembles dry tinder—once wet wood has shed its moisture, even a small spark can ignite intense flames. However, there remains no clear sign of sustained capital inflows. With market liquidity in a delicate balance and U.S. interest rates entering a highly sensitive phase, BTC has clearly ceded pricing power to the U.S. dollar system.
The U.S. non-farm payroll data released on September 6 was critical for anticipating the upcoming Federal Reserve rate decision. The addition of 142,000 jobs slightly missed market expectations of 160,000. Major U.S. financial institutions were initially divided in their interpretations. Ultimately, concerns about economic recession and ongoing deleveraging in yen carry trades triggered capital outflows from risk assets. This impact was clearly reflected in U.S.-listed Bitcoin ETFs, which recorded net outflows for eight consecutive days—the first such streak since their launch.
Following weekend digestion, Nasdaq began showing signs of recovery, while market fears of a recession eased significantly. As a result, BTC rebounded from $53,000 to around $57,000. Nevertheless, we must emphasize that until a rate cut is clearly confirmed in September, the market will remain in a fragile equilibrium. We firmly believe that once the door to rate cuts opens, it will benefit BTC. Yet historically, there is always a lag between markets pricing in expectations and actual liquidity taking effect. We anticipate that before the U.S. presidential election in November, BTC may finally break free from this painful consolidation phase driven by uncertain macroeconomic and policy conditions.
Fed and Economic Data
On September 6, U.S. labor market data showed mixed signals: non-farm payrolls increased by 142,000, below the expected 160,000; however, the unemployment rate declined to 4.2% from 4.3%, marking the lowest level in six months and the first drop after four consecutive months of increases.
Additionally, job numbers for June and July were significantly revised downward by a combined 86,000.
Following the data release, the U.S. dollar initially rose but quickly entered a sustained downtrend, ultimately closing at its lowest point of the day.
Dollar, equities, and gold all fell—reflecting growing fears of a "hard landing." The dollar-yen pair dropped to the same low seen on August 5 during the collapse of carry trades. The Nasdaq remains approximately 6% above that previous low.
Stablecoins and ETFs
Combined flows across both stablecoin and ETF channels recorded nearly $500 million in net outflows. ETFs alone saw $706 million in outflows (the second-largest weekly outflow on record), marking eight consecutive days of capital withdrawal.
Stablecoins recorded $120 million in net inflows, with previously strong USDT turning weak—posting a $12 million outflow for the week—while USDC saw $158 million in inflows.
The SSR Index has approached the lower Bollinger Band, the first time since January last year, indicating that stablecoin supply relative to BTC price is severely undervalued and primed for a significant rebound.
Supply Analysis
In price ranges above $54,000, a total of 5.985 million BTC have been accumulated, with 30.31% currently underwater. This percentage of loss-takers is lower than the 41% observed in September last year.
Long-term holder supply continues to mature, increasing by 40,000 BTC, while short-term holders decreased by 45,000 BTC. The 7-day average of selling volume from both long and short-term holders shows a declining trend, suggesting limited selling pressure.
The de-stocking trend at centralized exchanges has paused, with inventories rising by 5,000 BTC. This decline in buying pressure corresponds with slowing stablecoin inflows and ongoing ETF outflows.
BTC On-Chain Data
BTC new addresses and active addresses remain at low levels but without significant further declines—overall stability persists.
Ethereum ecosystem new and active addresses have declined notably, though total transactions remain high.
Solana's new addresses saw a slight decrease, but active addresses hit a new high, with total transactions staying elevated.
Cycle Indicators
The EMC BTC Cycle Metrics indicator stands at 0, meaning bull market signals remain temporarily dormant.
Join TechFlow official community to stay tuned
Telegram:https://t.me/TechFlowDaily
X (Twitter):https://x.com/TechFlowPost
X (Twitter) EN:https://x.com/BlockFlow_News


