Riot’s Earnings Breakdown: When BTC Falls Below $74K, Miners Can’t Even Recoup Electricity Costs
TechFlow Selected TechFlow Selected
Riot’s Earnings Breakdown: When BTC Falls Below $74K, Miners Can’t Even Recoup Electricity Costs
Bitcoin miners need $74K to cover electricity costs, and must wait until $114K to achieve real profitability.
Author: CryptoSlate
Translation: TechFlow
TechFlow Intro: Bitcoin is currently trading at approximately $67,000. At this price, miners’ electricity costs are barely breaking even—but broader operational expenses and depreciation leave them still unprofitable overall. This article constructs a three-tier cost model using Riot Platforms’ real financial data, deconstructing the oversimplified metric of “mining cost” to reveal its full complexity—offering direct insight into mining stock valuations and Bitcoin’s key price resistance levels.
It is cheaper to buy Bitcoin than to mine it—unless your electricity cost is below $0.07 per kWh.
Full Text Below:
The Riot Case Study Reveals U.S. Miners’ Three-Tier Profitability Structure
Bitcoin mining cost is often reduced to a single figure: “cost per BTC mined.” In reality, this number depends entirely on which level of business operations you’re measuring.
Electricity cost determines whether to turn machines on today; operating expenses determine whether the mining facility can sustain the entire company; accounting costs determine whether the business ultimately reports a profit.
To clarify these three layers, CryptoSlate built a Bitcoin mining cost model grounded in first principles—calculating mining economics based on network difficulty, block reward, transaction fees, ASIC efficiency, and electricity price.
The model then incorporates company-level cost data from Riot Platforms’ publicly filed financial documents to reflect real-world economics.
Under current network conditions, the model shows miners can cover electricity costs but still fall short of covering broader operational and accounting expenses.
Riot’s Texas operations reveal that—even after Bitcoin’s price rebound—the breakeven points for electricity, operations, and full accounting profitability remain widely separated.
Riot’s Mining Economics Reveal a Three-Tier Profitability Structure
At the current Bitcoin price of $67,200, Riot has crossed the first breakeven threshold—but not the second or third.
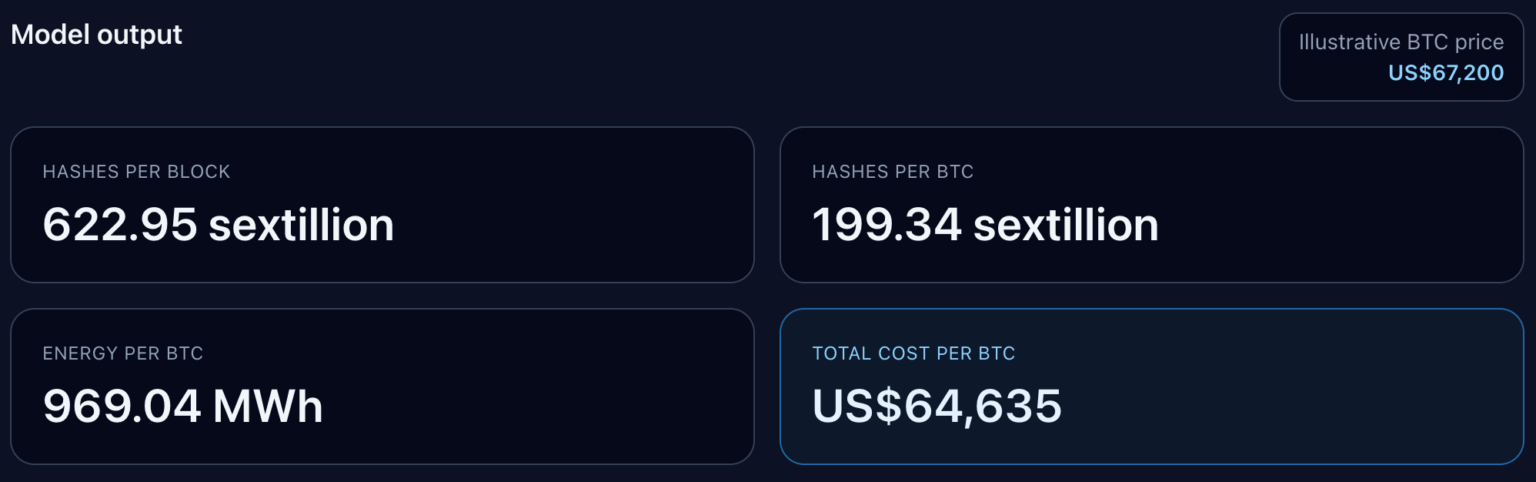
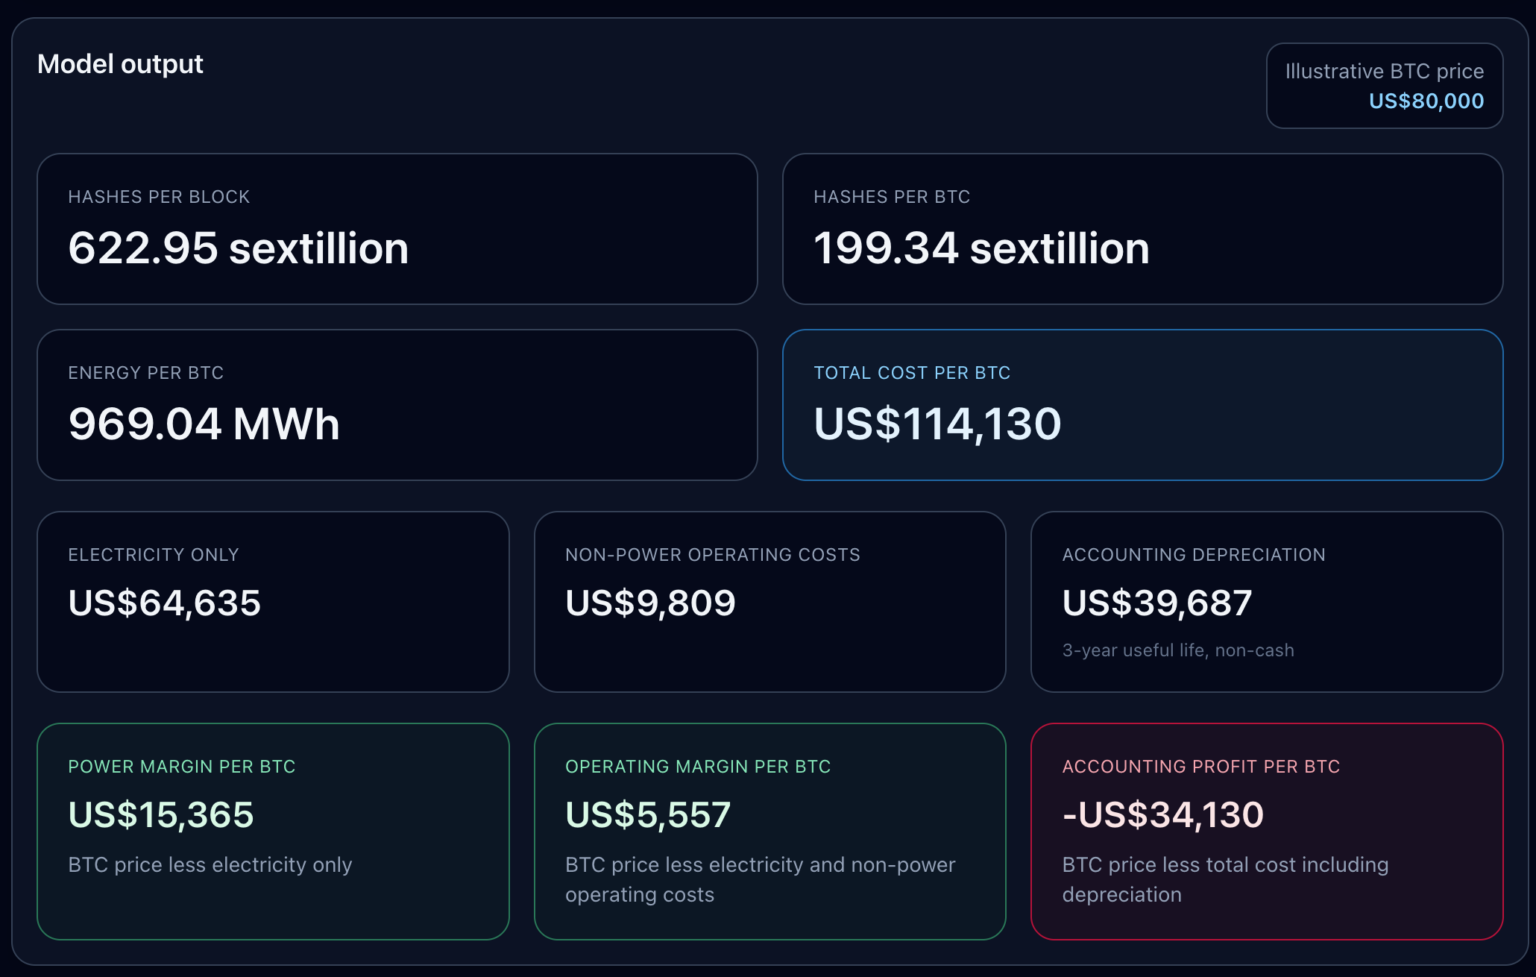
The model is built using the following current network parameters: Bitcoin difficulty of 145,042,165,424,850; block reward of 3.125 BTC; modern ASIC efficiency of ~17–19 J/TH; and Texas industrial electricity rate of ~$0.0667/kWh. Given the current average fee of ~0.02 BTC per block, block fees are excluded from this model.
These inputs yield the following results: network hash rate per block = 622.95 EH/s; hash rate required per BTC = 199.34 EH/s; energy consumption per BTC = 969.04 MWh.
Accordingly, the electricity cost to mine one BTC at current prices is $64,635, yielding an electricity profit of $2,565 per BTC.
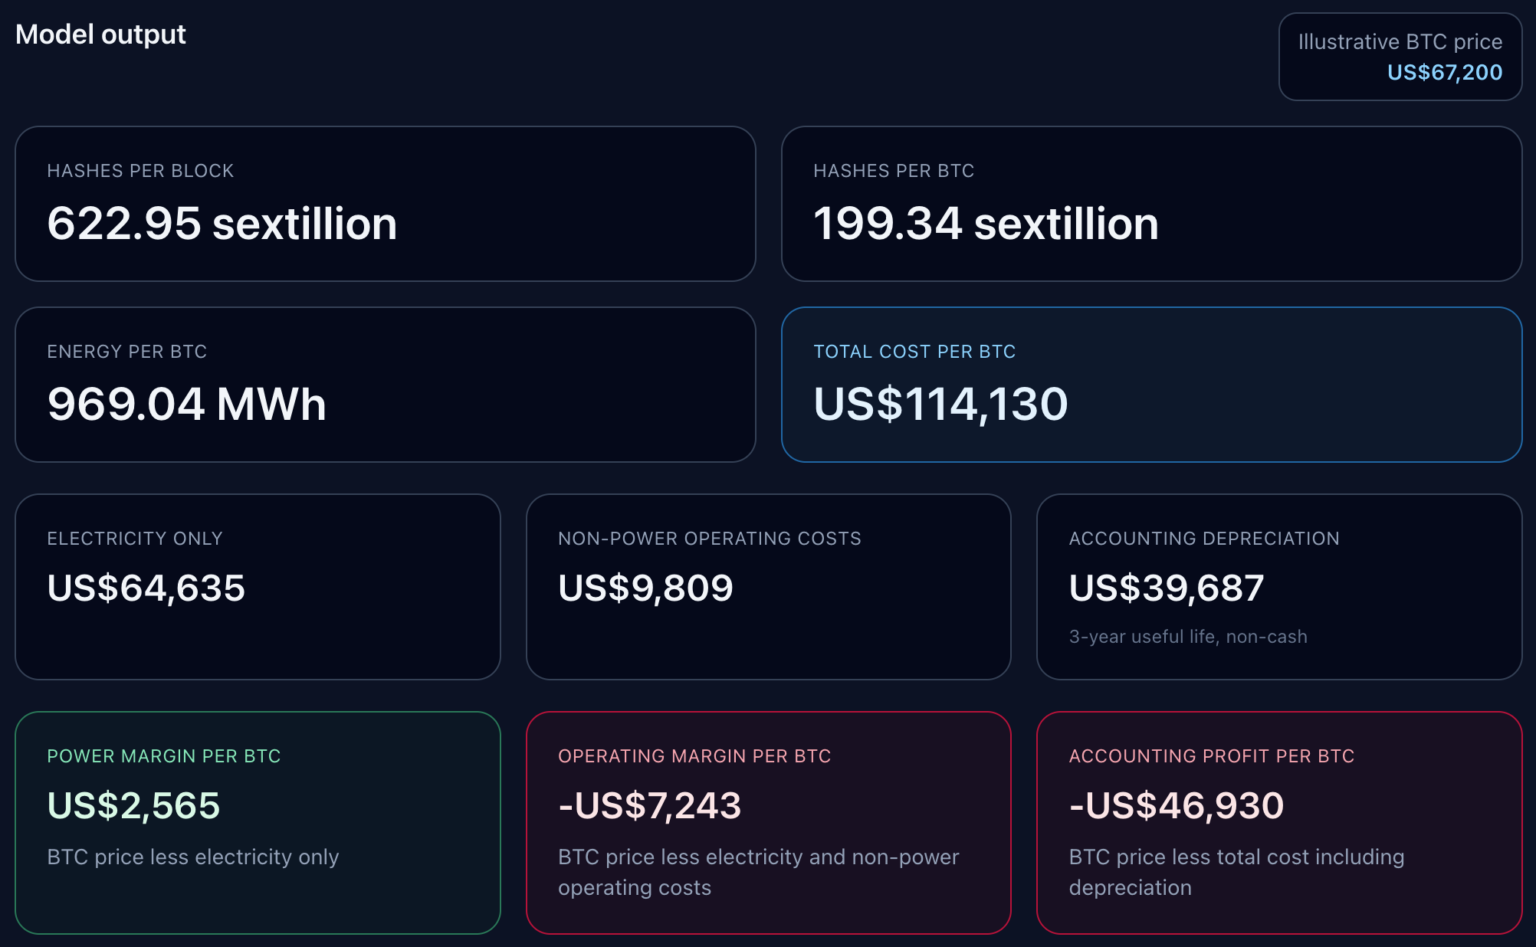
Adding Riot’s non-electricity operational costs—approximately $9,809 per BTC—turns the operational profit negative at -$7,243, raising total cost accordingly. Further adding non-cash depreciation of ~$39,687 per BTC drives accounting profit down to -$46,930.
This clearly demonstrates that for large U.S. mining companies, there is no single “cost per BTC mined.”
Layer One: Electricity cost—determines short-term viability of turning machines on.
Layer Two: Broader operational costs—determine whether self-mining can sustain the company as a whole.
Layer Three: Depreciation—determines whether reported (accounting) profit aligns with cash profit.
The model displays all three layers side-by-side, revealing just how wide the gaps remain—even after market recovery.
The Breakeven Ladder Defines the Full Operational Picture
The breakeven ladder produced by the model is far more informative than any single all-in cost figure.
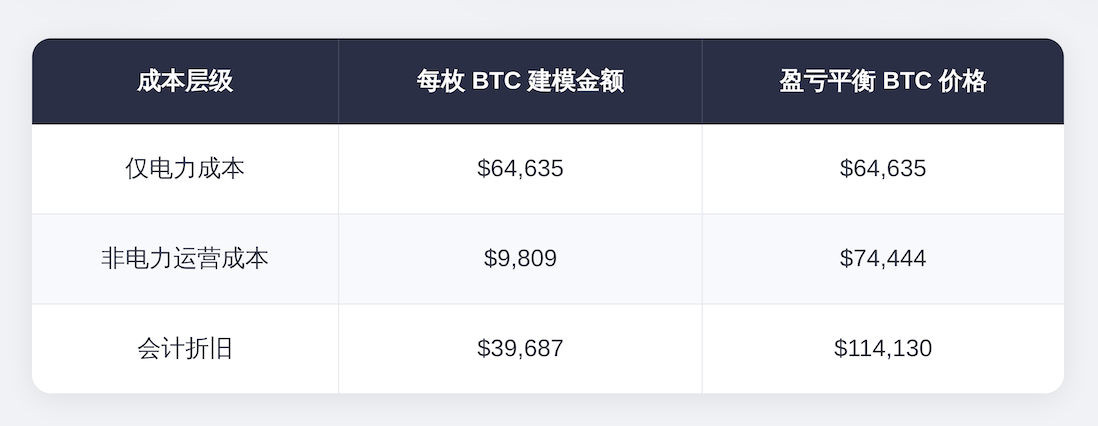
Electricity-only breakeven point: $64,635 per BTC.
After adding Riot’s non-electricity operational costs, the breakeven point rises to ~$74,444.
After including accounting depreciation, the full accounting breakeven point climbs to $114,130.
Thus, miners may report positive earnings at the electricity level while remaining unprofitable at the operational or accounting level.
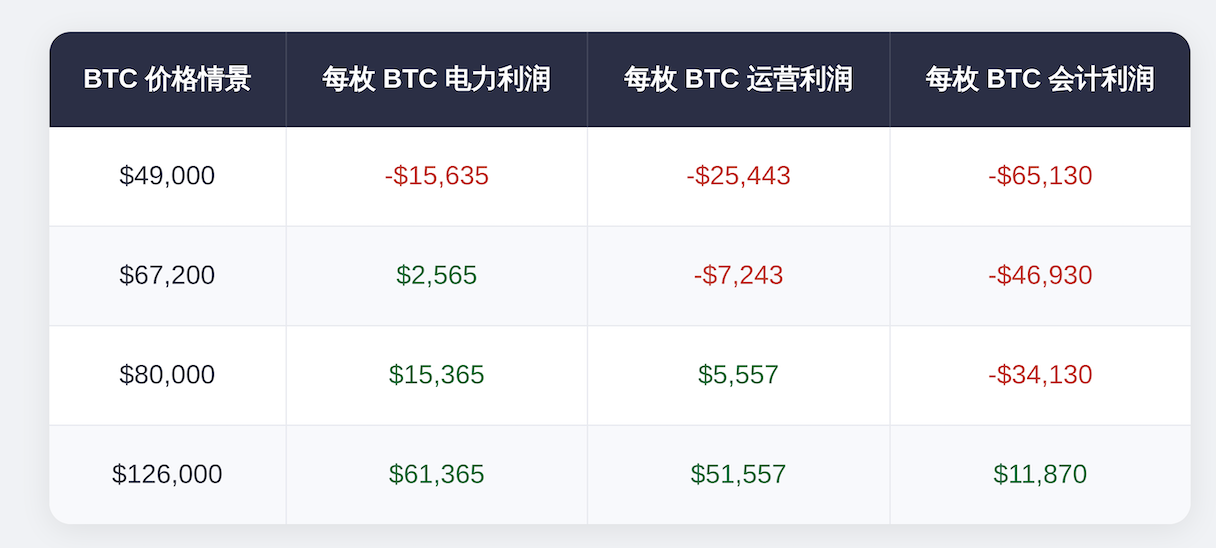
I constructed four price scenarios to demonstrate how this ladder operates in practice.
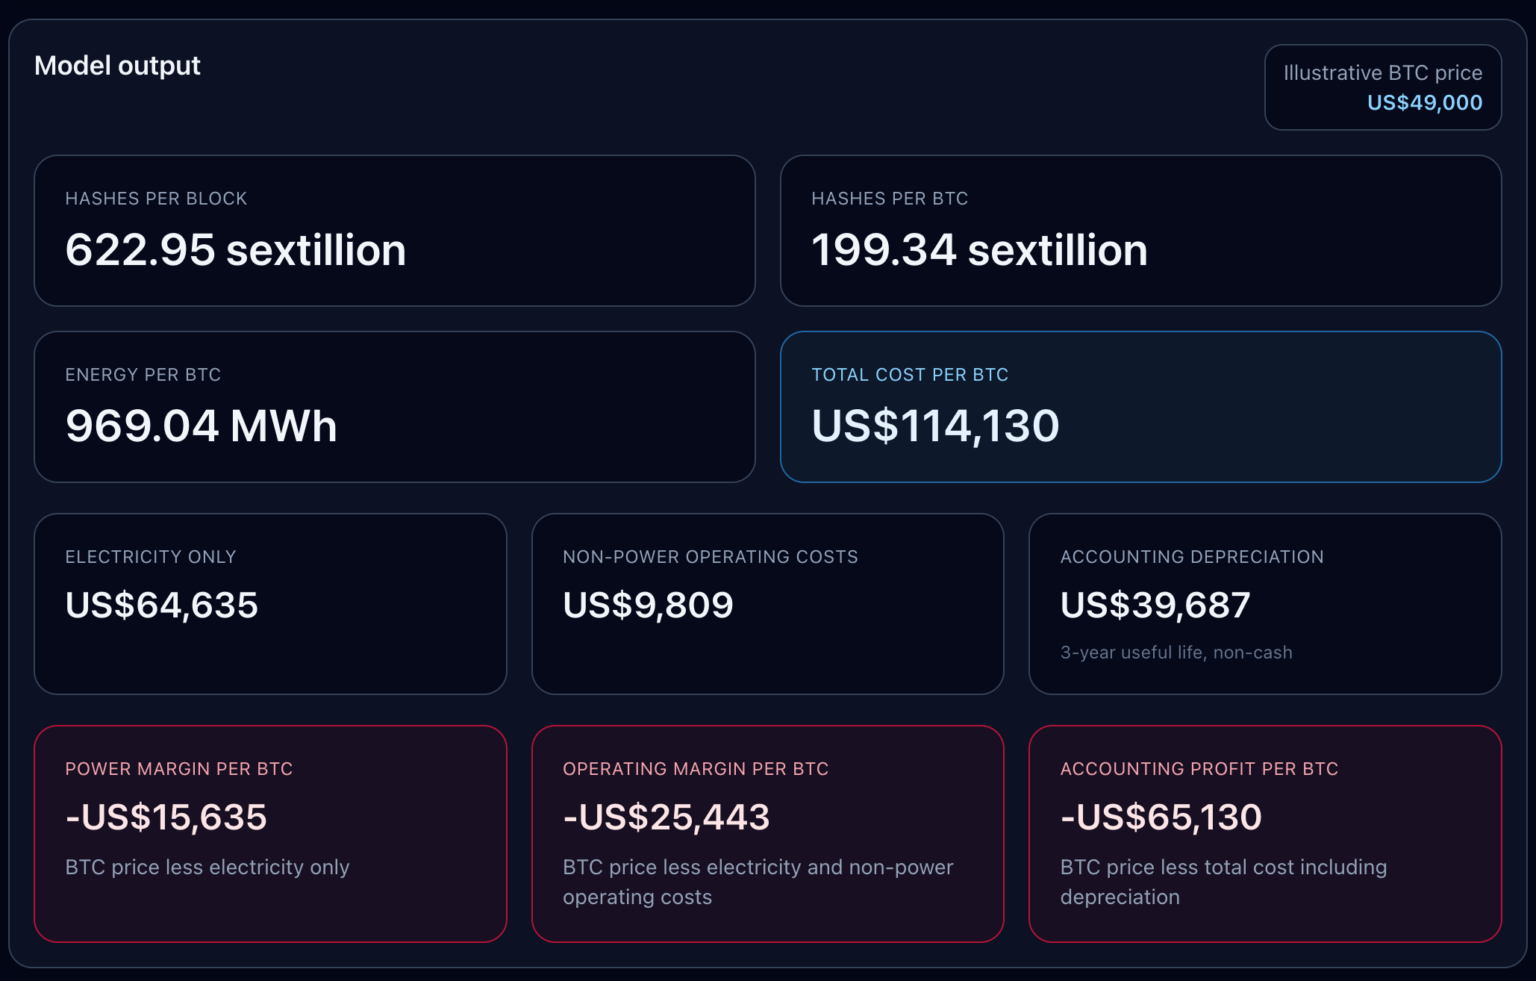
In the $49,000 bear-market scenario, Riot posts negative results across all layers: electricity profit = -$15,635/BTC; operational profit = -$25,443/BTC; accounting profit = -$65,130/BTC.
At the current price of $67,200, Riot has just crossed the electricity breakeven point—barely above the threshold. Electricity profit turns positive, while operational and accounting profits remain negative.
In the $80,000 recovery scenario, Riot crosses the operational breakeven point, achieving an operational profit of $5,557/BTC—but remains unprofitable at the accounting level, with a loss of $34,130.
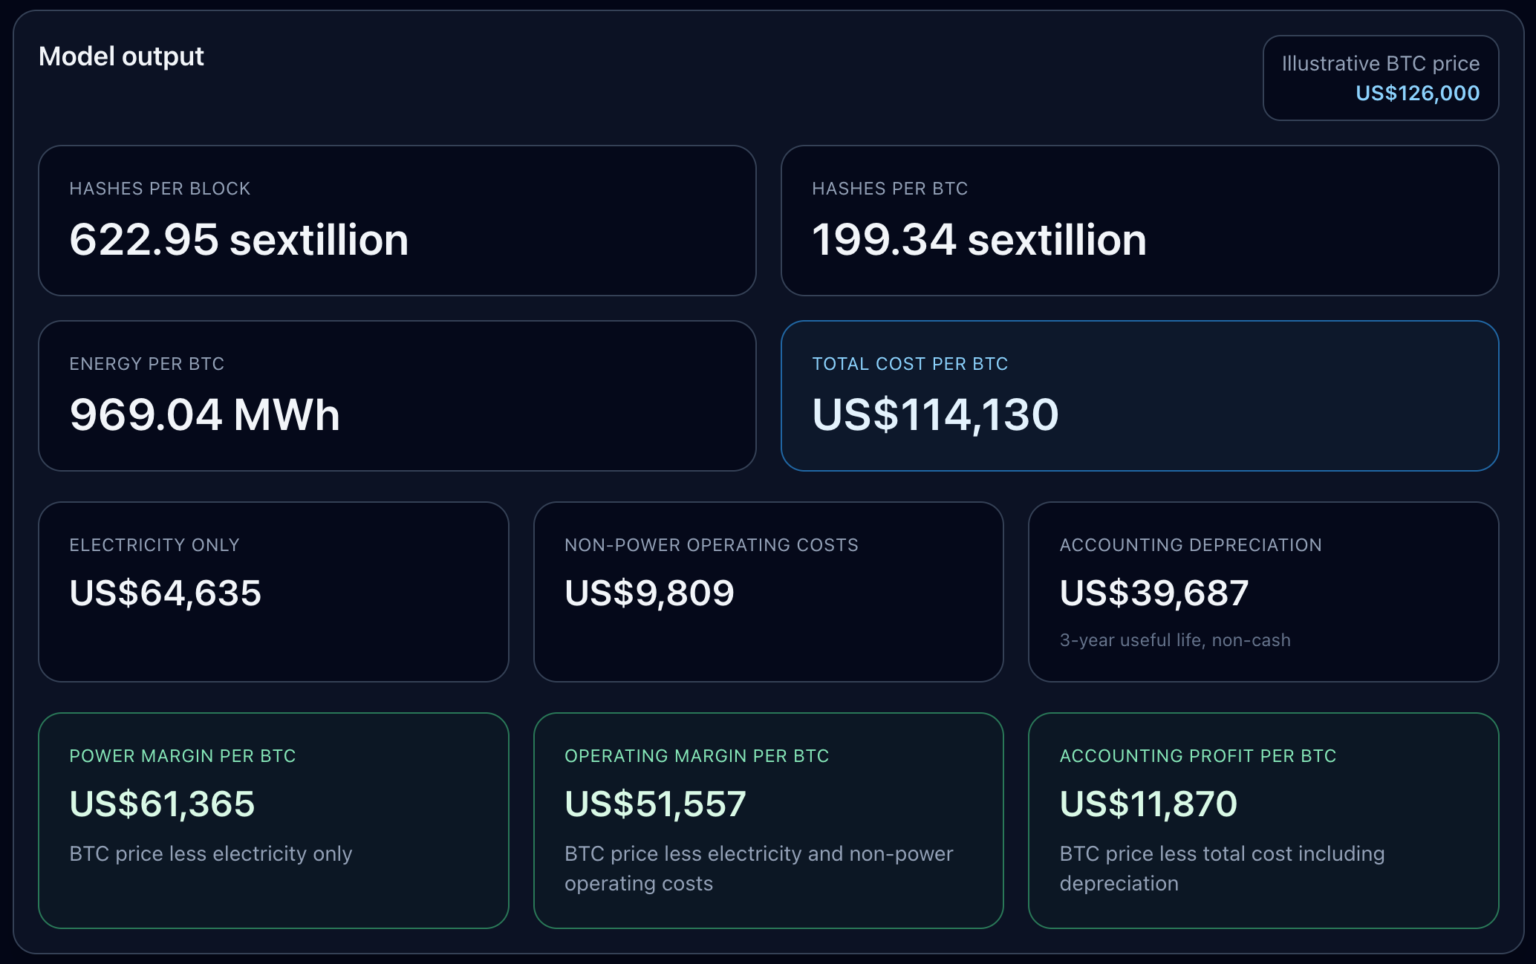
All three layers turn positive only if Bitcoin returns to its all-time high of $126,000—where accounting profit reaches $11,870/BTC.
This distinction carries real-world significance. Riot’s depreciation layer is explicitly defined as a non-cash expense—calculated over a three-year useful life—and represents accounting amortization rather than a short-term avoidable cash outflow.
Yet it remains part of this analysis because publicly listed miners cannot survive on electricity profit alone—they must report income statements, replace equipment, and cover corporate overhead.
Hence, the truly meaningful question is: Which profit line are investors, analysts, and management actually using when assessing miner profitability?
Riot’s Next Halving Price Stress Test
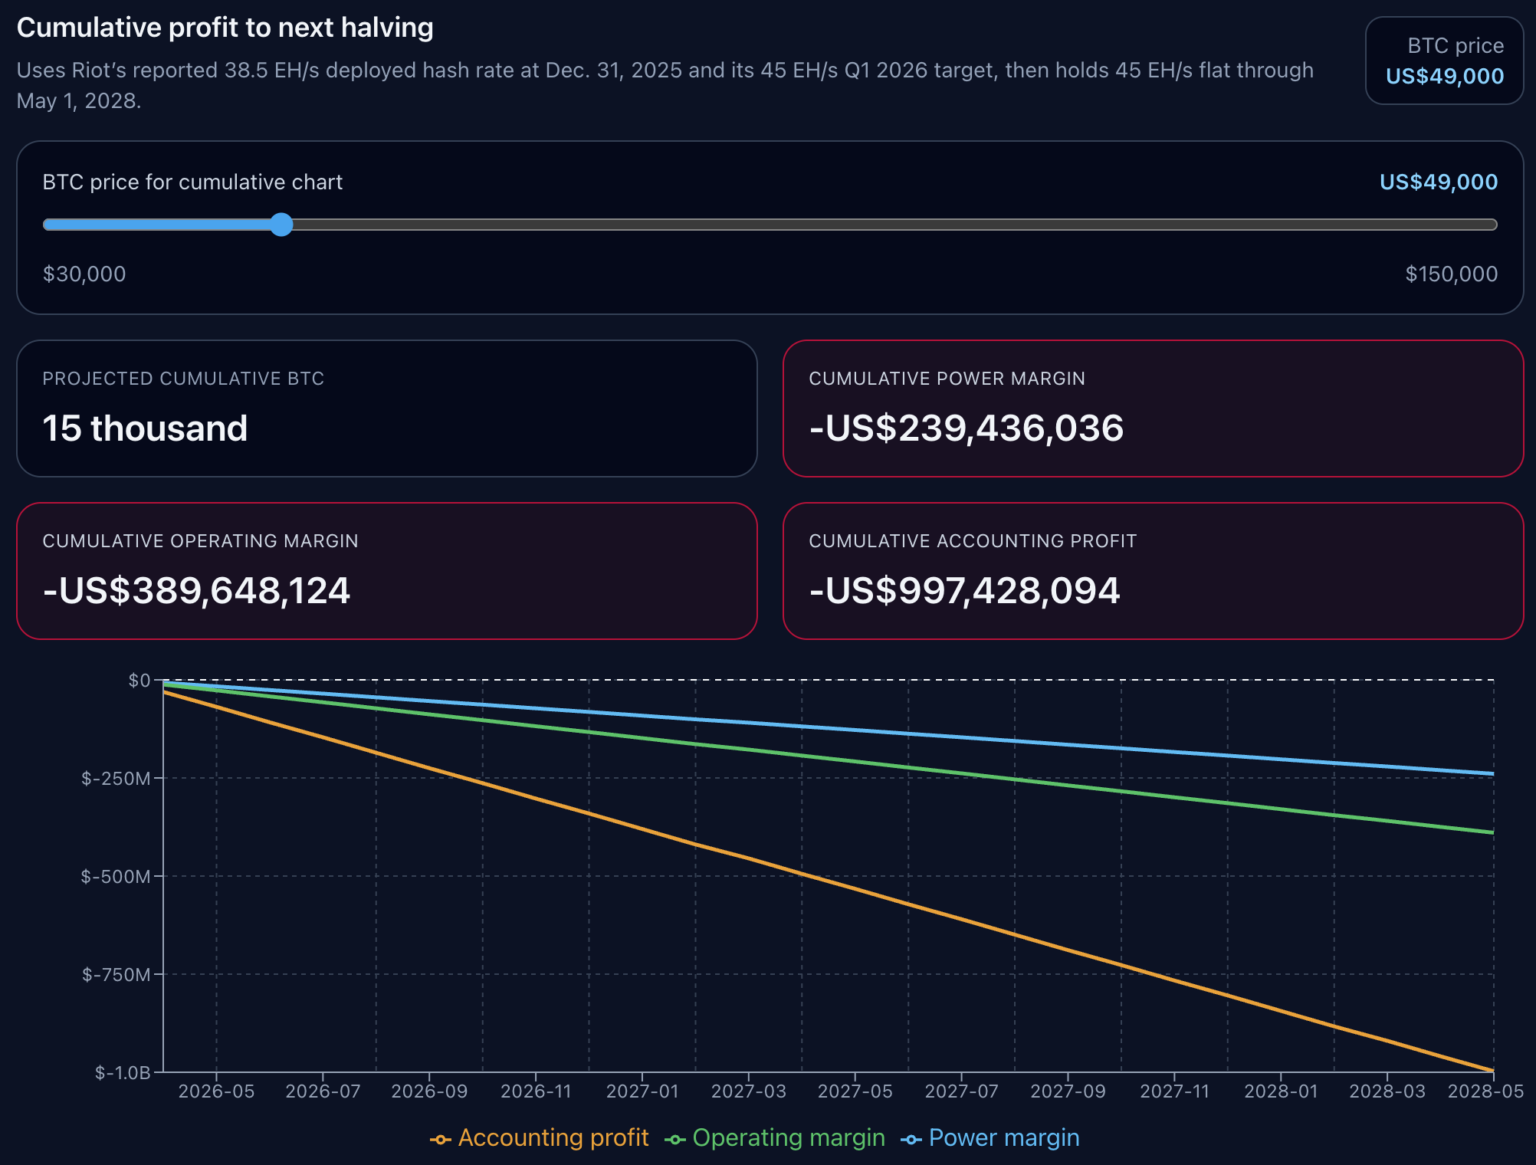
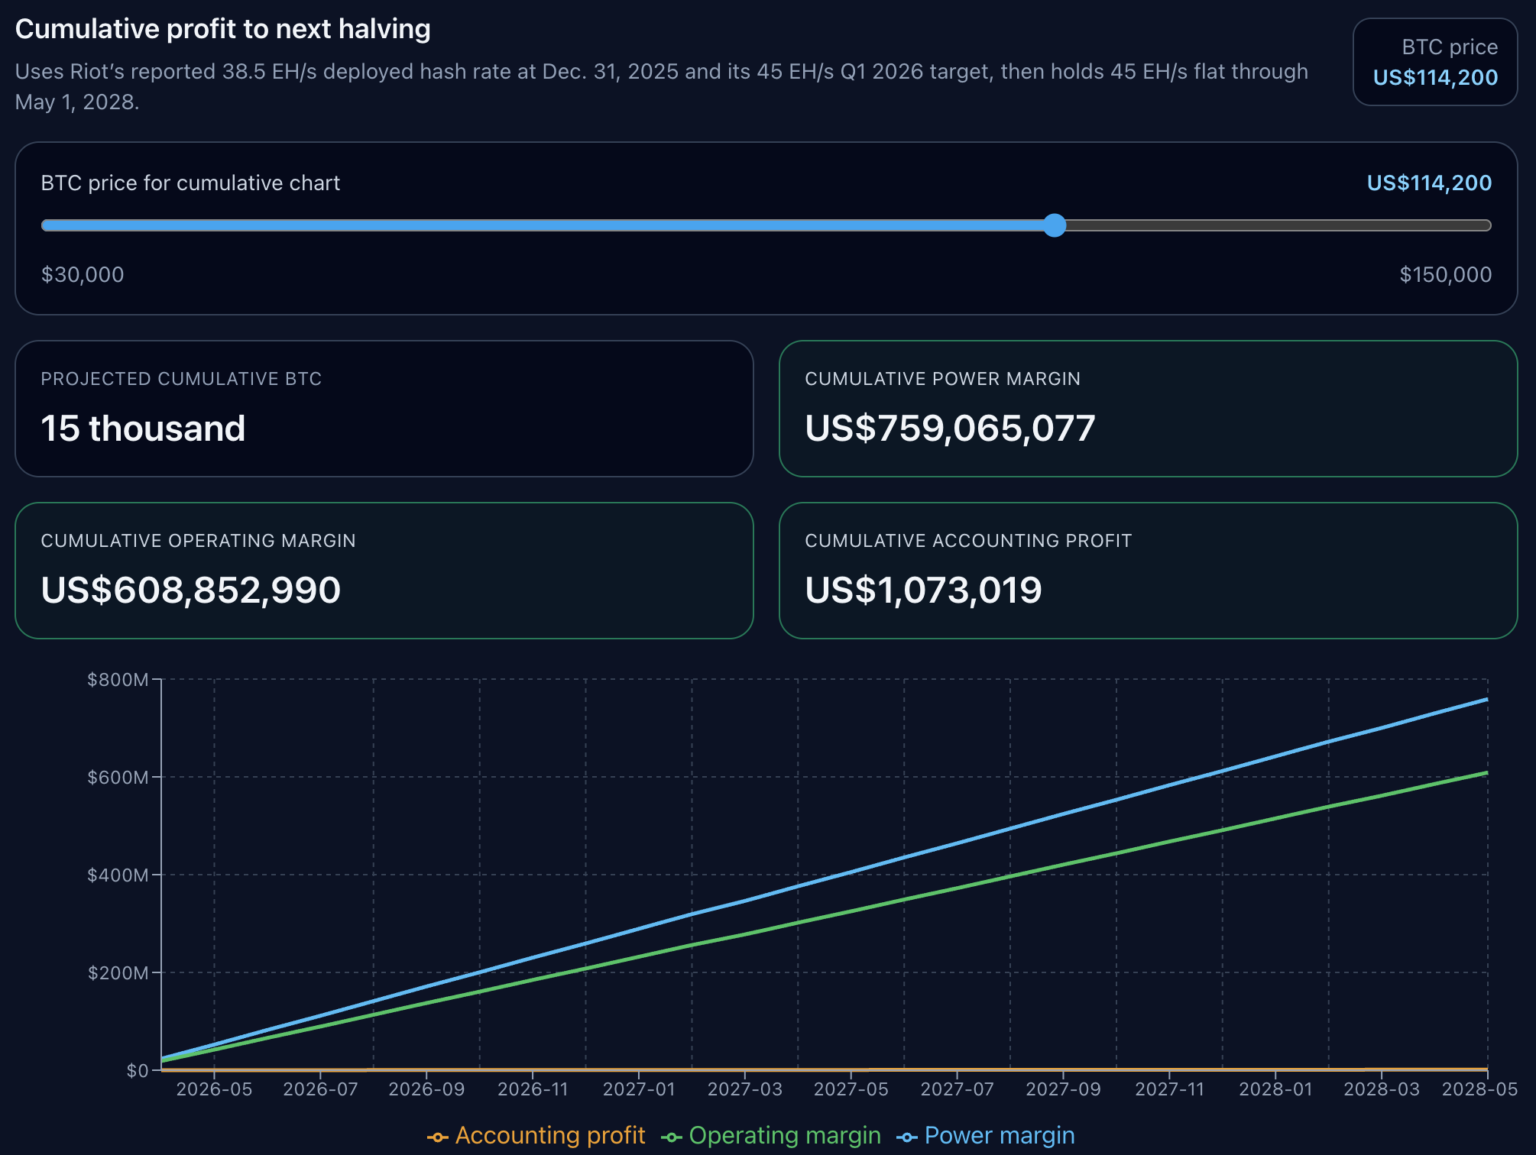
We then extend the cost model forward to the next halving in 2028.
Based on Riot’s most recent public filings, we assume current hash rate of 38.5 EH/s, rising to 45 EH/s by March 31, 2026, and holding steady thereafter until the next halving window.
This model does not attempt to reconstruct the entire market. Instead, it holds per-BTC economics constant at current levels and projects forward along Riot’s reported and planned self-mining hash rate trajectory.
This is a focused operational leverage scenario analysis—with clear price sensitivity.
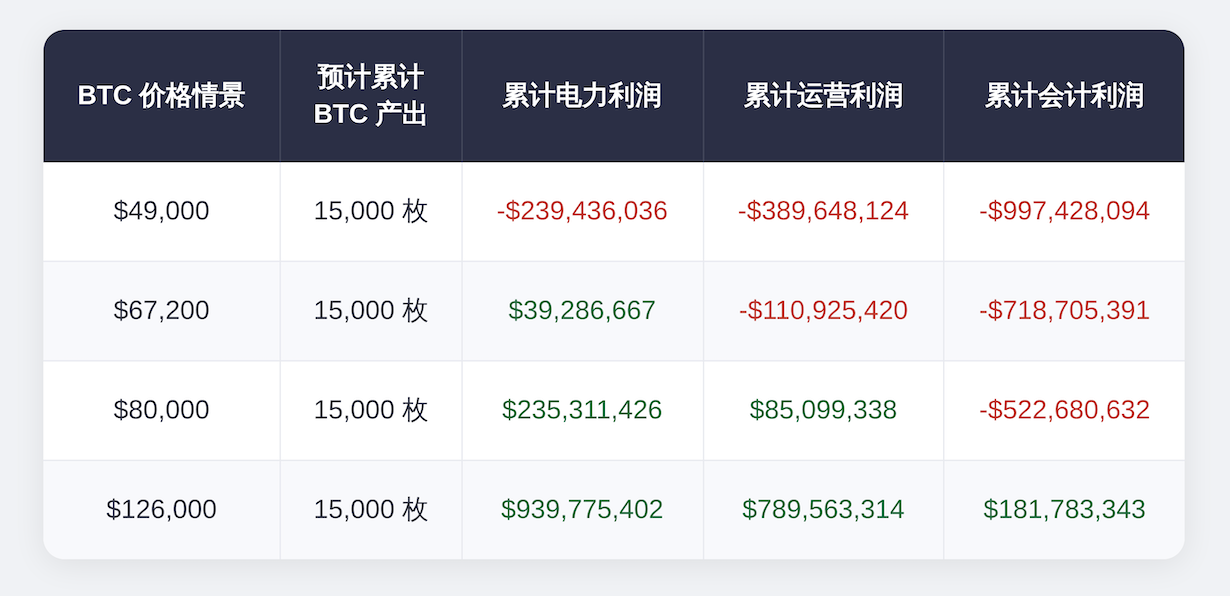
Across all four scenarios, projected cumulative mined BTC remains fixed at 15,000 units—the profit structure, however, changes.
In the $49,000 scenario, Riot’s cumulative electricity profit is -$239,436,036; cumulative operational profit is -$389,648,124; cumulative accounting profit is -$997,428,094.
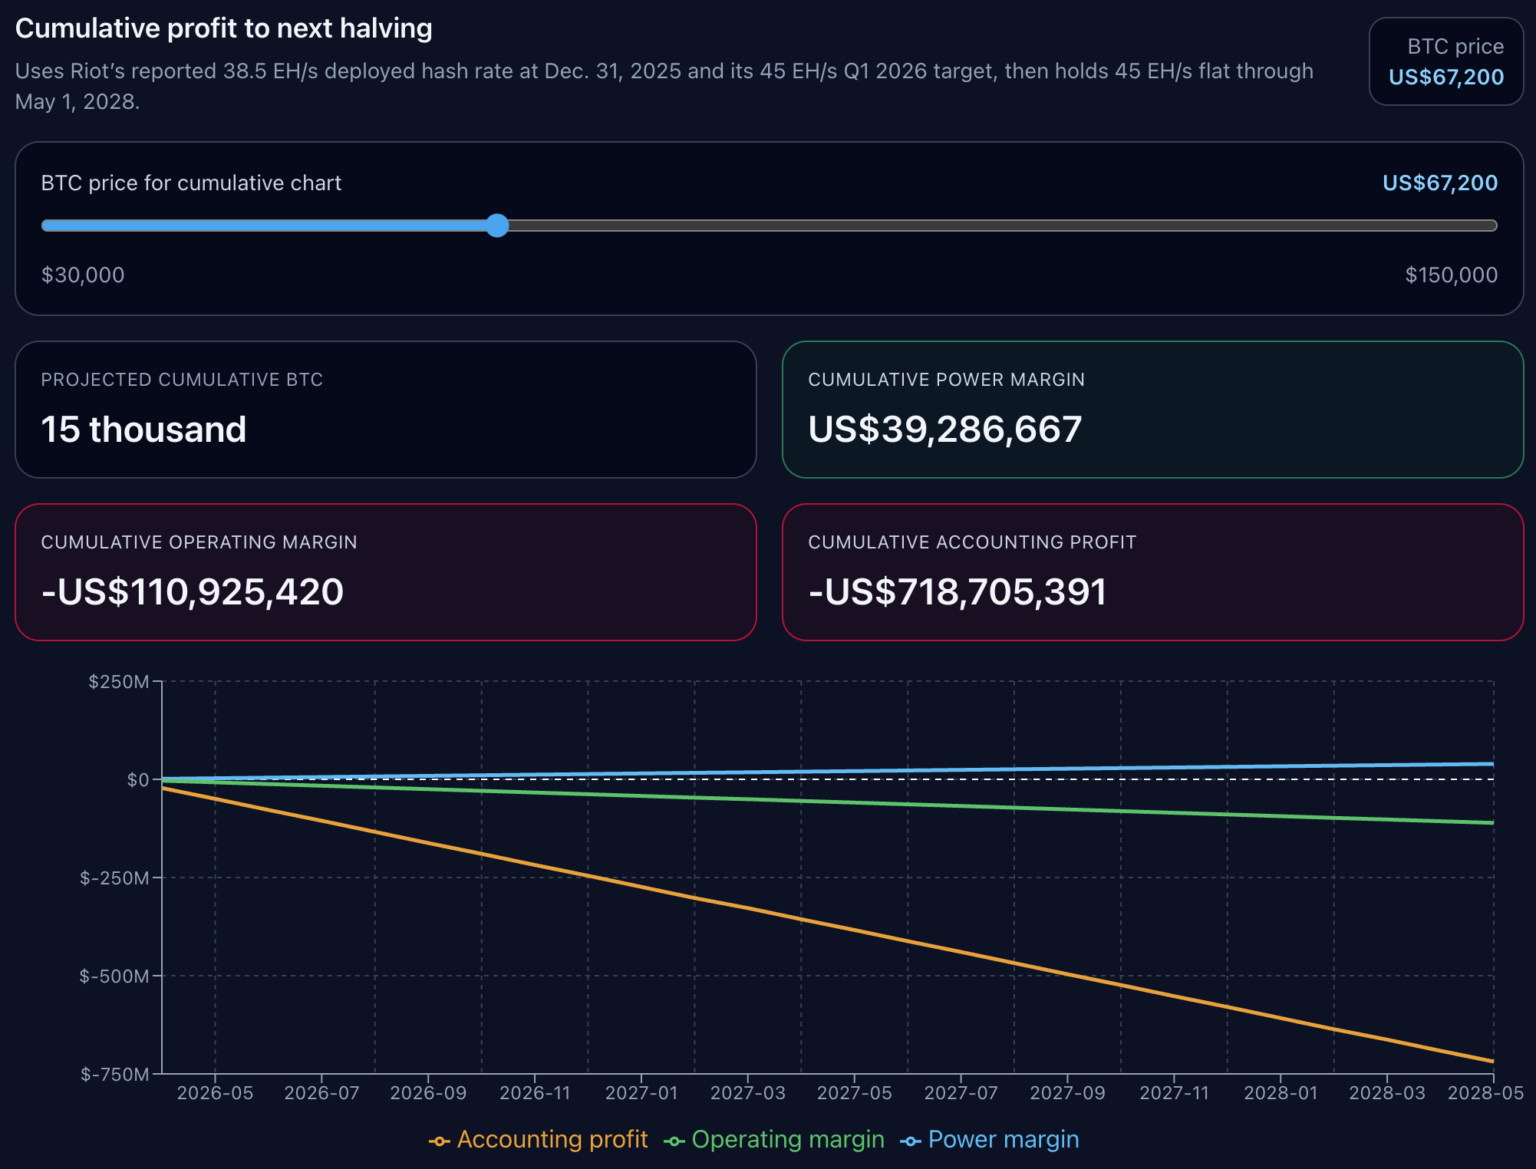
In the $67,200 scenario, cumulative electricity profit turns positive at $39,286,667—but cumulative operational profit remains negative at -$110,925,420, and cumulative accounting profit stands at -$718,705,391.
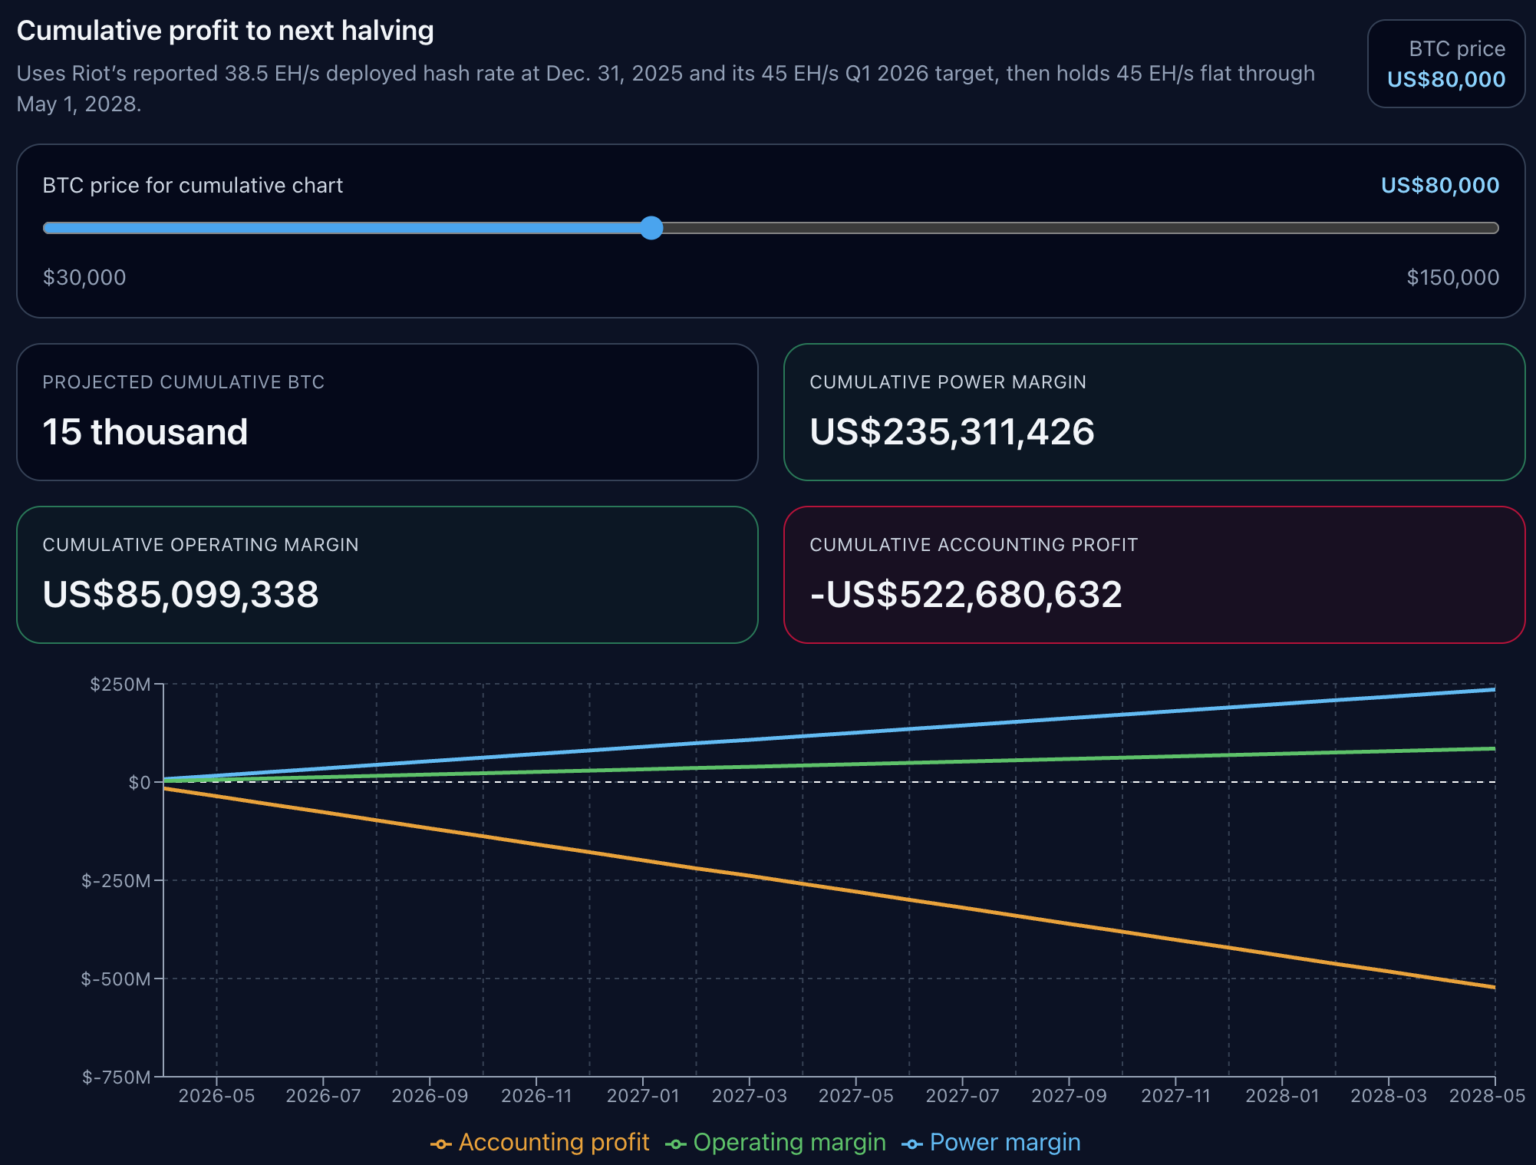
In the $80,000 scenario, cumulative operational profit turns positive at $85,099,338—but cumulative accounting profit remains negative at -$522,680,632.
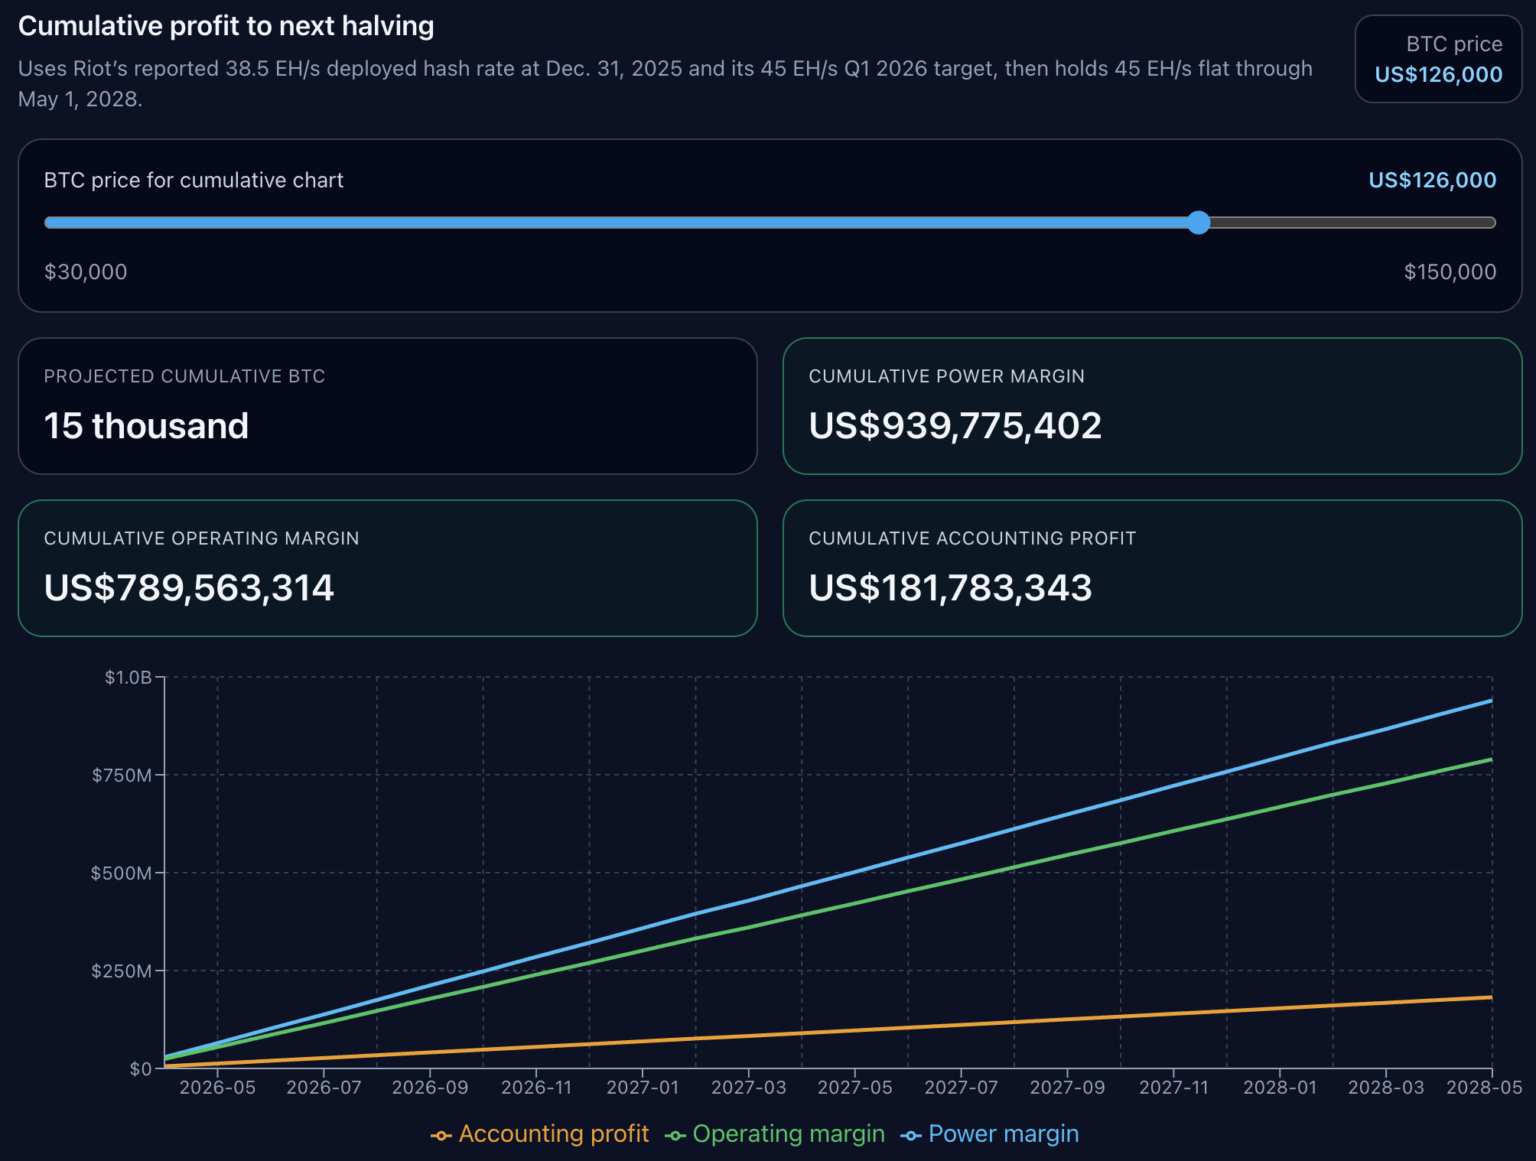
Only in the $126,000 scenario do all three lines turn positive—yielding a cumulative accounting profit of $181,783,343.
Miners can sustain positive electricity-level profits for extended periods yet still fail to cover broader operational costs—or achieve operational profitability while remaining far from accounting profitability. The Riot case illustrates that the gap between these two states is substantial.
In the model, the spread between the electricity breakeven point and the full accounting breakeven point is approximately $49,495 per BTC. This margin helps explain why miners appear healthy at the hash rate allocation level yet struggle to deliver reported profitability.
Our cumulative charts make no assumptions about future difficulty adjustments, transaction fees, downtime, peak-shaving revenue, financing, or new capital expenditures—only that per-BTC economics remain unchanged and that hash rate follows Riot’s stated trajectory.
This limitation does not diminish the model’s core message: holding all other economic variables constant, the discussion leading up to the next halving will remain heavily dependent on Bitcoin’s price.
For Riot, the model achieves cumulative accounting profitability only in the $126,000 scenario—but in absolute terms, the accounting breakeven threshold is $114,200.
What the Riot Case Study Means for the Entire U.S. Mining Sector
The broader implication for U.S. miners is direct: price alone cannot resolve operational challenges—ASIC efficiency and electricity cost remain the first critical hurdles.
On cost sensitivity, we compare three ASIC presets: Bitmain S21 (17.5 J/TH), MicroBT M60S (18.5 J/TH), and Antminer S19 Pro (29.5 J/TH)—all using the Texas industrial reference electricity rate.
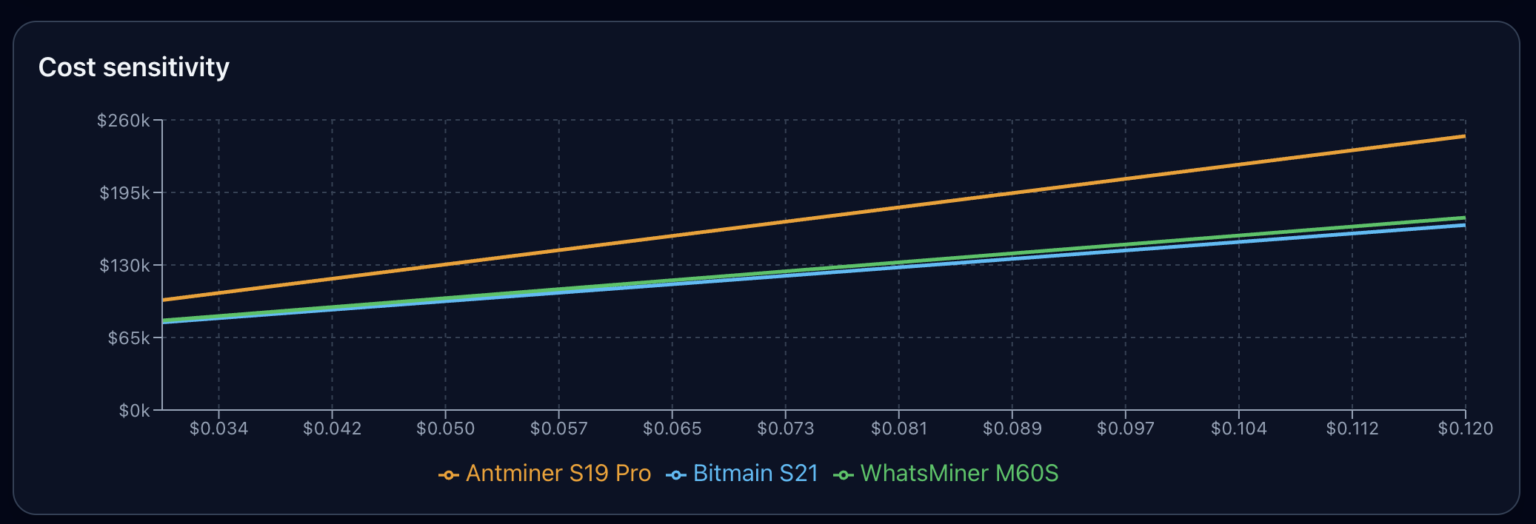
Within this electricity rate range, the S19 Pro consistently incurs higher per-BTC costs than newer models. The two newer models show closely aligned costs, while lower-efficiency miners maintain a clearly higher cost curve across the entire chart.
This conclusion applies beyond Riot. Riot’s non-electricity operational cost layer and depreciation assumptions are company-specific; other miners may have different indirect cost bases, different useful-life assumptions, different peak-shaving revenue structures, or different actual electricity mixes. Yet the applicability of the three-tier analytical framework itself remains unaffected.
Layer One: Electricity cost. Layer Two: Operational cost. Layer Three: Accounting cost.
Companies that survive low-price cycles typically clear the first layer easily. Companies that compound growth through cycles…
Join TechFlow official community to stay tuned
Telegram:https://t.me/TechFlowDaily
X (Twitter):https://x.com/TechFlowPost
X (Twitter) EN:https://x.com/BlockFlow_News