
Hardcore Analysis: What Exactly Influences Bitcoin's Price?
TechFlow Selected TechFlow Selected
Hardcore Analysis: What Exactly Influences Bitcoin's Price?
Insights and analysis from leaders of top-tier institutions are worth a look!
Author: TechFlow
Bitcoin's price movements serve as a barometer for the entire cryptocurrency market.
When its price rises, other crypto assets tend to rise in tandem; the same applies when it falls.
As a result, predicting Bitcoin’s price and analyzing what factors influence it has become a recurring topic in crypto commentary—regardless of whether predictions turn out right or wrong, few seem to take such informal analyses too seriously.
When such analysis becomes merely a source of bullish sentiment, serious and scientific discussion about “what actually drives Bitcoin’s price” becomes both rare and challenging.
But experts eventually step in.
Recently, a comprehensive academic paper titled What Drives Crypto Asset Prices? was published. Using rigorous econometric models, it systematically examines the factors influencing Bitcoin’s price. The authors are highly credible:

Austin Adams: Researcher at Uniswap and Variant Fund;
Markus Ibert: Former Federal Reserve economist and finance professor;
Gordon Liao: Chief Economist at Circle, former Federal Reserve economist.
Insights from such prominent figures are undoubtedly worth attention. However, given the paper’s 39-page length and complex mathematical modeling, TechFlow has distilled and interpreted its core findings, presenting them in a more accessible way to help readers better understand market price trends.
TL;DR — Key Conclusions
-
Traditional factors impact crypto markets: Bitcoin’s price is influenced not only by internal crypto market dynamics but also significantly by traditional financial markets (e.g., monetary policy and risk sentiment).
-
Dual role of monetary policy: In 2020, the Federal Reserve’s loose monetary policy drove Bitcoin’s price up. In contrast, tightening in 2022 caused a sharp decline, accounting for two-thirds of all downward price pressures. Without this policy shift, Bitcoin’s returns could have been significantly higher.
-
Impact of risk premium: Since 2023, crypto asset returns have primarily been driven by compression of the risk premium (investors perceive BTC as less risky, thus accepting lower excess returns), indicating a shift in how the market assesses crypto risk.
-
Complexity of daily volatility: Factors like adoption rates and risk premium dominate explanations of Bitcoin’s daily returns. In contrast, traditional monetary policy has a stronger long-term effect and minimal impact on day-to-day fluctuations.
-
Impact of specific events: Case studies including the COVID-19 market turmoil, FTX collapse, and BlackRock’s spot ETF filing confirm how specific events affect Bitcoin’s short-term price.
Methodology: Understanding Bitcoin Price Drivers
When assessing the volatility of a new asset class, you need to determine how much is due to spillovers from traditional financial markets versus idiosyncratic risks unique to the asset itself.
To explore this, the paper analyzes daily return series of three assets:
Bitcoin: As a representative of cryptocurrencies.
Two-year zero-coupon Treasury bond: A proxy for traditional safe-haven assets.
S&P 500 Index: Representing overall U.S. equity market performance.
Since prices of these three assets fluctuate over time, the research approach is clear: examine their co-movement—how multiple assets’ returns trend similarly (up or down) during the same period.
In reality, we intuitively sense that BTC prices correlate with traditional markets. This paper formalizes that intuition rigorously, abstracting it into three key drivers affecting both Bitcoin and traditional asset prices:
-
Monetary policy shocks: Impacts from central bank (e.g., Fed) policy changes on Bitcoin prices. For example, lower interest rates make borrowing cheaper, encouraging investment and potentially pushing up asset prices like Bitcoin.
-
Traditional risk premium shocks: Changes in investor risk appetite. If investors grow more risk-averse, Bitcoin and other assets may fall together.
-
Crypto-specific demand shocks: Demand-side changes specific to the crypto market. These include factors like technological innovations, regulatory shifts, changes in adoption rates, or shifts in market sentiment.
With this framework, we can quantitatively analyze the magnitude of each factor’s impact and how they manifest in Bitcoin’s price behavior.
Here, we skip the technical details of the paper’s advanced regression models and focus directly on the interpretable insights and results.
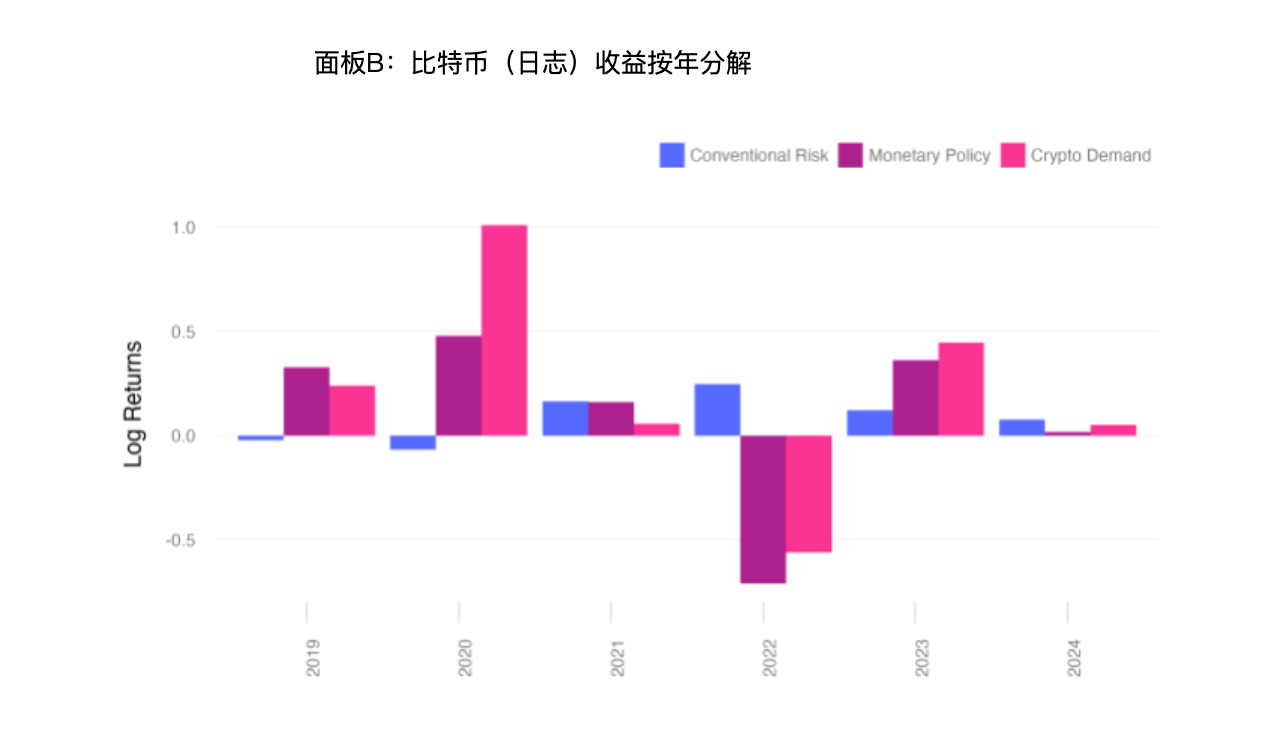
Bitcoin’s 2022 Decline: 50% Attributable to Tightening Monetary Policy (Rate Hikes)
The paper analyzes Bitcoin’s daily price drivers from January 2019 to February 2024.
Bitcoin’s returns are decomposed into three structural shocks: monetary policy shocks, traditional risk premium shocks, and crypto demand shocks. (Note: Think of "shocks" simply as the impact of a given factor on Bitcoin’s price.)
These shocks vary in influence across different periods.
-
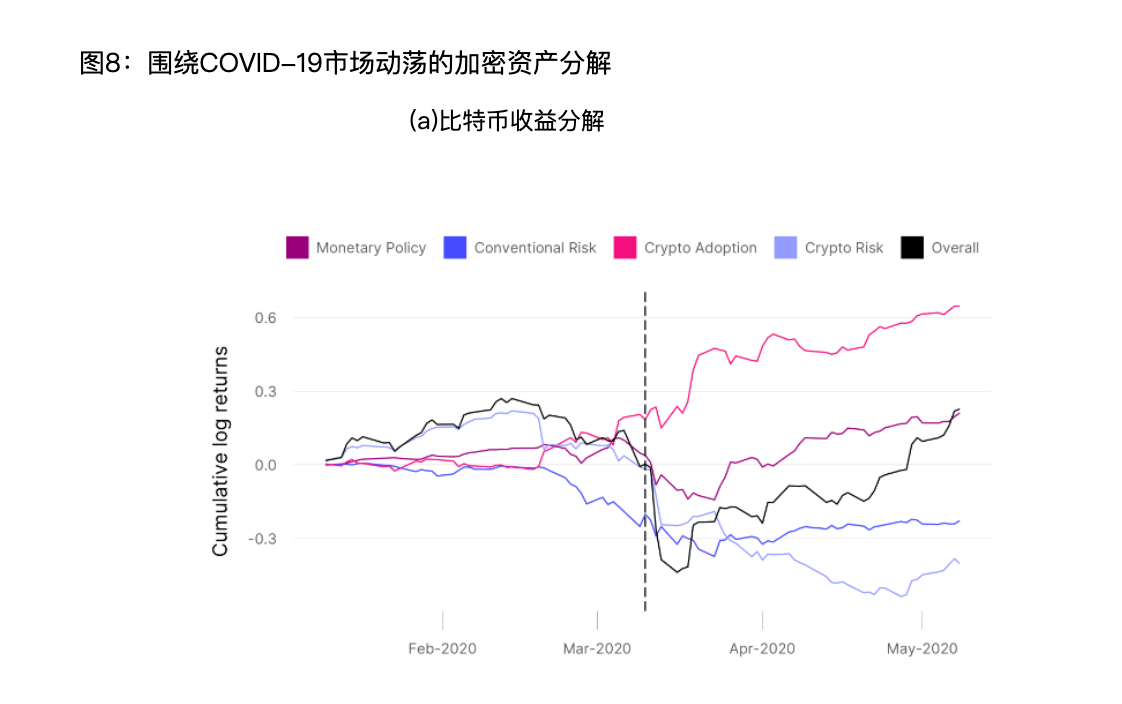
Market Turmoil in March 2020:
-
During the market turmoil triggered by COVID-19, the primary driver of Bitcoin’s price drop was a spike in traditional risk premium.
-
Bitcoin fell from $8,600 to $6,500—a decline of 24.2% (simple return) and 27.7% (log return).
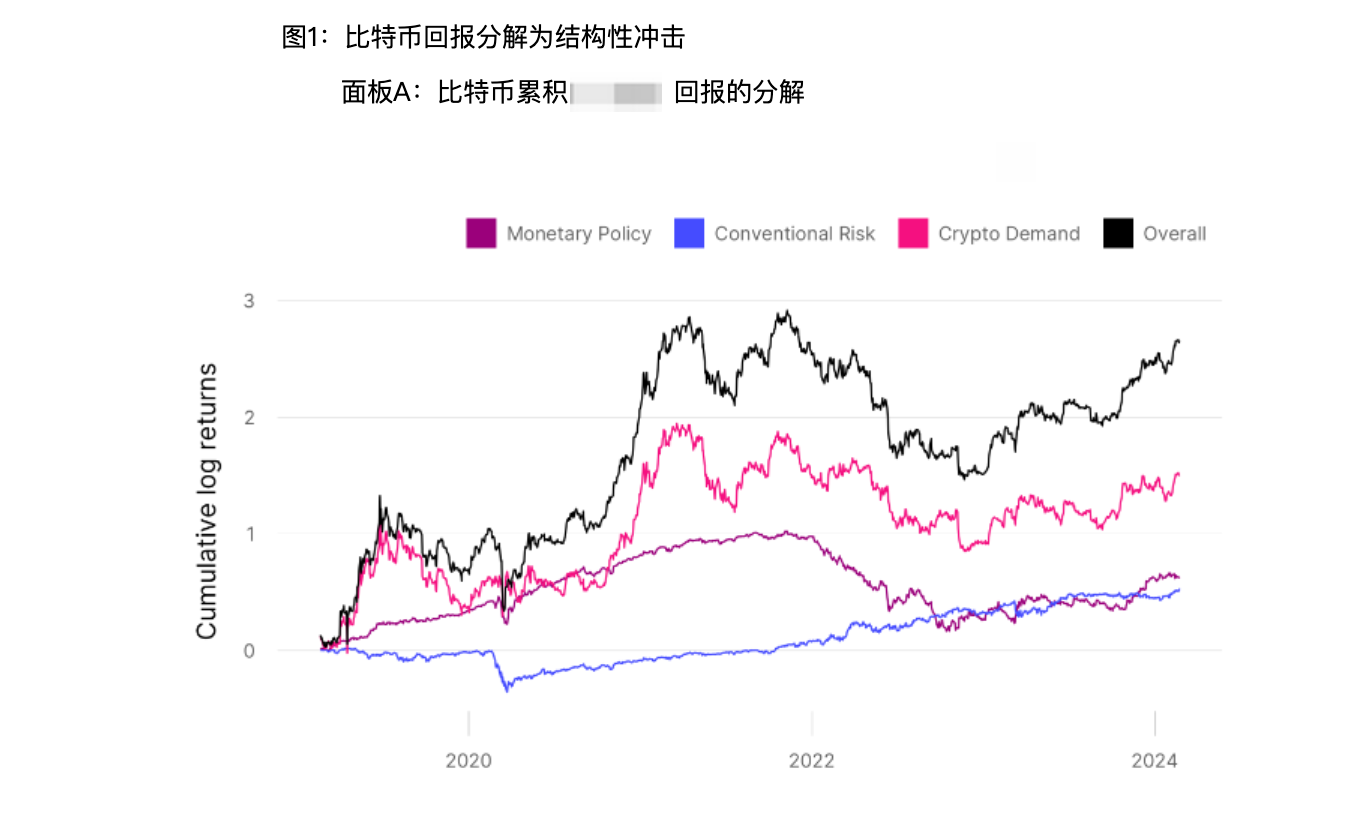
Figure: The black line shows Bitcoin’s daily log returns. Colored lines represent the relative contributions of different factors to those returns.
-
Recovery in 2020:
-
Subsequently, Bitcoin’s price recovery was supported by declining traditional risk premiums and accommodative monetary policy, though part of the rally remained unexplained by traditional factors—indicating strong crypto-specific demand shocks.
-
Price Drop in 2022:
-
In 2022, Bitcoin’s decline was primarily driven by negative monetary policy shocks and negative crypto demand shocks, while falling traditional risk premiums continued to support prices.
-
From January 2022 to January 2023, Bitcoin’s log return declined by approximately 1.02, equivalent to a 64% drop in simple returns.
-
Severe Impact of Monetary Tightening:
-
The model indicates that monetary policy shocks accounted for about 50 percentage points of Bitcoin’s price decline. Absent monetary tightening (e.g., rate hikes), Bitcoin’s price drop would have been only 14%.
-
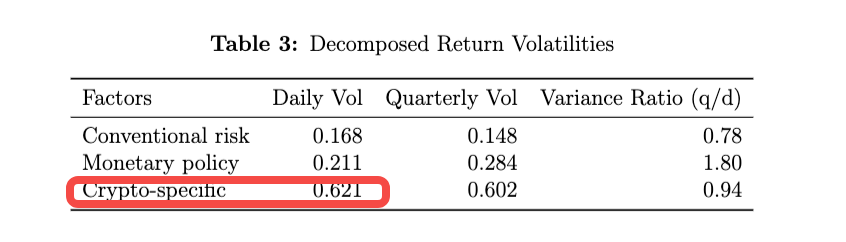
Volatility Analysis:
-
Most daily variations in Bitcoin returns cannot be explained by traditional risk premiums or monetary policy shocks; crypto demand shocks account for over 80% of daily volatility.
-
Monetary policy effects are most visible over longer timeframes, highlighting that Bitcoin is a highly volatile asset whose fluctuations cannot be fully explained by traditional market drivers.
This section underscores the varying impacts of different factors on Bitcoin’s return volatility—especially the long-term significance of monetary policy—while also highlighting the substantial short-term volatility driven by internal crypto market dynamics.
Therefore, the next section dives deeper into the sources of crypto demand and how this variable affects Bitcoin’s price.
2021 Price Surge Driven by Rising Adoption, Followed by Declining Risk Premium Demands
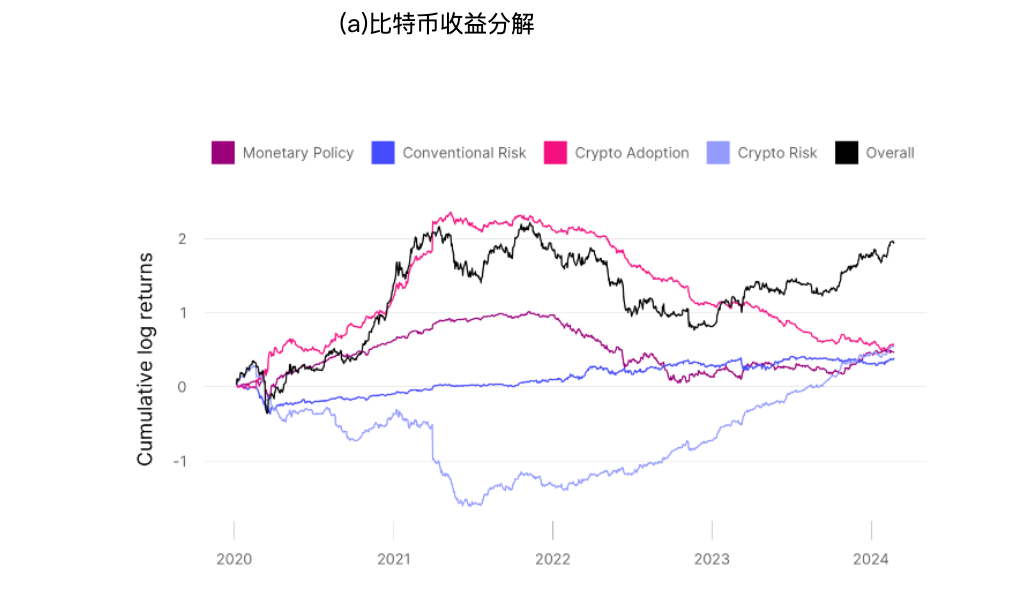
When analyzing crypto demand, the authors break it down into two components:
Crypto market adoption (e.g., new technologies/narratives, market sentiment) and crypto risk premium (the extra return investors demand for bearing additional risk).
Together, these factors influence Bitcoin’s returns and stablecoin market size.
-
Growth from 2020 to 2021:
The model shows that from 2020 to mid-2021, Bitcoin’s price increase was mainly driven by rising crypto adoption. During this period, both Bitcoin and stablecoin prices surged, reflecting growing market acceptance of cryptocurrencies.
-
Shift in 2022:
Since late 2022, stablecoin growth has slowed and even declined at times. This led to a negative crypto adoption shock in Bitcoin’s price decomposition, indicating waning interest and demand for Bitcoin, mirrored by reduced stablecoin demand.
-
Since 2021, ongoing compression of crypto risk premium has been a persistent driver of crypto returns.
-
In Figure a, the light blue line represents “crypto risk”:
-
In mid-2021, the line dropped sharply, indicating a sudden increase in risk premium (investors became more fearful).
-
Starting in late 2021, the line began a slow but steady rise—this upward trend is the “risk premium compression.”
-
An upward trend means perceived risk is decreasing—investors no longer demand high excess returns for holding Bitcoin.
-
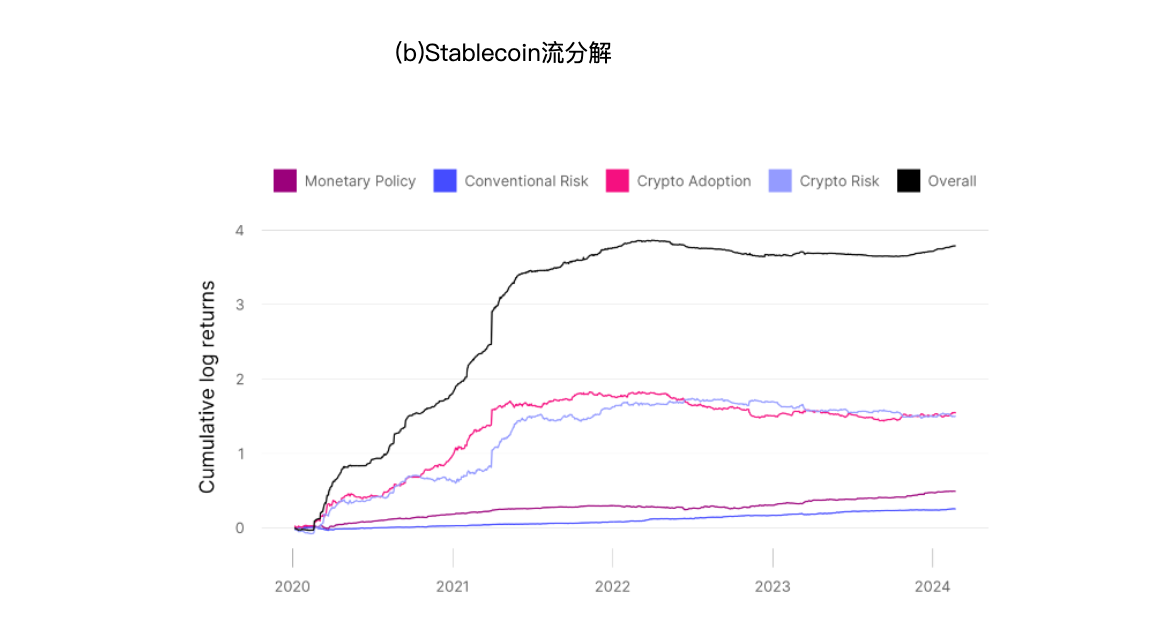
Stablecoin Growth from 2020–2022:
-
During this period, stablecoin growth was primarily driven by developments within the crypto market. In the chart, the pink line (“Crypto Adoption”) remains relatively high before early 2022, indicating adoption was the main driver of stablecoin inflows.
-
Starting in 2022, the blue line (“Conventional Risk”) begins rising and overtakes other factors, suggesting traditional financial market risks increasingly drive stablecoin inflows.
-
Conventional risks may include stock market volatility, economic uncertainty, inflation pressure—when these rise, investors may turn to stablecoins as a safe haven.
Key Events Validate Bitcoin Price Drivers
COVID-19 Pandemic:
-
Market context: From January to May 2020, amid the pandemic, Bitcoin returns dropped sharply in March, while stablecoin market size surged. This period was marked by “risk-off” behavior, with asset declines exceeding what fundamentals alone could explain.
-
Stablecoins as safe havens: Their growth confirms they serve as a refuge in crypto markets, attracting capital during uncertainty—validating the hypothesis that stablecoins offer relatively safe alternatives.
-
Risk premium shock: Investors increased their required risk premium for traditional assets (stocks, bonds), driving prices down. Similarly, risk aversion rose for crypto assets like Bitcoin, leading to price declines.
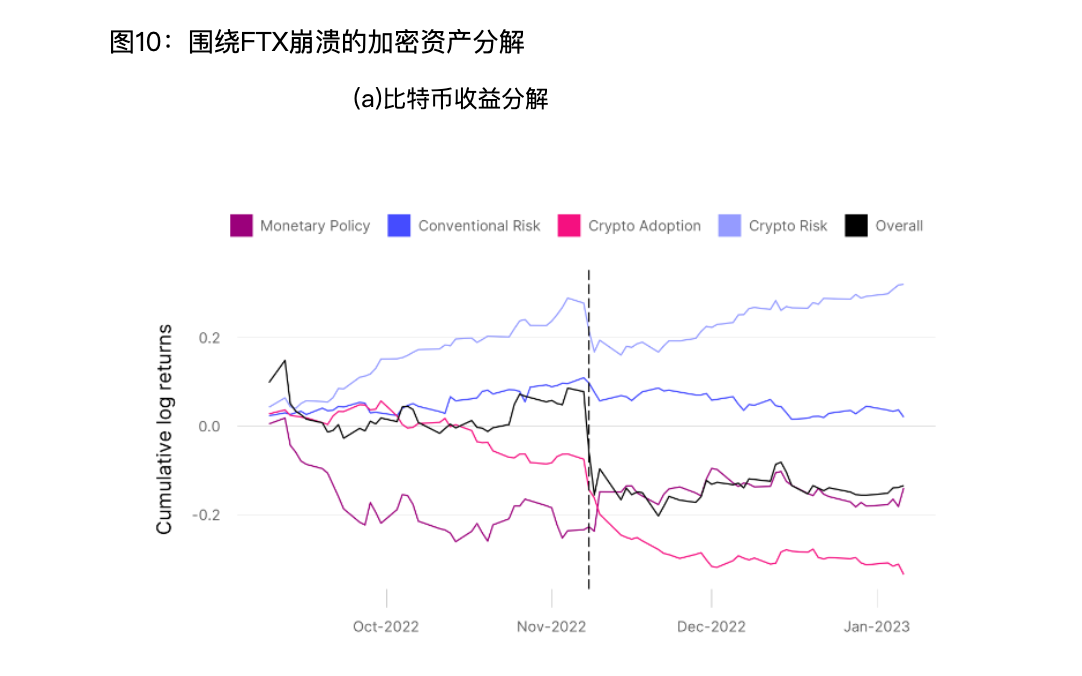
FTX Collapse:
-
Market context: When FTX collapsed in November 2022, Bitcoin prices dropped sharply. Stablecoin market size briefly spiked, reaffirming their role as a safe haven during turmoil.
-
Divergent market reactions: The crypto market experienced extreme volatility due to FTX, while traditional markets saw relatively muted moves—showing crypto’s heightened sensitivity to crypto-native events.
-
During the FTX crash, crypto-specific shocks dominated—particularly positive risk premium shocks (increased risk perception in crypto) and negative adoption shocks (declining confidence). Traditional market shocks played a minor role.
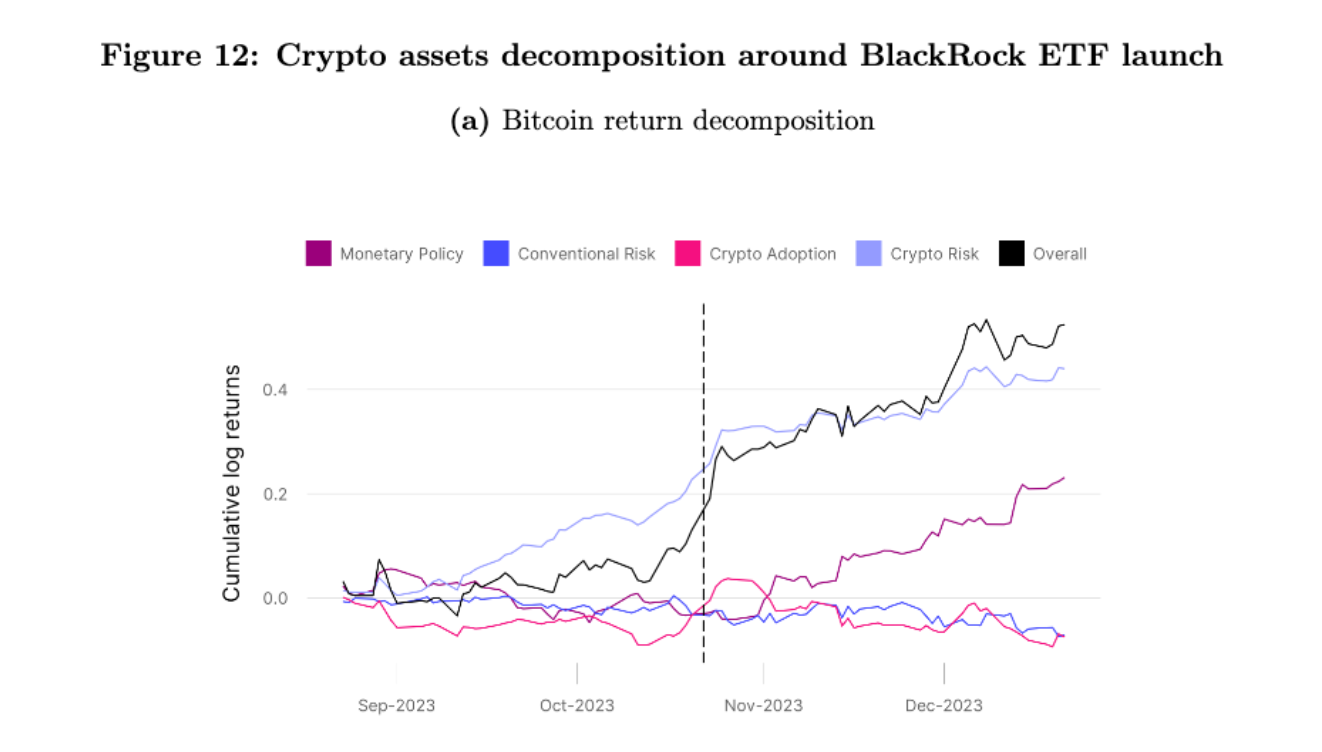
BlackRock ETF Launch:
-
Market回暖 context: After BlackRock announced its application for a Bitcoin spot ETF, Bitcoin returns surged significantly. This marked a major shift in investor sentiment and market dynamics.
-
Factor analysis: The model identifies two key drivers:
-
Positive crypto adoption shock: Reflects increased market acceptance and investor interest, especially due to institutional legitimacy brought by firms like BlackRock.
-
Negative crypto risk premium shock: Indicates reduced perceived risk in Bitcoin, meaning investors require less excess return—signaling diminished risk concerns.
-
Bitcoin’s price rise: From September to December 2023, the rally was primarily driven by this compression in risk premium.
-
These three cases demonstrate how major market events—especially institutional participation—profoundly impact the crypto market, particularly in terms of adoption dynamics and risk assessment.
They show that shifts in market sentiment and participant composition can significantly influence crypto asset valuations and investor behavior.
Join TechFlow official community to stay tuned
Telegram:https://t.me/TechFlowDaily
X (Twitter):https://x.com/TechFlowPost
X (Twitter) EN:https://x.com/BlockFlow_News