Bitcoin Investment Big Picture: Long-Term Correlation with Gold and Nasdaq, Liquidity Remains Key Driver
TechFlow Selected TechFlow Selected
Bitcoin Investment Big Picture: Long-Term Correlation with Gold and Nasdaq, Liquidity Remains Key Driver
Many crypto assets, miners, and related stocks follow Bitcoin's movements, and investing in these assets is effectively a bet on the direction of Bitcoin.
Author: ECOINOMETRICS
Compiled by: TechFlow
If you step back from the volatility of everyday major asset classes, you’ll notice one big trend.
This trend connects Bitcoin, gold, and leading companies dominating the stock market, and it’s influencing everything downstream.
This is the big picture we should be watching.
Key Takeaways
This week, instead of focusing on short-term correlations, we zoom out. When we look at the big picture, here's what we learn:
-
Bitcoin’s price trend is closely linked over the long term to gold and the Nasdaq, primarily driven by global liquidity conditions.
-
Many crypto assets, miners, and related stocks follow Bitcoin’s movement. Investing in these assets is effectively a directional bet on Bitcoin.
-
Financial conditions in the U.S. are easing, creating a favorable environment for Bitcoin and related assets.
-
Current liquidity supports Bitcoin, but a potential U.S. recession remains a key risk to monitor.
-
Understanding these long-term trends and macro correlations is crucial for effectively navigating the crypto market.
Zooming Out on Macro Correlations
Since we started this correlation report, I’ve typically focused on shorter time frames. For us, “short” means monthly scale, so we usually examine changes in correlations within 1-month rolling windows.
This approach helps identify potential turning points but also introduces relatively high noise (requiring some guesswork in analysis).
Sometimes, it’s worth stepping back to better understand long-term trends.
Roughly 15 years ago, when I first entered the quant business, information advantages could still be found in short time frames. But over time, these edges have become harder to capture. I believe true advantage now lies in having a deep understanding of the big picture for longer-term trading.
So today, I decided to adjust some parameters and study how the trend similarity scores between Bitcoin and several “macro” assets have evolved within a 1-year rolling window.
This method helps ensure we don’t miss the forest for the trees and gives us a clearer overall picture.
Here are the results. As a reminder, a trend similarity score close to 1 means both assets move in the same direction, while a score near -1 indicates opposite directions.
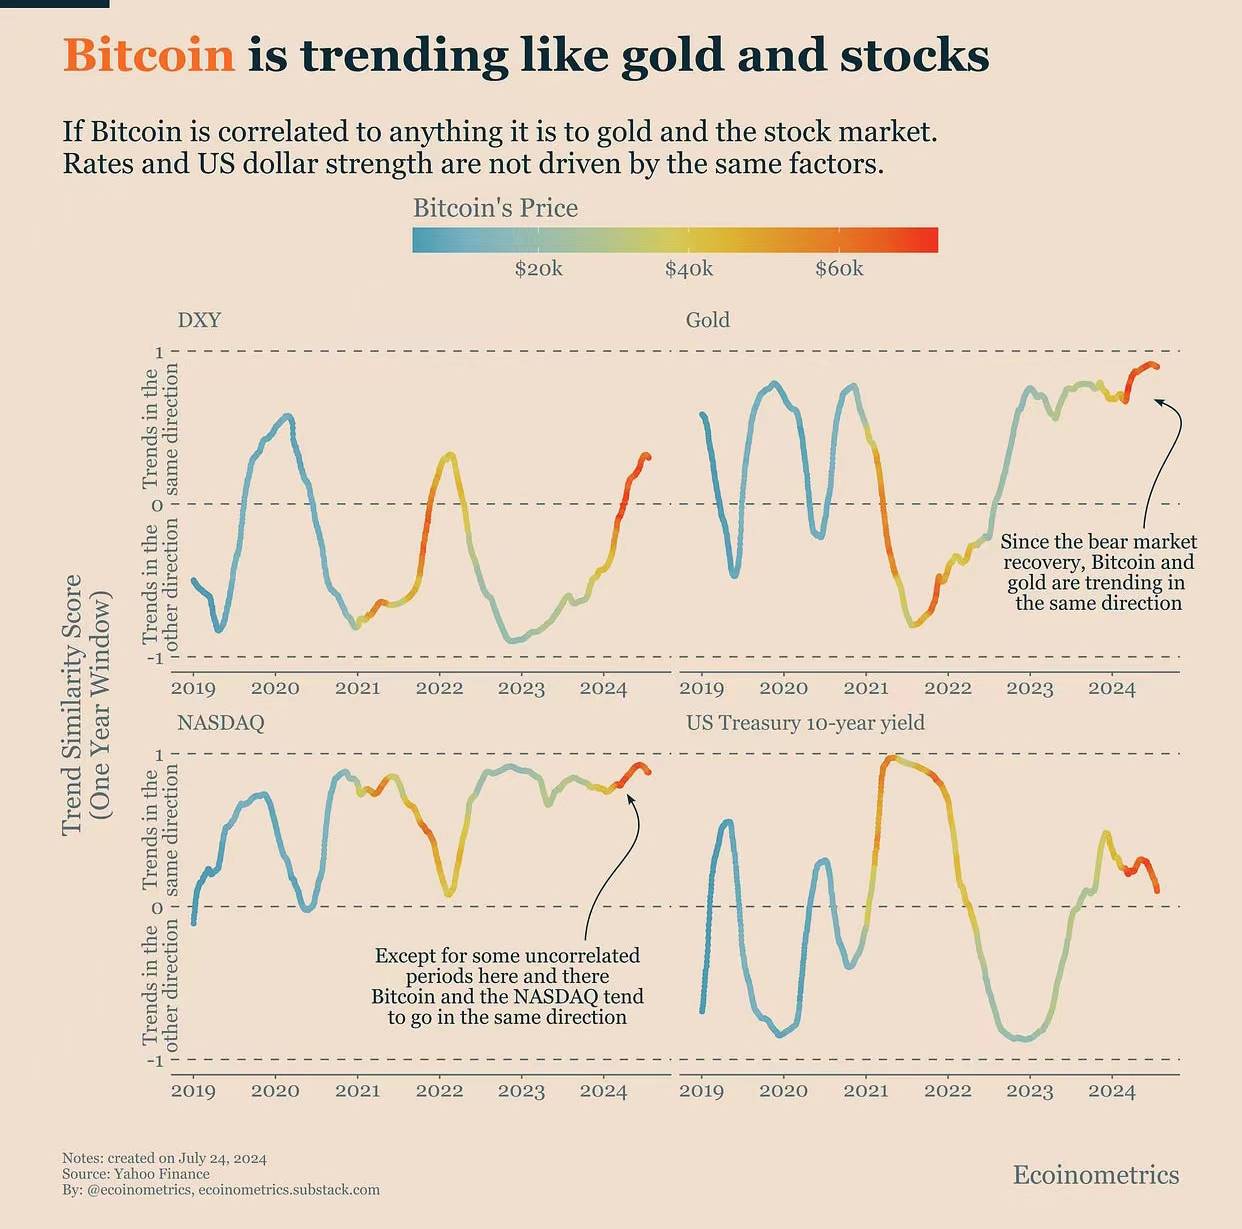
Is Bitcoin heavily influenced by fluctuations in the strength of the U.S. dollar (DXY)? Not really. The trend similarity scores simply oscillate between positive and negative values.
Is Bitcoin tied to interest rate movements? Again, not significantly. We see a correlation pattern similar to that with DXY.
However, when you look at gold and the Nasdaq, a more consistent relationship emerges. Especially since emerging from the recent bear market, the connection among Bitcoin, gold, and the Nasdaq has been very tight.
This is no coincidence. A common factor links all three: global liquidity.
Global liquidity drives these assets by affecting risk appetite and capital flows. Loose monetary policy boosts not only risk assets like Bitcoin and tech-heavy Nasdaq stocks but also gold—as a hedge against potential inflation. As liquidity fluctuates, these assets tend to move in sync, reflecting broader economic conditions and investor sentiment.
And this creates downstream effects.
Bitcoin’s Downstream Effects
Here we’re discussing correlation, not necessarily causation.
Still, it’s fair to say we can divide the world into leaders and followers.
For example, global liquidity is the leader, and Bitcoin is the follower. Or Bitcoin is the leader, and MicroStrategy is the follower.
When it comes to Bitcoin’s followers, we can identify several natural categories:
-
Crypto assets (e.g., Ethereum)
-
Assets deriving value directly from Bitcoin (e.g., miners, MicroStrategy)
-
Assets indirectly benefiting from Bitcoin’s value growth (e.g., Coinbase)
By examining the trend similarity scores of these assets over a one-year period, we observe clear behavioral patterns. Let’s look at a few examples:
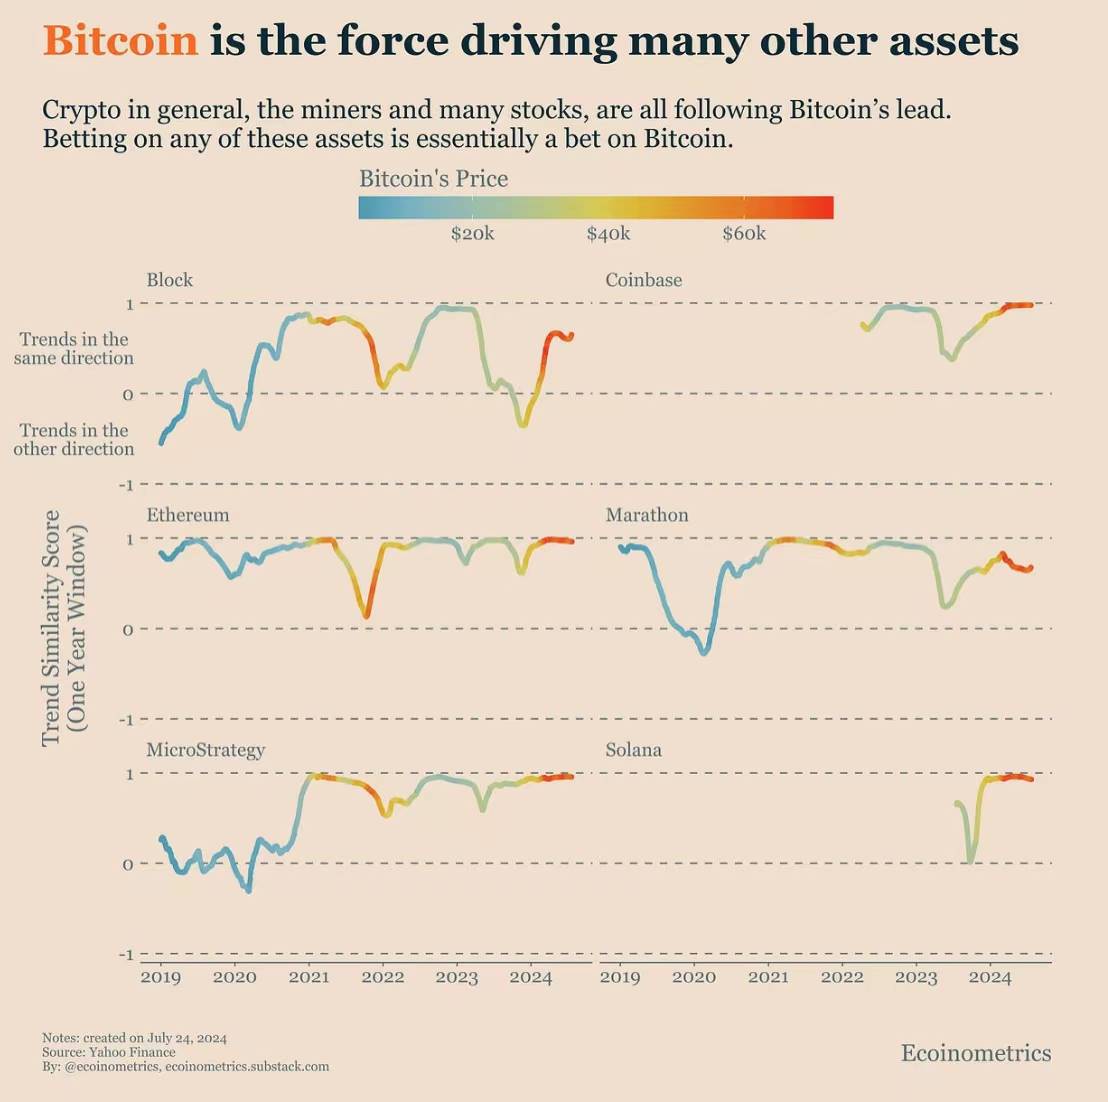
The rule is essentially this: over sufficiently long time horizons (say, one year), the trend correlation between Bitcoin and all directly or indirectly related assets is extremely high.
Actually, “extremely high” doesn’t do it justice. I should say these trend correlations are very strong.
Betting on any of these assets is fundamentally equivalent to taking a directional bet on Bitcoin. Yes, some assets may grow faster than others. But they will all rise and fall together.
The good news is current conditions appear favorable for these assets to thrive.
Liquidity Tailwinds
A few months ago, we discussed how U.S. financial conditions were at a critical juncture.
Two scenarios were possible:
-
If inflation worsened, we faced risks of “higher rates for longer” and additional hikes. Even the mere threat would tighten financial conditions and reduce liquidity for financial assets.
-
If inflation improved, the Fed might begin cutting rates, potentially leading to looser financial conditions than before. Ultimately, the dovish scenario prevailed. This is already evident in the trend of the National Financial Conditions Index.
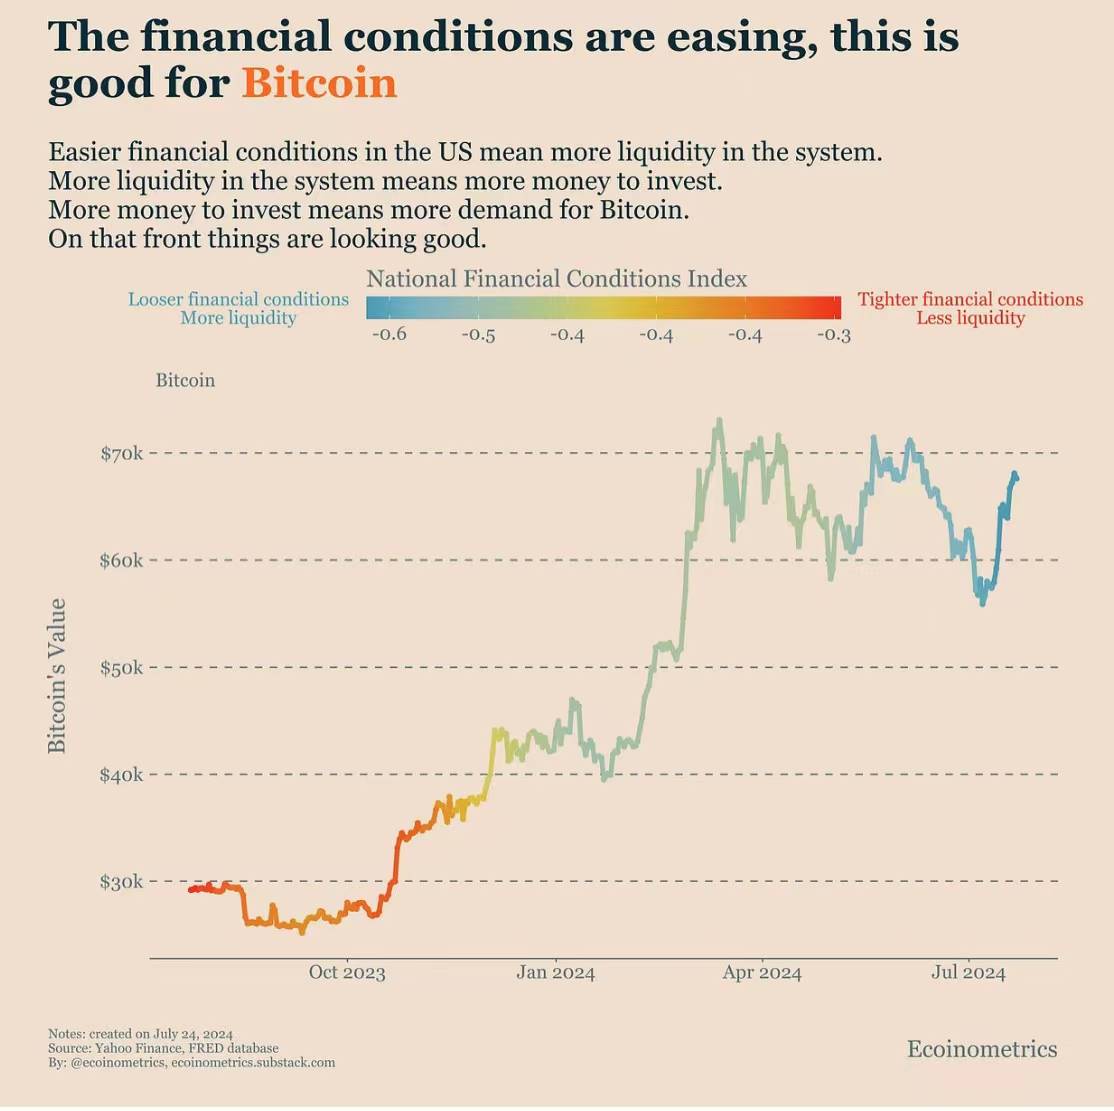
Fighting liquidity is dangerous. Since the 2008 financial crisis, liquidity has become the dominant driver of everything.
As financial conditions ease amid expectations of rate cuts, Bitcoin (and its related assets) gains tailwinds.
The only factor that could disrupt this setup is a U.S. economic recession. Therefore, I’m closely monitoring the pace of changes in the labor market.
Join TechFlow official community to stay tuned
Telegram:https://t.me/TechFlowDaily
X (Twitter):https://x.com/TechFlowPost
X (Twitter) EN:https://x.com/BlockFlow_News