

How to measure a MEME coin using financial and social metrics? (with Dune dashboard)
TechFlow Selected TechFlow Selected
How to measure a MEME coin using financial and social metrics? (with Dune dashboard)
The "foundation" of the financial score is its non-token liquidity and DEX trading volume.
Author: ANDREW HONG
Translation: TechFlow
Every market cycle comes with the emergence of meme coins. A group of people rally around a particular meme, temporarily inflating the price of an asset (ranging from a day to several months). In the cryptocurrency space, this has become a popular market strategy spanning everything from the blockchain layer to the application layer—not only because it drives up prices but also because it draws attention to ecosystems. Some projects, like Avalanche, have even gone further by establishing dedicated meme coin funds.
The line between meme coins and other tokens can sometimes blur, but the general assumption here is that a meme coin has nothing backing it beyond the meme itself. For example, DOGE as a token is essentially supported only by the image/concept of the Shiba Inu doge. This contrasts with ETH, secured by the Ethereum blockchain; UNI, backed by the full Uniswap protocol; or MKR, which supports a complete collateralized stablecoin system.
Meme coins on Farcaster (such as DEGEN) represent the latest trend, whose main advantage lies in fully open social dynamics. Therefore, I wanted to test both social and financial data with some basic analysis.
Measuring Memes
I start with a hypothesis: we can compare the social and financial health of all meme coins using a simple chart:
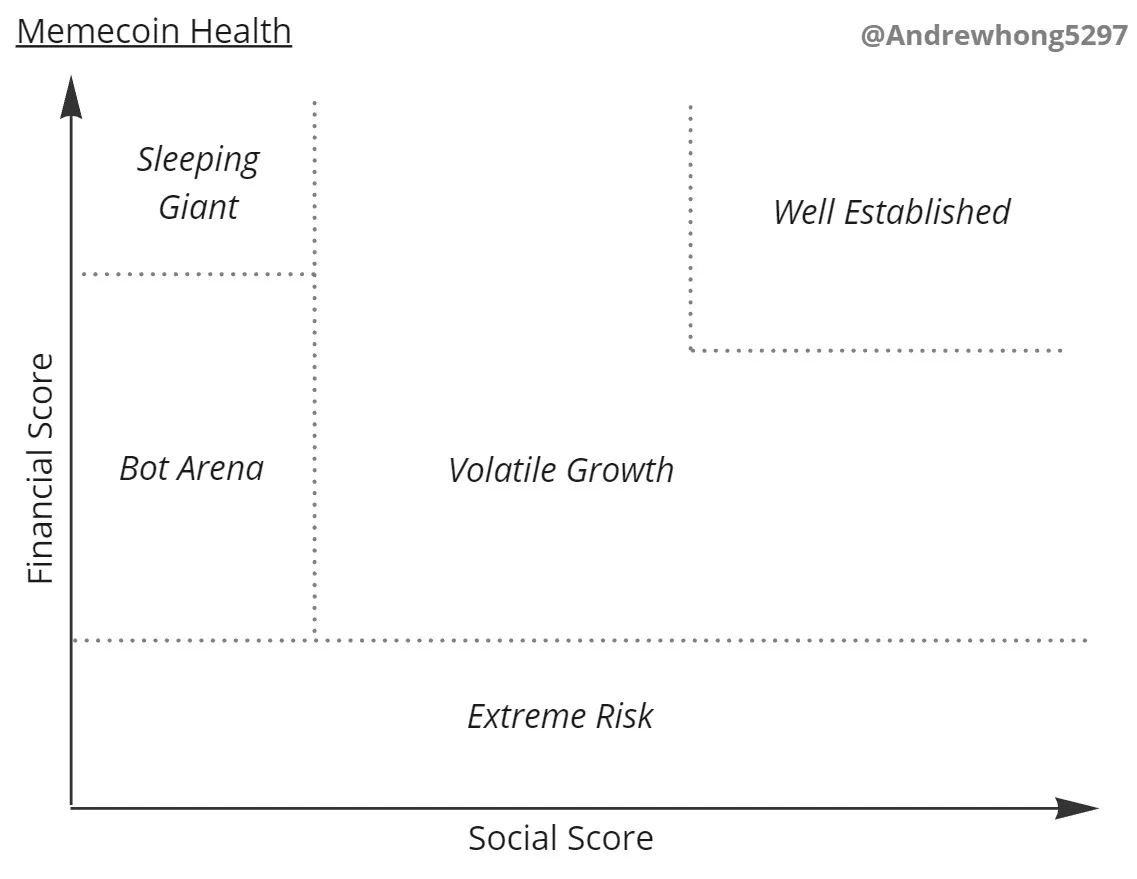
In this chart, I categorize five key zones:
-
Extreme Risk: Meme coins with low liquidity and trading volume are highly dangerous and prone to sell-offs (possibly due to reliance on just a few liquidity providers)
-
Bot Arena: Most meme coins never escape this stage, where thousands of tokens (often sharing names or variations) compete for social and financial attention
-
Volatile Growth: Meme coins that break out from their initial circles must now sustain momentum and growth. You might see prices swing 100–500% in a single day in either direction, while influencers begin piling in
-
Well Established: Leaders remain at the top of both social and financial metrics, clearly differentiated from other meme coins. Weekly numbers may be less volatile, with sustained attention as inflows and outflows reach equilibrium
-
Sleeping Giant: Meme coins that grow rapidly in both social and financial terms without suffering a sell-off may lie dormant in this corner. A DAO might already be formed, managing community chaos. Meanwhile, they hope to regain the spotlight
Most meme coins should be trapped in the “Bot Arena,” with a few appealing ones in the “Volatile Growth” segment, and possibly one or two reaching “Well Established.” Along the way, some may lose social traction and become “Sleeping Giants,” while others may lose financial backing (liquidity) and fall into “Extreme Risk.”
I believe a successful meme coin typically goes through the following stages:
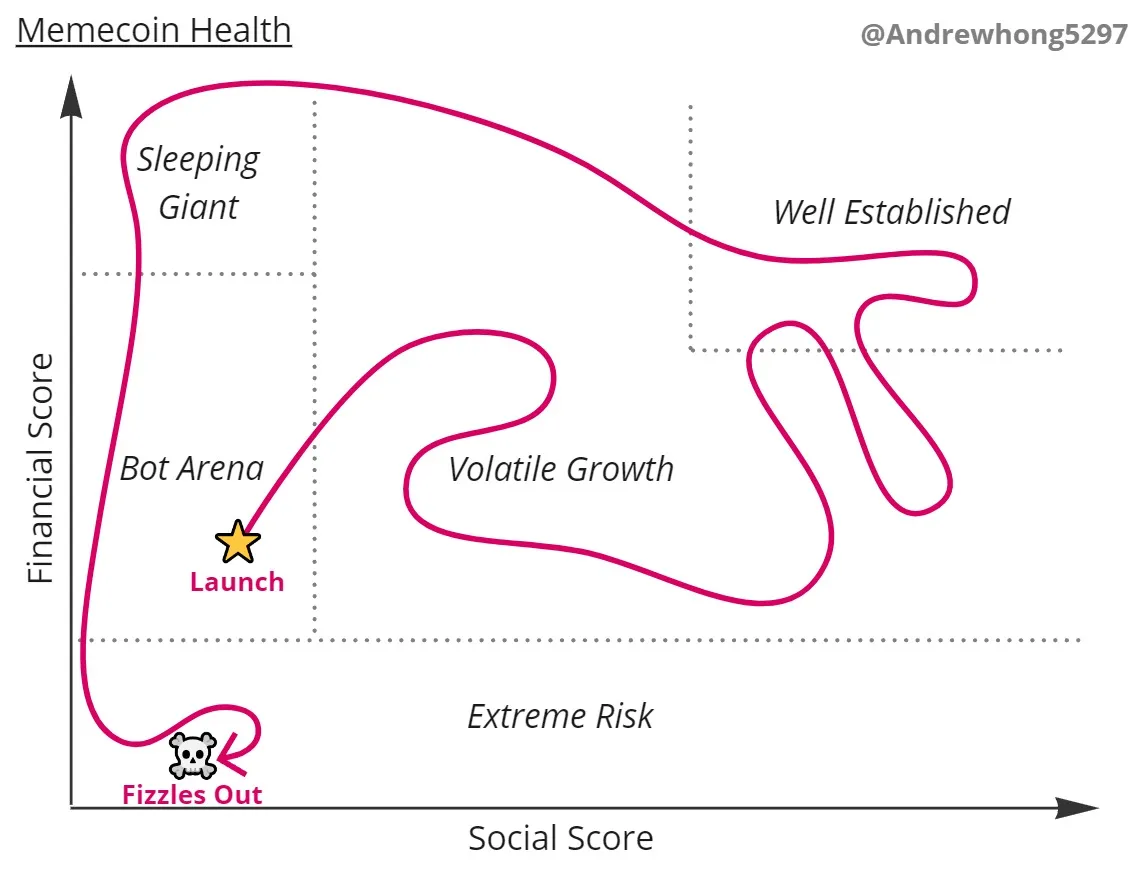
You may observe many meme coins pushed by bots/influencers, achieving high social scores but low financial scores (liquidity), leading to sell-offs.
After extensive data engineering and cleaning, I was able to create this chart on Dune for Farcaster meme coins:
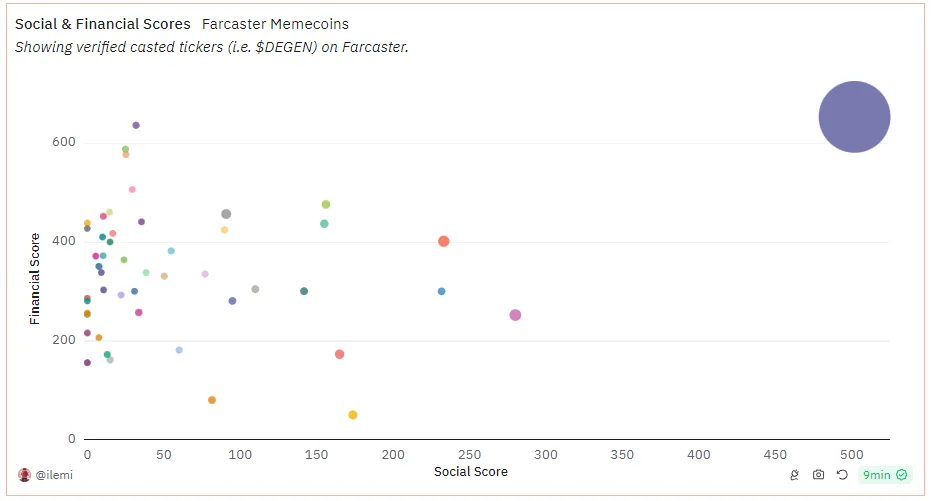
Indeed, this aligns closely with my expectations—you can see DEGEN far in the upper right corner, followed by others like ENJOY, HIGHER, TN100X, and EVERY in the middle. Everyone else is stuck on the left, competing for attention and liquidity.
It’s worth noting that I haven’t filtered out clones/bots here, so social scores for some meme coins may be skewed. That’s a direction for future improvement!
Now, let’s reverse-engineer the final chart to explain how these two scores were created. I’ll also propose further research questions and detail my query sources for those who want to dig deeper.
Dune’s dashboard can be found here, including additional charts not covered in this article.
Social Score
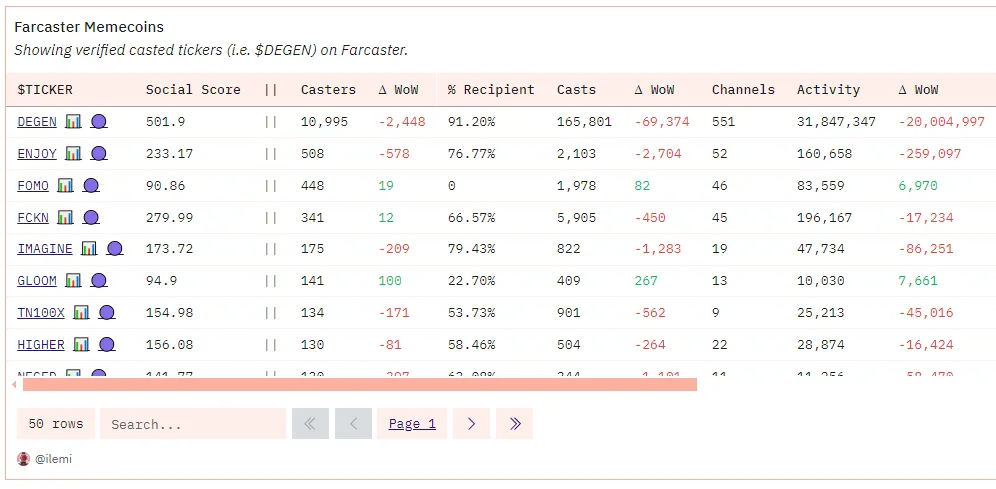
Each score consists of a "base" component and a "growth" component. For the social score, we first measure casts (posts) mentioning a coin and their engagement levels. Under this method, "$DEGEN" counts, but "DEGEN" alone does not.
This gives us our five primary columns:
-
Castors: Number of unique users who casted the given ticker
-
Recipients: Percentage of castors who previously received the token
-
Casts: Total number of times the given ticker was cast
-
Channels: Number of channels where the given ticker was cast
-
Activity Level: Engagement (likes + replies) plus casts multiplied by the cube root of castors and the cube root of channels
The overall social score uses activity level as the "base," with a "growth" multiplier based on week-over-week changes in the number of castors and recipients. The idea is that if you see significant increases in both the number of people casting a ticker and those acquiring the token, it's a strong sign of health.
Overall, it looks like this in tabular form:
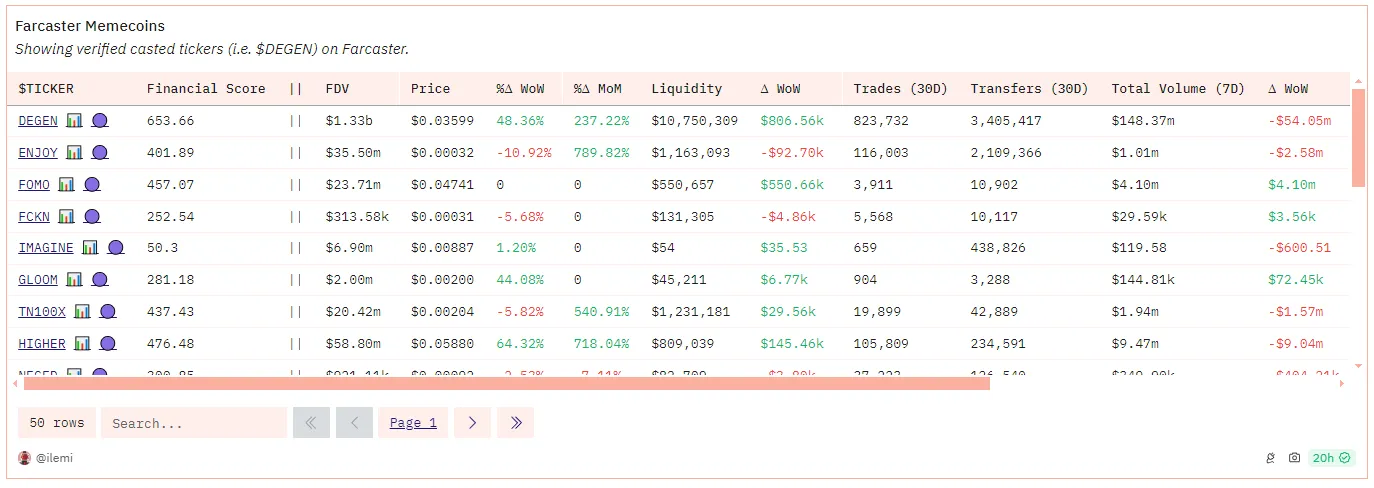
Financial Score
Key financial metrics include:
-
Fully Diluted Valuation (FDV): Total supply multiplied by price
-
Price: Latest price based on DEX trades
-
Daily, weekly, monthly price change: Percentage change in price over daily, weekly, and monthly periods
-
Liquidity: Non-token liquidity—e.g., for the DEGEN-WETH pool, we count only the WETH portion. This provides a more stable indication of how much solid liquidity a given token has
-
Trades: Number of DEX trades over the past 30 days
-
Transfers: Number of ERC-20 transfers over the past 30 days
-
Total Volume: USD trading volume of DEX trades over the past 7 days
The "base" of the financial score is non-token liquidity and DEX trading volume, while the "growth" component is based on week-over-week changes in liquidity.
Overall, it looks like this in tabular form:
Follow-Up Questions
Here are some brainstormed questions I’d love to see explored further:
-
How can we score castors for bots/clones? Weight by token value in wallet? Segment castors by known clusters and/or communities?
-
Classify volatility in social and financial growth—what correlations exist? Are there time lags or unidirectional dependencies?
-
Are the same circles/types of people driving initial growth waves? What about early, timely, and late participants in a meme? Is there any relationship with user tier?
-
What happens when a meme “shifts”? What or who drives such shifts?
-
To what extent do social or financial incentives influence behavior? Do people cast more or less after buying/selling a token?
-
What is the average lifespan of a meme? How long do they last socially versus financially?
Click here to further explore trends among Farcaster users and channels.
Join TechFlow official community to stay tuned
Telegram:https://t.me/TechFlowDaily
X (Twitter):https://x.com/TechFlowPost
X (Twitter) EN:https://x.com/BlockFlow_News


