

Data Interpretation of BTC Trend: We Have Entered a New Bull Market Cycle
TechFlow Selected TechFlow Selected
Data Interpretation of BTC Trend: We Have Entered a New Bull Market Cycle
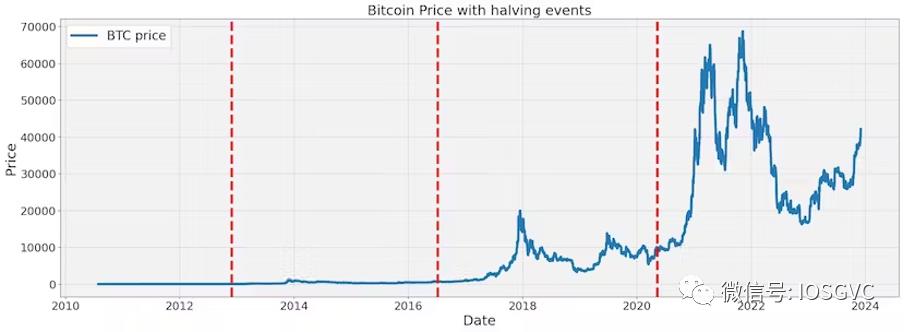
Bitcoin's price tends to experience a significant increase during the period before and after the Bitcoin halving event.
Authors: Darko Bosnjak, Momir Amidzic from IOSG Ventures
—— Understanding the characteristics of past cycles can provide valuable context for assessing current market conditions.
TL;DR
-
IOSG research indicates we are currently in the sixth bull cycle of the cryptocurrency market, which has already lasted over a year.
-
Based on historical market cycle patterns, IOSG believes we are currently in the early-to-mid stage of a medium-length bull cycle (accumulation phase → upward phase → distribution phase → decline phase), transitioning into the upward phase.
-
Recently, the 50-day moving average crossed above the 200-day moving average for the second time in this crypto cycle—an indicator with strong historical backtesting results, showing positive returns in more than 80% of cases over the medium term after such crossovers.
-
Compared to previous cycles, the current Bitcoin bull cycle has been unusually smooth. However, referencing historical patterns, IOSG expects at least ten corrections (drops exceeding -5%) before reaching the peak of this cycle.
-
Bitcoin prices tend to rise significantly both before and after halving events.
-
IOSG: Although Bitcoin halvings coincide with shifts in market cycles, they may not be direct causes of market changes but rather align with broader global economic trends.
Motivation for Research
To better understand and respond to current market conditions, it is essential to study the formation and development of historical market cycles and the various factors influencing them.
By learning from past market cycles, we gain deeper insight into market behavior. Additionally, understanding the duration, magnitude, and features of prior cycles helps assess the current market environment and identify potential turning points.
On Cyclicality
Market cycles are typically defined as the period between two major troughs in broad market indices (e.g., the S&P 500). Global market cycles are influenced by business cycles, economic conditions, and investor sentiment. At a more granular level, individual industries, sectors, and assets reflect these macro cycles but are also shaped by their own unique drivers.
Generally, cycles consist of four distinct phases describing market participant behavior: accumulation (gathering positions), markup (upward movement), distribution (unloading positions), and markdown (downward movement).
The initial accumulation phase marks the end of a downtrend. Sentiment is characterized by distrust and uncertainty, with market participants navigating cautiously in a low-volatility environment.
Transitioning into the markup phase, bullish momentum takes over. Investor sentiment turns optimistic, and price charts show clear upward trends.
During the distribution phase, narratives shift—sentiment becomes dominated by overconfidence and greed.
Finally, the markdown phase signals the arrival of a bear market. Anxiety and panic dominate sentiment, with consistently declining price trends. The shadow of adverse economic conditions further amplifies investor unease during this phase.
This section focuses on analyzing the inherent cyclicality of the cryptocurrency market, particularly Bitcoin. As the most capitalized and heavily traded digital asset, Bitcoin plays a pivotal role in the crypto market. Its price movements strongly influence other cryptocurrencies, which typically follow Bitcoin’s lead.
Since its inception, BTC has averaged annual gains exceeding 2x. Yet, when viewed through a broader lens, clear cyclical patterns emerge.
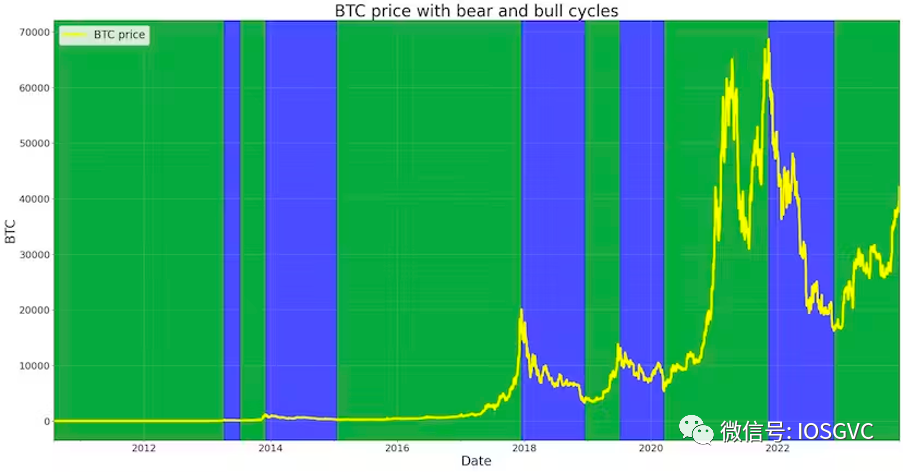
Source: IOSG Ventures
To date, we have experienced five (or six including the current one) bull cycles (green areas) and five bear cycles (blue areas).
Currently, the cryptocurrency market is in the mid-stage of the sixth bull cycle, entering the upward phase. The accumulation phase—the cycle’s initial stage—lasted from late 2022 through summer 2023, when Bitcoin volatility dropped to historic lows.
Exploring Parallels Between History and Present
Some argue against the validity of technical analysis, claiming that historical price and volume data lack consistent predictive power for future prices. This view suggests that relying on past price action offers no intrinsic advantage in forecasting market trends. We largely agree with this perspective, especially when evaluating individual assets in isolation.
Conversely, we believe analyzing historical information remains valuable for understanding market cyclicality. While it cannot precisely predict future price movements, studying historical data cultivates intuition and helps avoid cognitive biases. Careful examination of market cycles can temper excessive bullish enthusiasm—such as “supercycle” narratives during euphoric phases—and counterbalance pessimistic downturn views during periods of fear. This fosters a resilient, insightful mindset capable of navigating market highs and lows rationally, without being swayed by short-term sentiment.
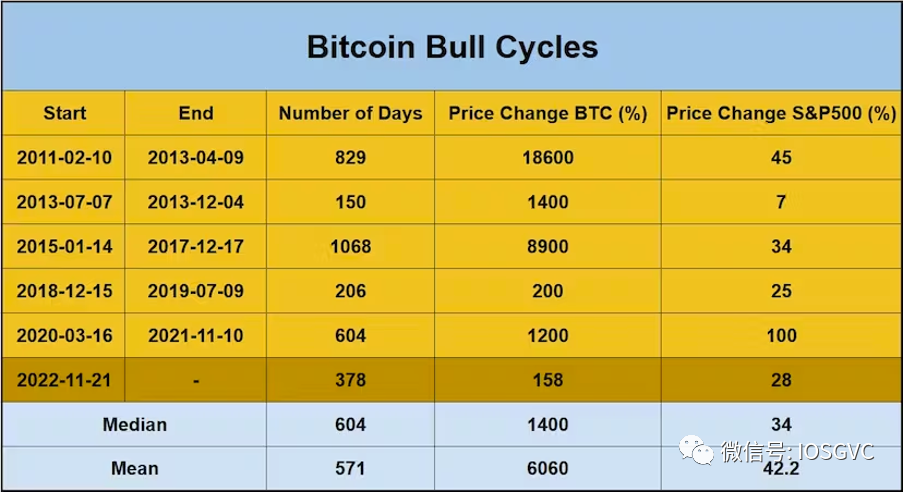
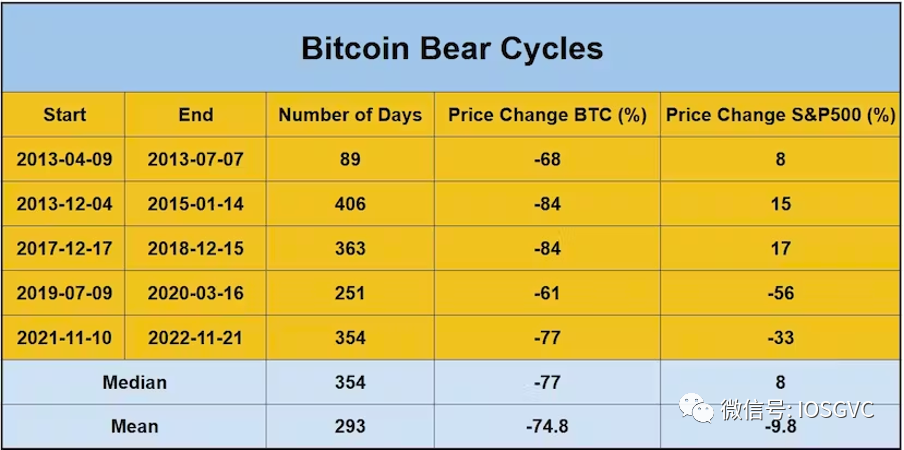
Basic Statistical Data
In the table below, we present statistical data for each historical bull and bear cycle.
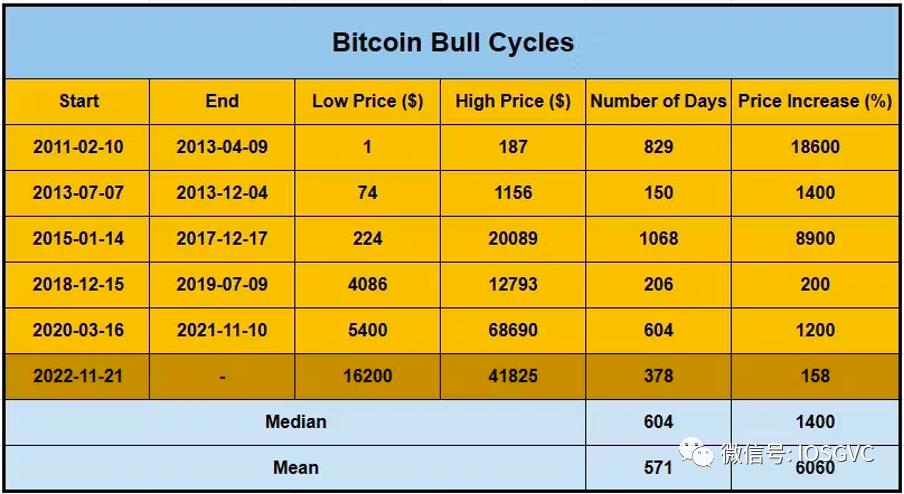
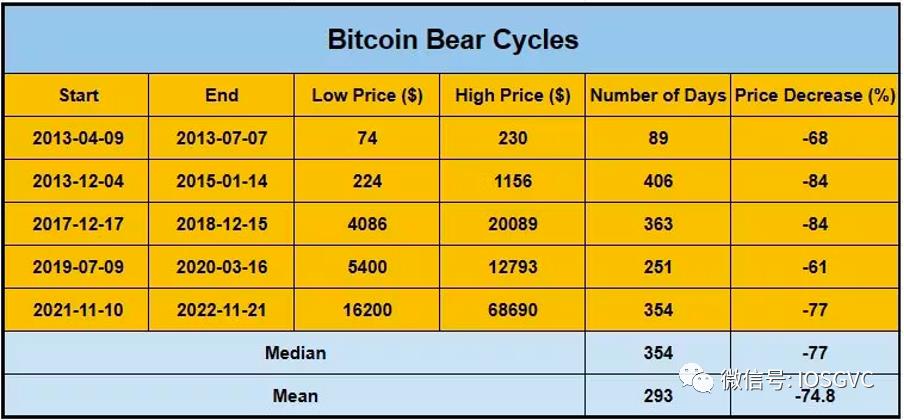
Source: IOSG Ventures
Analyzing past cycles, the median drawdown during bear markets was -77% (average around -75%). The most recent bear market declined exactly 77%. On the other hand, bull cycles showed a median price increase of 15x (average approximately 60x).
Regarding duration, bear cycles had a median length of 354 days (average 293 days). The latest bear market lasted 354 days. For bull cycles, the median duration was 604 days, averaging 571 days.
Bull Market Countdown
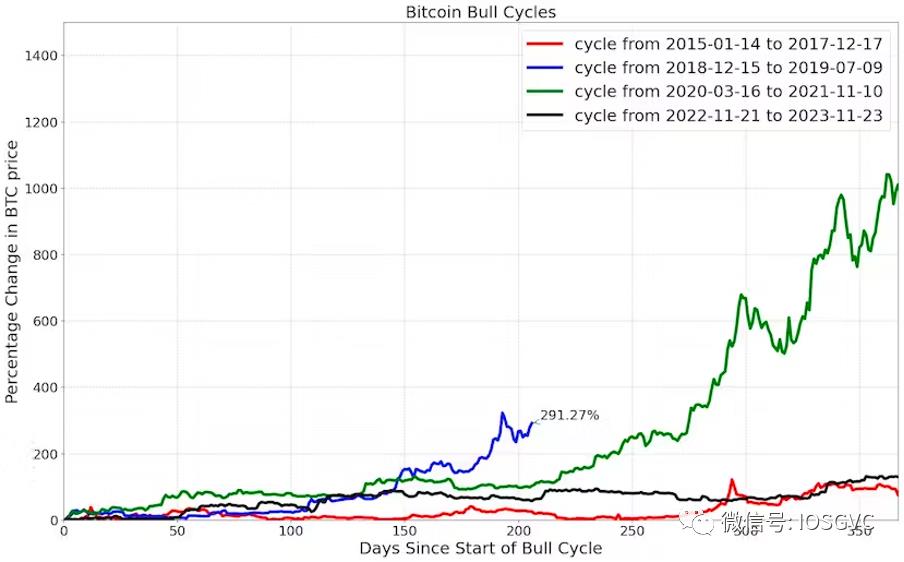
The current bull cycle has lasted about one year. Below, we compare Bitcoin’s return in this cycle to previous cycles within similar time windows.
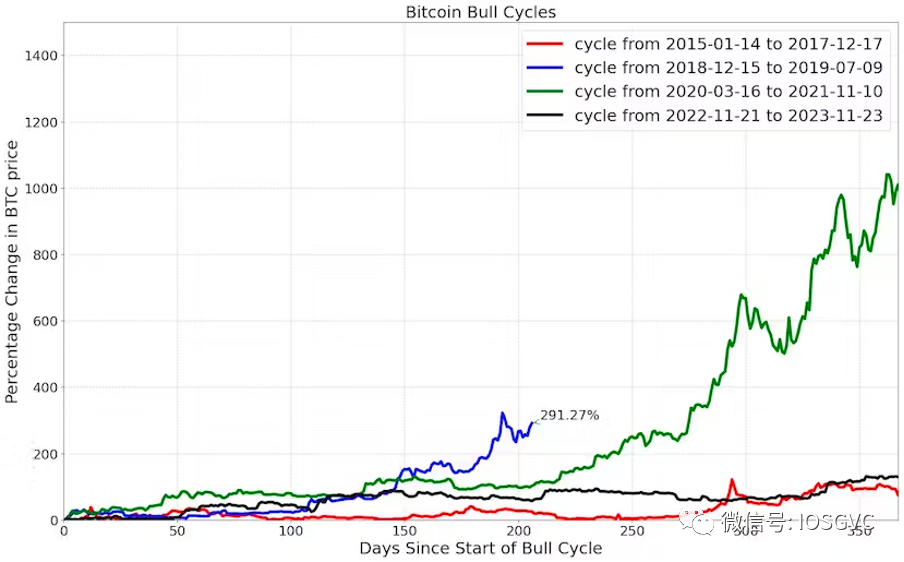
Source: IOSG Ventures
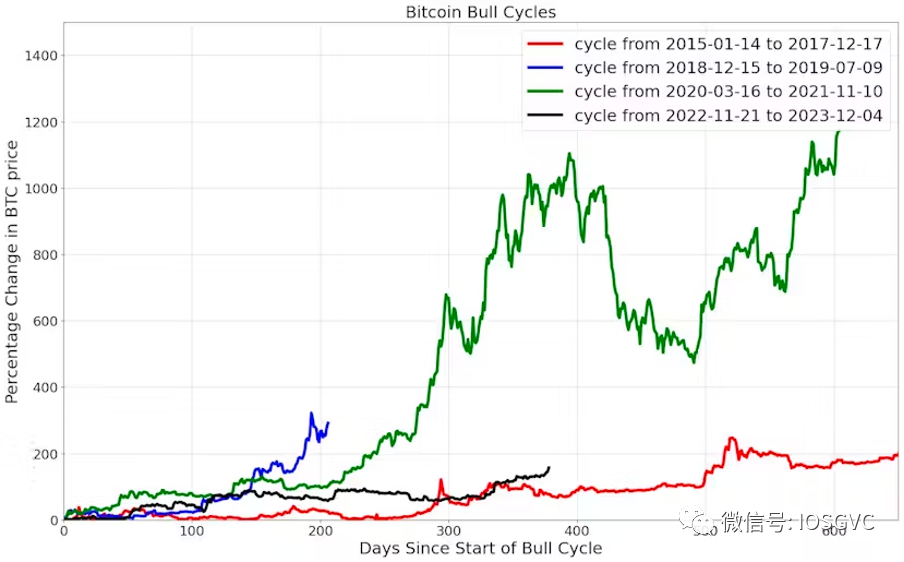
The 2018–2019 bull cycle ended in less than a year with a return of about 3.9x. The 2020–2021 and 2015–2017 cycles lasted over a year, delivering returns of 11x and 1.9x respectively within the first 365 days. Essentially, the 2020–2021 cycle achieved most of its gains within the first year, while the 2015–2017 cycle accelerated afterward.
For the current bull cycle, Bitcoin has risen 2.6x from its bottom, placing it roughly in the middle of a medium-duration bull cycle.
Source: IOSG Ventures
Over the past few weeks, the 50-day moving average (MA) crossed above the 200-day MA for the second time since the start of this cycle. In fact, such double crossovers within a short timeframe are rare. Historically, this occurred only once before—during the 2015–2017 bull run.
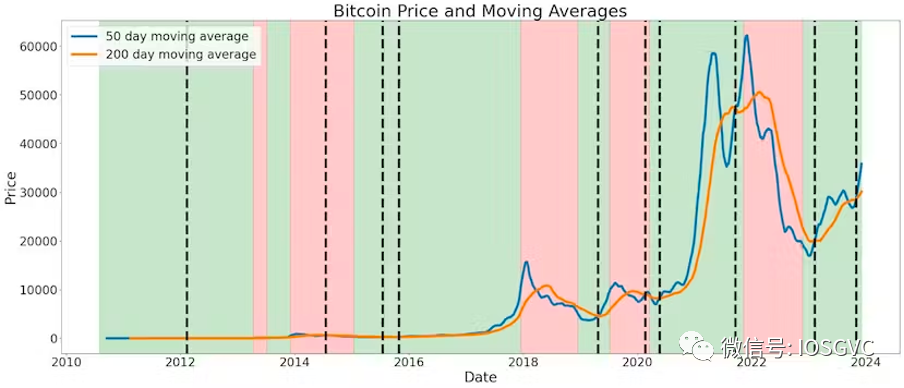
Source: IOSG Ventures
Following the second 50/200-day MA crossover in the 2015–2017 bull cycle, BTC’s performance was as follows:
-
90 days later – 1.27x return
-
180 days later – 1.43x return
-
365 days later – 2.26x return
Throughout Bitcoin’s entire price history, the 50-day MA has crossed above the 200-day MA only six times. Statistically, there is an over 80% probability (5 out of 6 historical instances) of positive returns one year after such a crossover.
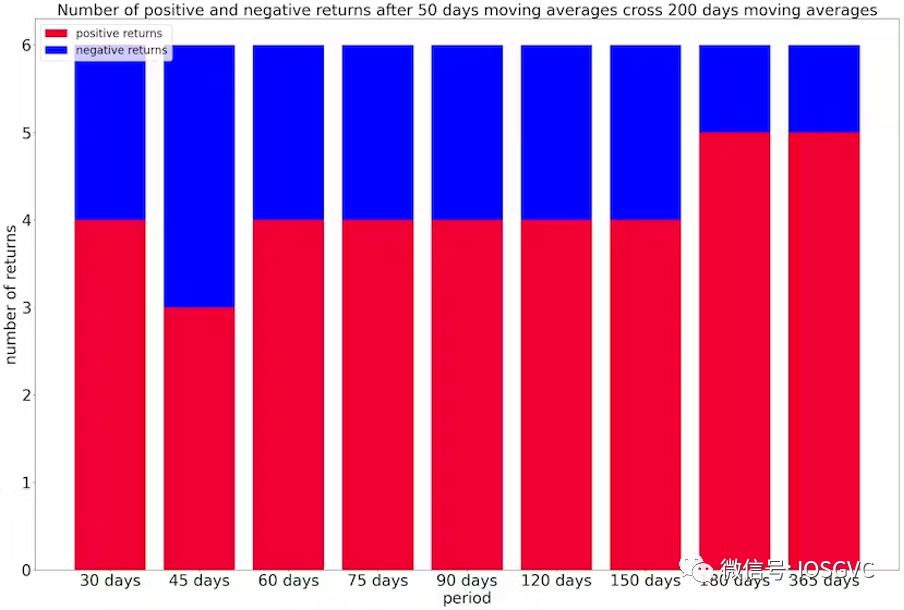
Source: IOSG Ventures
On average, expected Bitcoin (BTC) returns following a bull market crossover are:
-
90 days later: 1.1x
-
180 days later: 1.33x
-
365 days later: 2.5x
Rugged Road Ahead
According to IOSG observations, the current bull cycle has exhibited smoother price action than any previous Bitcoin cycle.
In the previous cycle, there were nearly 115 daily corrections of 5% or more (defined here as negative returns) on the path to the peak. In contrast, the current cycle has seen only 10 such corrections. Even shorter-duration cycles experienced more corrections than the current one.
No prior bull cycle ended with fewer than 20 daily corrections exceeding 5%. Therefore, if the current cycle follows historical patterns, we expect at least ten more corrections as the market continues to rise before transitioning into a bearish sentiment phase.
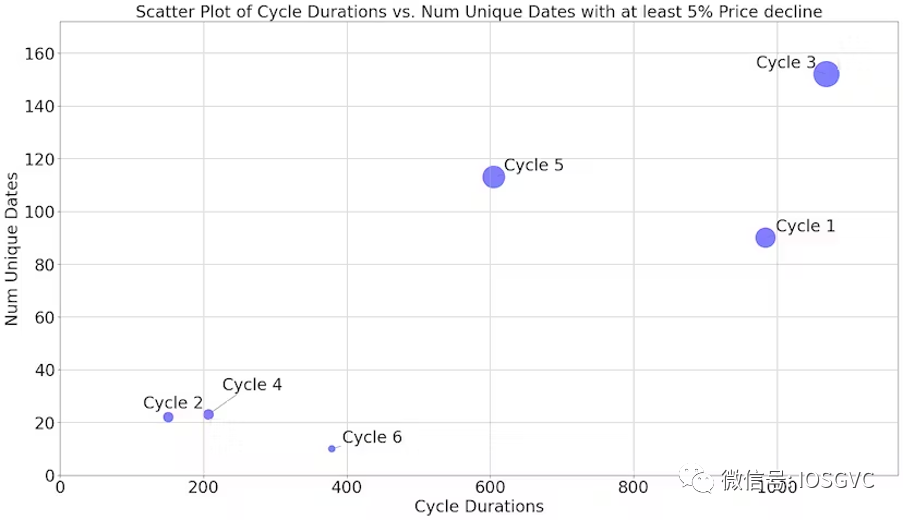
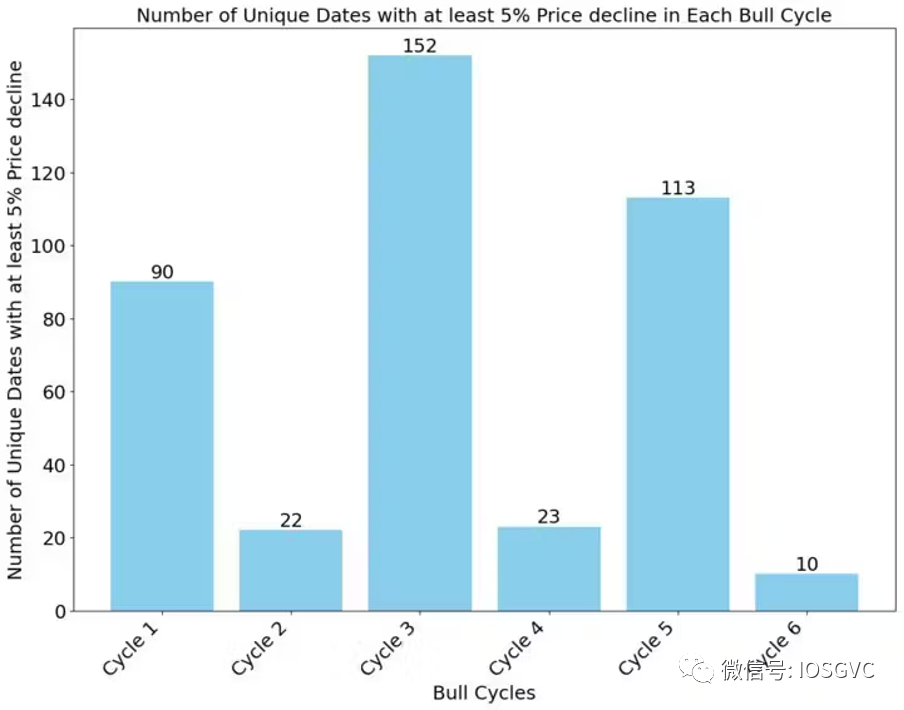
Source: IOSG Ventures
Impact of the BTC Halving
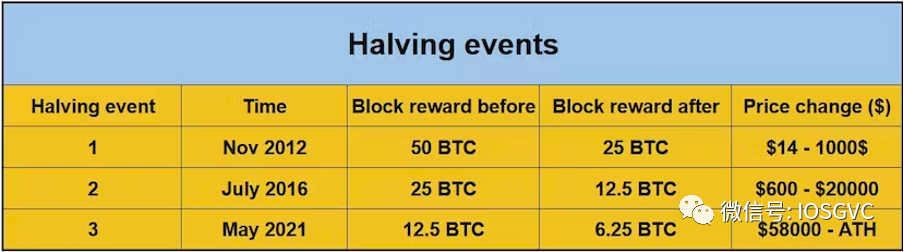
The Bitcoin halving is a pre-programmed network event occurring approximately every four years—specifically when 210,000 blocks are mined. During a halving, the rate of new BTC issuance is cut in half.
This significantly impacts Bitcoin miners, as their block rewards are halved. Consequently, mining competition intensifies, pushing miners to seek more cost-effective energy sources to sustain operations.
Additionally, the halving drastically reduces the flow of new bitcoins into the market, leading many market participants to view it as a bullish catalyst.
To illustrate the halving's impact, consider Bitcoin’s issuance before each event: Over 10 million BTC were issued before the first halving. Slightly over 5 million were issued before the second, and about 2.5 million before the third.
These figures highlight the declining rate of new Bitcoin issuance over time, underscoring the cryptocurrency’s scarcity and long-term appreciation potential.
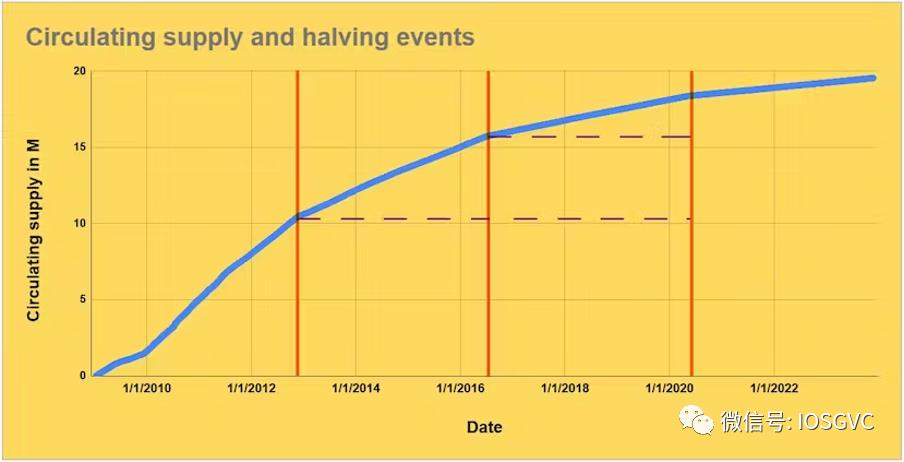
Source: IOSG Ventures
While analyzing only three historical halving events may not yield statistically significant conclusions, the importance of halvings within the Bitcoin community and their widespread discussion as bullish catalysts cannot be overlooked. With that in mind, we delve deeper into relevant historical halving data below.
Source: IOSG Ventures
The next halving is expected around April 2024 at block 840,000. Mining rewards will drop to 3.125 BTC.
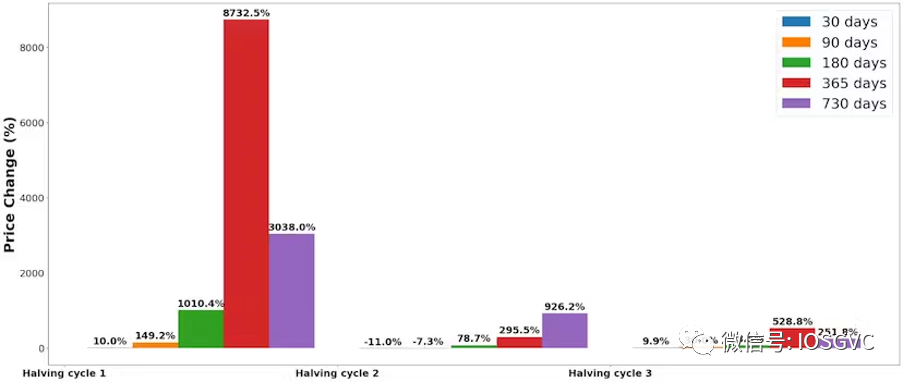
These cycles are clearly visible and appear linked to halving events, as shown in the BTC price changes following each halving:
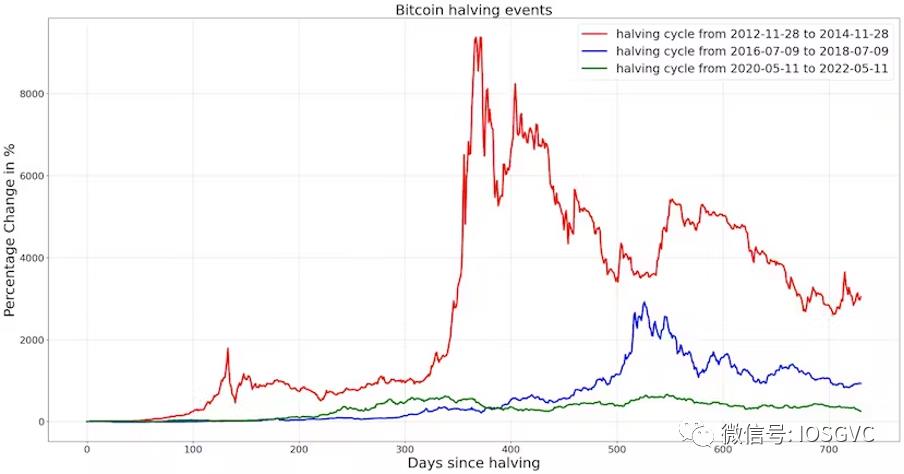
Source: IOSG Ventures
In percentage terms, the halving’s impact has diminished as BTC matures. After the last halving, prices rose over 6x within a year.
Source: IOSG Ventures
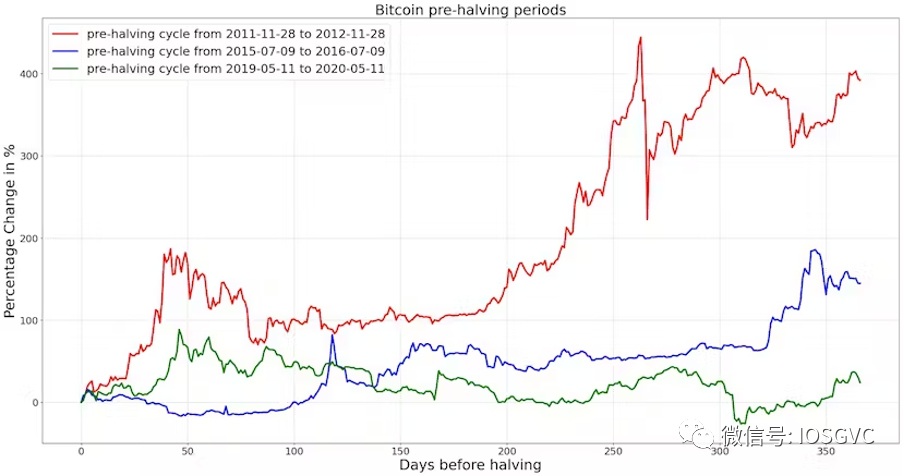
Analysis of Pre-Halving Periods
We also observe strong BTC price momentum during anticipated halving periods, though weaker than post-halving surges. Similarly, in each new cycle, gains have moderated—from 400% to 150%, and recently down to 25% ahead of the peak.
Source: IOSG Ventures
Macro and Crypto Bull Cycle Overlap Analysis
Before attributing crypto market cyclicality solely to halving events, we must account for the influence of global macroeconomic cycles.
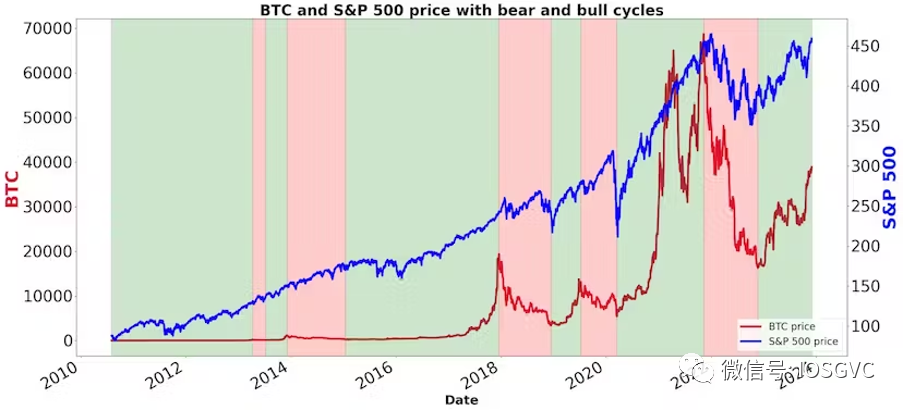
Source: IOSG Ventures
As shown above, there is significant overlap, especially in recent years. Thus, we cannot claim halvings decisively determine the timing of new cycle beginnings. While favorable macro conditions may be the primary driver of crypto cycles, halving events and other crypto-specific developments likely influence the scale of bull markets.
Source: IOSG Ventures
Crypto traders should closely monitor macro conditions—interest rates, oil prices (energy costs), and outcomes of ongoing geopolitical conflicts—as these will significantly affect the broader macro cycle.
On the crypto front, key bullish triggers so far include a series of high-profile bank failures, speculation around crypto ETF approvals, and Binance’s settlement with regulators—eliminating one of the largest potential black swan risks.
Conclusion
Although we remain optimistic about the coming months, historical trends from boom to correction phases remind us that extreme valuations are not uncommon. We are approaching a tipping point of overconfidence and greed—a phase where such sentiments often dominate, potentially creating volatile environments and irrational valuations.
While this analysis suggests continued growth in crypto investment enthusiasm and sustained bullish momentum, caution remains warranted.
After all, compared to earlier cycles, Bitcoin today represents a more mature asset. The increasing institutionalization and maturity of this asset class raise concerns about the applicability of the efficient market hypothesis. We recognize that as assets mature, historical pattern analysis may become less reliable. Given this, maintaining a balanced and realistic perspective when analyzing markets is invaluable.
Join TechFlow official community to stay tuned
Telegram:https://t.me/TechFlowDaily
X (Twitter):https://x.com/TechFlowPost
X (Twitter) EN:https://x.com/BlockFlow_News


