
The Ultimate Guide to Buying the Bottom and Selling the Top: How to Profit from Cycles?
TechFlow Selected TechFlow Selected
The Ultimate Guide to Buying the Bottom and Selling the Top: How to Profit from Cycles?
How to use indicators to identify market tops and bottoms? How to optimize investment strategies?
 Navigating Web3 tides with focused insights
Author: Jian Shu
I. Overview
This is the final article in our cycle series. The previous three articles analyzed cycles from a macro perspective, while this one will focus on how to use indicators to identify market tops and bottoms, and how to optimize investment strategies.
Previous articles:
II. Five Key Indicators for Identifying Market Tops and Bottoms
1. Ahr999 HODL Indicator
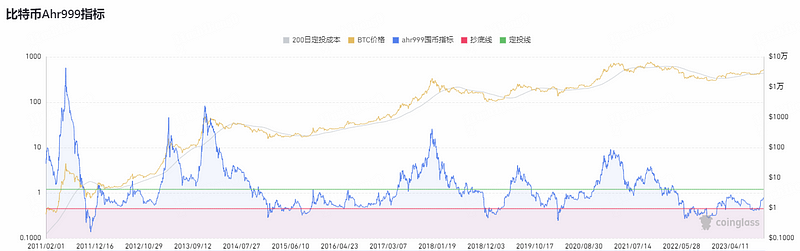
Indicator Introduction: Created by Weibo user Ahr999, this indicator helps Bitcoin dollar-cost averaging (DCA) investors make strategic decisions. It reflects both short-term DCA returns and the deviation of Bitcoin's price from its expected valuation.
How to Use:
-
When the Ahr999 index < 0.45, it’s a good time to buy the dip;
-
When the Ahr999 index is between 0.45 and 1.2, it’s suitable for regular DCA;
-
When the Ahr999 index > 1.2, prices are relatively high, making DCA less favorable.
Live Chart: https://www.coinglass.com/zh/pro/i/ahr999
Recommended Reading: "HODL Bitcoin" by the indicator’s creator
2. Rainbow Chart
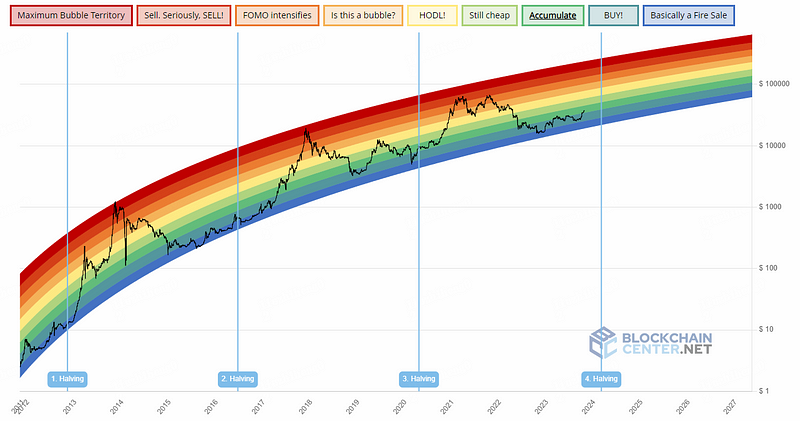
Indicator Introduction: The Rainbow Chart is a long-term valuation tool for Bitcoin. It uses a logarithmic growth curve to project Bitcoin’s potential future price direction.
It overlays rainbow-colored bands on the logarithmic channel to highlight market sentiment at each stage as prices move through them, thus identifying potential buy/sell opportunities.
So far, Bitcoin’s price has consistently remained within the rainbow bands of the logarithmic growth channel.
How to Use:
-
The closer to blue, the closer the price is to a bottom;
-
The closer to red, the closer the price is to a top.
Live Chart: https://www.blockchaincenter.net/en/bitcoin-rainbow-chart/
3. RSI
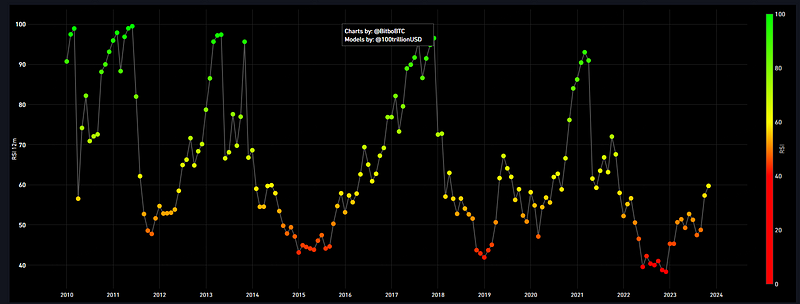
Indicator Introduction: RSI (Relative Strength Index) measures the speed and magnitude of Bitcoin price changes. Calculated based on the past 12 months’ performance, the RSI score indicates whether the market is overbought or oversold. The stronger the upward momentum, the closer RSI approaches 100, indicating positive price movement over the past year. Conversely, strong downward pressure drives RSI toward 0, signaling negative price trends.
How to Use:
-
An RSI value of 30 or below (closer to red) suggests Bitcoin is oversold, or nearing oversold conditions—ideal for buying the dip.
-
An RSI value of 70 or above (closer to green) indicates Bitcoin is overbought and may soon decline—ideal for selling.
Live Chart: https://charts.bitbo.io/monthly-rsi/
4. 200-Week Moving Average Heatmap
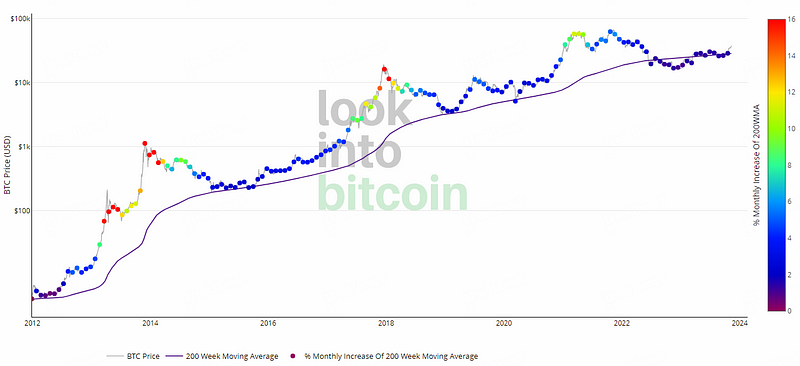
Indicator Introduction: This indicator uses a color-coded heatmap based on the percentage growth relative to the 200-week moving average.
Each month’s percentage increase from the 200-week moving average is assigned a color on the price chart.
Historically, Bitcoin has bottomed near the 200-week moving average in every major market cycle.
How to Use:
-
The closer the dot color is to red, the hotter the market—ideal for selling;
-
The closer to purple, the colder the market—ideal for buying.
Note: This indicator failed during the last bull market peak, showing that no single indicator should be relied upon entirely. They are tools to assist judgment, and other factors must also be considered.
Live Chart: https://www.lookintobitcoin.com/charts/200-week-moving-average-heatmap/
5. CVDD
Indicator Introduction: CVDD stands for Cumulative Value-days Destroyed, which measures the accumulated value of coin days destroyed.
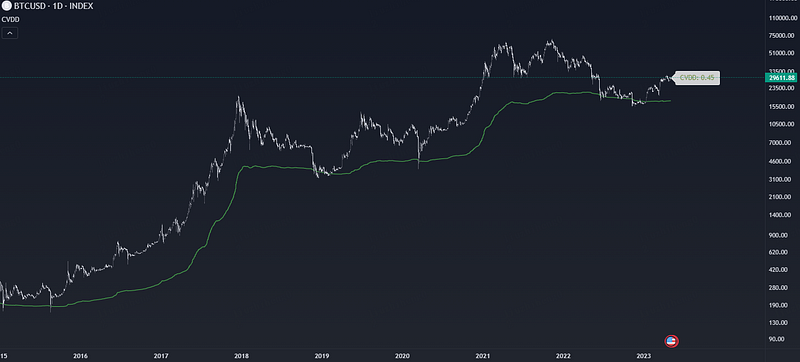
How to Use: When Bitcoin’s price touches the green line, it indicates severe undervaluation—a strong buying opportunity.
Live Chart: https://www.tradingview.com/script/3CEPlBsb-Cumulative-Value-Coin-Days-Destroyed/
Summary
To help readers use these indicators, we’ve compiled them into a single chart.
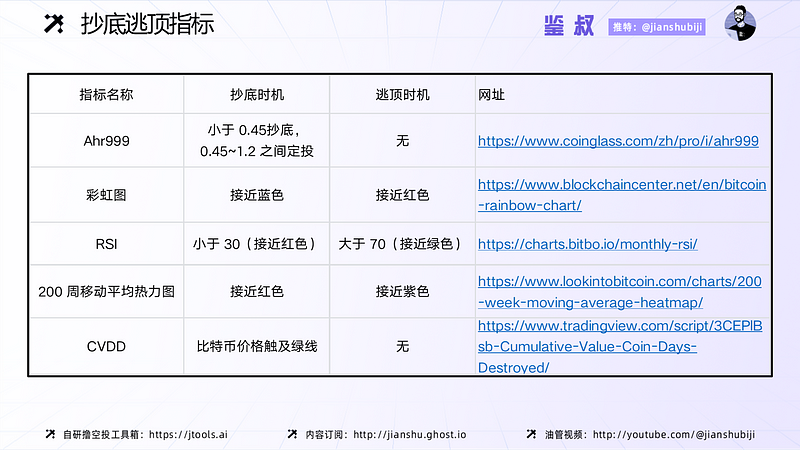
Note: These indicators are meant to guide Bitcoin entry and exit timing and do not imply similar signals apply to other tokens.
III. Strategies Suitable for Cyclical Trading
Long-cycle trading often leads to the situation shown below, mostly due to subjective misjudgment. Having a predefined strategy can help avoid such mistakes.

1. Combining Martingale Theory with Dollar-Cost Averaging
First, let’s understand the concepts of the "Martingale Strategy" and "Dollar-Cost Averaging (DCA)."
Martingale Strategy: Originally a gambling tactic, it involves doubling the bet after each loss until a win occurs. In a fair even-odd game with a 50% win probability, the chance of losing once is 50%, twice is 25%, three times is 12.5%, four times is 6.25%, and so on. The more you play, the lower the chance of continuous losses. With infinite funds, you theoretically cannot lose.
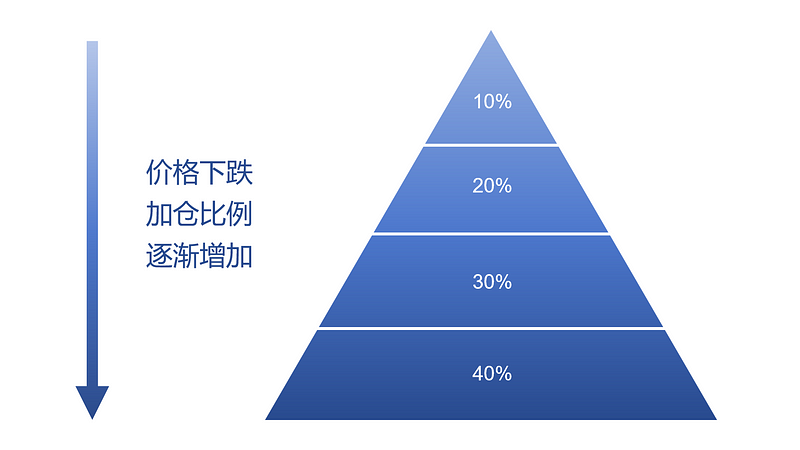
Later applied to trading, the Martingale strategy manifests as pyramid-style position scaling (this version is known as reverse Martingale).
Dollar-Cost Averaging (DCA): DCA is a long-term investment strategy where assets are purchased at regular intervals to average out the purchase price. It emphasizes consistent investment and long-term holding rather than profiting from short-term volatility.
Since the indicators above cannot pinpoint exact bottoms or tops—only relatively low or high levels—and because we can’t monitor them constantly, DCA becomes essential.
Strategy Design: Apply Martingale principles to DCA to minimize average holding cost. Example: Current Bitcoin price is $37,000. Assume DCA starts here. Indicators suggest the price is neutral—suitable for DCA. Set base investment at $1,000, weekly frequency. Each week, if price rises $1,000, reduce DCA amount by 5%; if price drops $1,000, increase by 5%—provided the price remains within the DCA range. Pause DCA when price exceeds the range; resume or consider profit-taking when back in range. These parameters are illustrative—different settings yield different returns. Readers can customize accordingly.
Drawback: The Martingale strategy is dubbed “never lose,” but only if the asset never goes to zero and the trader has infinite capital. Thus, it’s unsuitable for long-tail assets. The larger the capital, the more effective the strategy.
2. Using Grid Strategies to Amplify Returns
In long-cycle investing, holding Bitcoin spot on decentralized lending platforms yields low APY; centralized finance offers better rates but with limits. To improve capital efficiency and earn extra returns, spot grid trading is an excellent choice.
Spot Grid Strategy: An automated strategy that executes buy-low, sell-high trades within a set price range. Users define upper/lower bounds and number of grids. Optional triggers can start the strategy automatically when conditions are met. The system calculates buy/sell prices for each grid and places orders automatically, profiting from price fluctuations.
Strategy Design: Grid strategies work best in sideways or slowly rising markets—not in strong trending markets. A major flaw: when price breaks the range, you either miss gains or get stuck holding during a crash—why some call it a “garbage strategy.” We optimize it by avoiding traditional stablecoin/non-stablecoin pairs and instead using ETH/BTC with an infinite grid strategy.
Infinite Grid Strategy: An advanced version of standard grid trading. In rising markets, it ensures users maintain equivalent value in the quote currency. No matter how many times you sell, you retain the same invested value. For example: starting at 20,000 USDT/BTC with 1 BTC, you have 20,000 USDT invested. At 40,000 USDT/BTC, sell 0.5 BTC—you still hold 0.5 BTC worth 20,000 USDT. At 80,000 USDT/BTC, sell another 0.25 BTC—you still have 0.25 BTC worth 20,000 USDT. With no upper bound, infinite grid avoids missing out on sustained rallies.
Why ETH/BTC? Our optimization aims to reduce losses from price breakouts. While grid strategies can't eliminate downside risk, we aim to mitigate it. ETH/BTC reflects the relative strength between ETH and BTC. Over cycles, ETH/BTC trends upward in bull markets and downward in bear markets—perfectly aligning with the infinite grid strategy suited for slow, long-term uptrends. Plus, you gain exposure to both BTC and ETH upside during bull runs.
IV. Conclusion
Although the indicators and profit methods discussed are Bitcoin-focused, readers can adapt the bottom-picking and top-exiting logic to other cryptocurrencies. Bitcoin’s price movements also guide other coins, especially large-cap altcoins.
All indicators rely on inherent consistencies. Though black swan events occur, the crypto market won’t collapse to zero. As long as participants remain, prices will fluctuate—creating cycles that reflect both value assessment and time-based testing. For ordinary investors, leveraging cycles to capture industry growth is sufficient. This principle applies beyond crypto: multiples matter less than survival. The crypto space isn’t short of opportunities—it’s short of those who can stay in the game continuously.
Join TechFlow official community to stay tuned
Telegram:https://t.me/TechFlowDaily
X (Twitter):https://x.com/TechFlowPost
X (Twitter) EN:https://x.com/BlockFlow_News
 @jianshubiji