Diving into Celestia Token Allocation and Unlocking: Is It Undervalued?
TechFlow Selected TechFlow Selected
Diving into Celestia Token Allocation and Unlocking: Is It Undervalued?
53.2% was allocated to insiders, while only 7.4% was allocated to the community, highlighting a clear imbalance from the start.
Written by: An Ape's Prologue
Compiled by: TechFlow
The launch of the long-anticipated Celestia governance token—TIA—immediately attracted market attention, with over half of the token supply held internally. This unbalanced distribution results in limited circulating supply, raising many questions: Is it undervalued? Let’s explore:
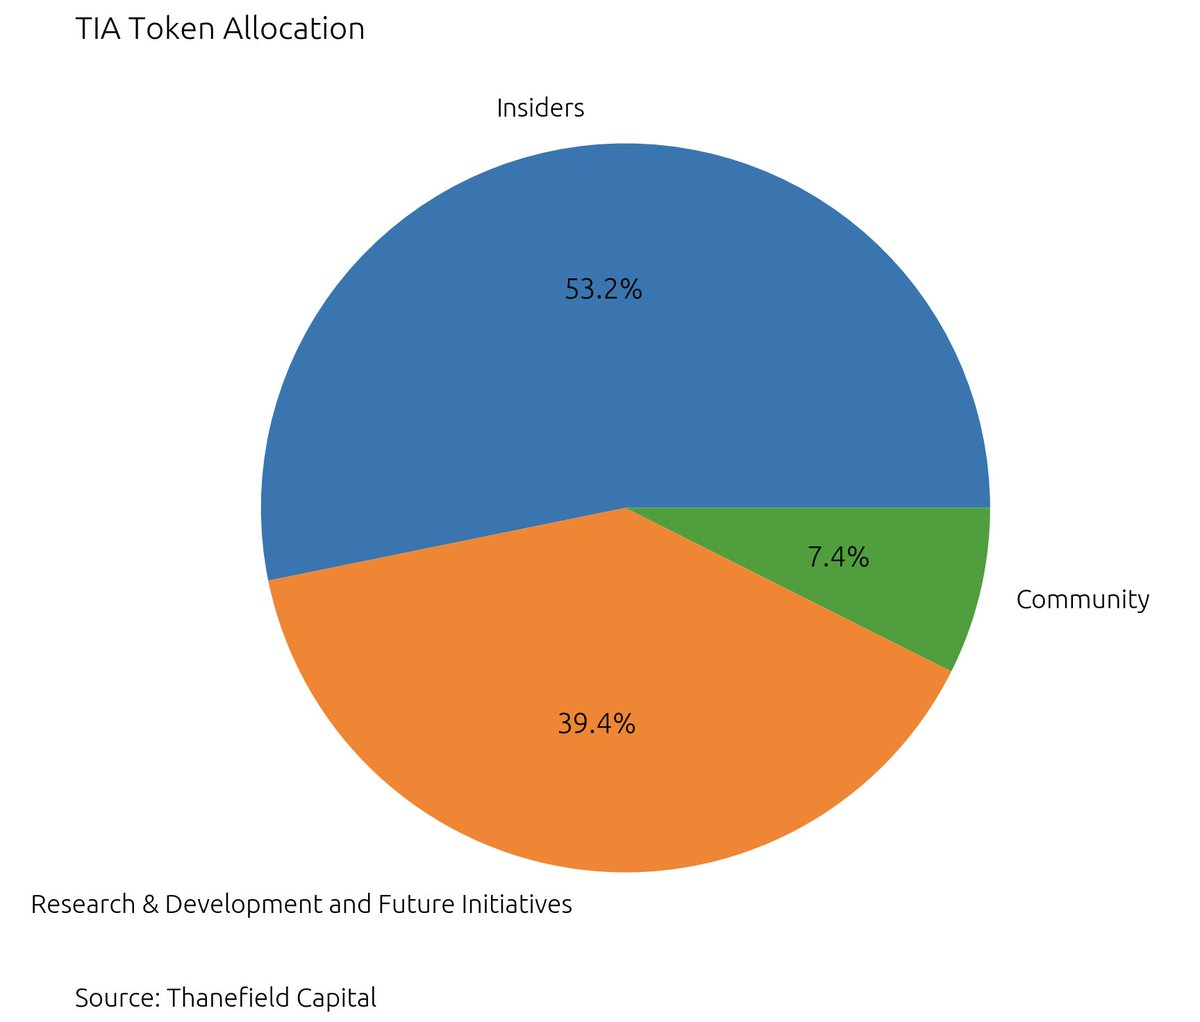
The above token allocation is striking: 53.2% allocated to internal holders versus only 7.4% to the community, highlighting a clear imbalance from the outset.
Regarding the unlock schedule, community tokens were fully unlocked at launch, providing a certain level of initial liquidity. In contrast, internal holder allocations will unlock 33% by the end of the first year, followed by a two-year linear vesting period.
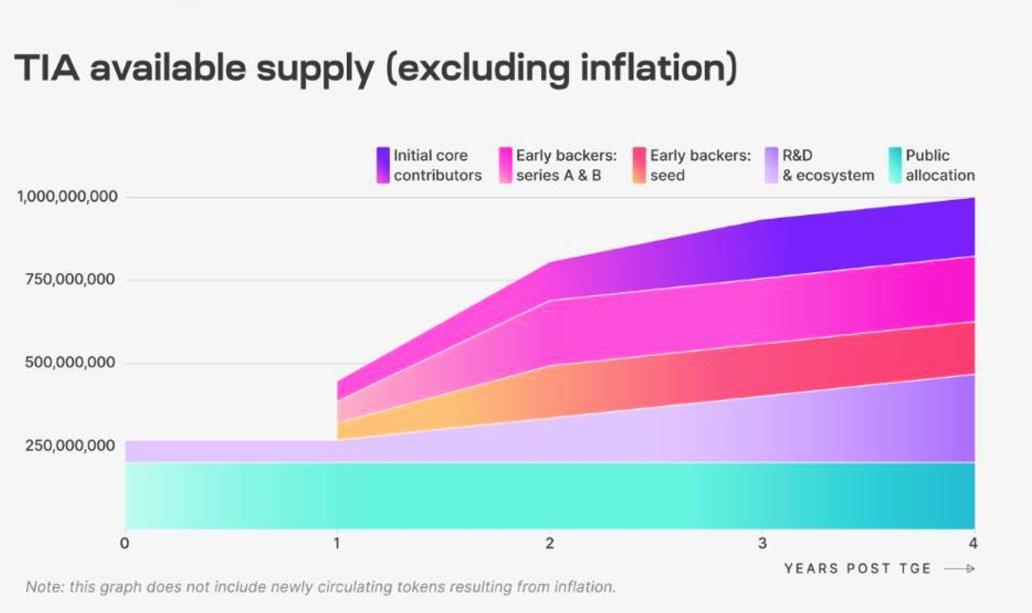
Research and development tokens follow a similar plan, unlocking 25% in the first year, with the remainder linearly vested over three years after twelve months.
Although 25% of these funds have already been unlocked—equivalent to 67 million tokens—they are primarily expected to remain in the foundation’s treasury accounts, staying off the open market in the short term and reducing overall selling pressure.
Despite TIA’s high fully diluted valuation (FDV) reaching a market cap of $333 million—similar to $SUI after its price dropped 70%—considering the restricted liquidity from R&D tokens, the effective market cap stands at just $175 million, suggesting TIA may be undervalued compared to its peers.
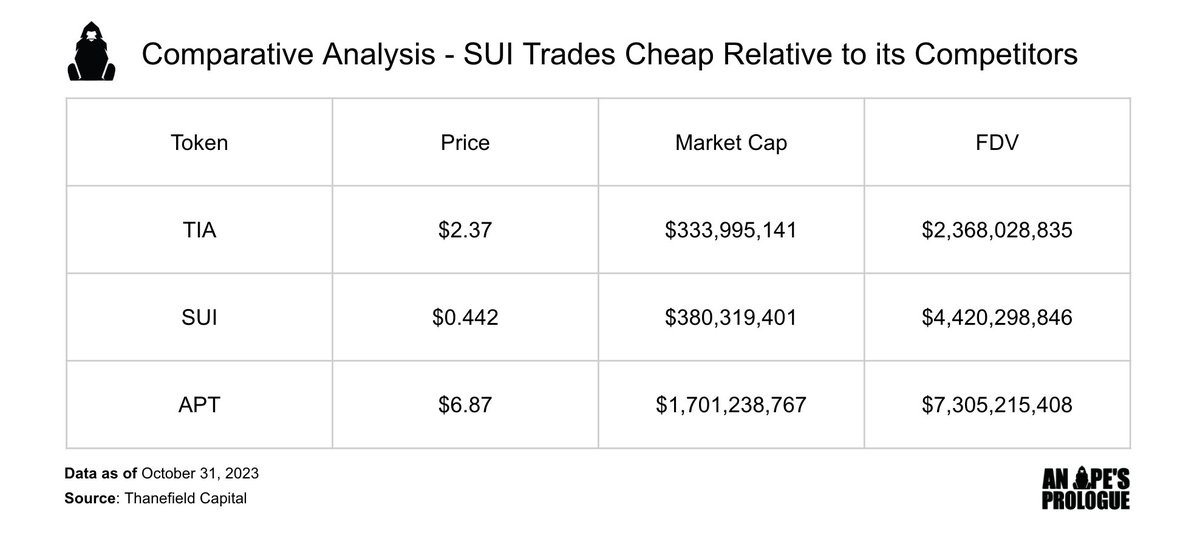
In comparison, TIA also has a relatively small market scale: its FDV is only half that of $SUI and one-third of $APT. At launch, $SUI was valued six times higher than $TIA, reaching $13 billion. However, it's important to note that current market conditions differ significantly from those several months ago, with notably reduced trading volume and liquidity, which may explain the differences in these comparative figures.
Join TechFlow official community to stay tuned
Telegram:https://t.me/TechFlowDaily
X (Twitter):https://x.com/TechFlowPost
X (Twitter) EN:https://x.com/BlockFlow_News