
Data Analysis: The Surge Has Arrived—What Comes Next?
TechFlow Selected TechFlow Selected
Data Analysis: The Surge Has Arrived—What Comes Next?
With coin prices skyrocketing, what does the future hold?
 Navigating Web3 tides with focused insights
Macro Analysis
Inflation Bounces Back — When Will Rate Cuts Come?
The U.S. September core Personal Consumption Expenditures (PCE) inflation rate came in at 3.7% year-over-year, matching market expectations. As the Federal Reserve's preferred inflation gauge, core PCE reveals some important details:
-
U.S. core PCE prices rose 0.3% month-on-month, significantly exceeding August’s 0.1% and marking the largest monthly increase in four months.
-
September PCE spending increased 0.7% month-on-month, surpassing the expected 0.5% and prior 0.4%.
-
Personal income growth slowed to 0.3% month-on-month in September, down from 0.4%, falling short of expectations and also below September’s 0.4% CPI rise.
Key takeaways from the report:
-
Inflation remains persistent and is rebounding.
-
While consumer spending remains strong, income growth is weakening.
U.S. Economic Data Continues to Shine
The U.S. economy expanded faster than expected in the third quarter, achieving its strongest growth rate in nearly two years—further evidence of economic resilience despite high interest rates.
Preliminary data shows that U.S. GDP grew at a robust 4.9% in Q3, significantly exceeding economists’ forecasts of 4.3%. This marks an acceleration from Q2’s 2.1% and represents the strongest quarterly performance since Q4 2021, driven by resilient consumer demand despite rising interest rates, inflationary pressures, and various domestic and global headwinds.
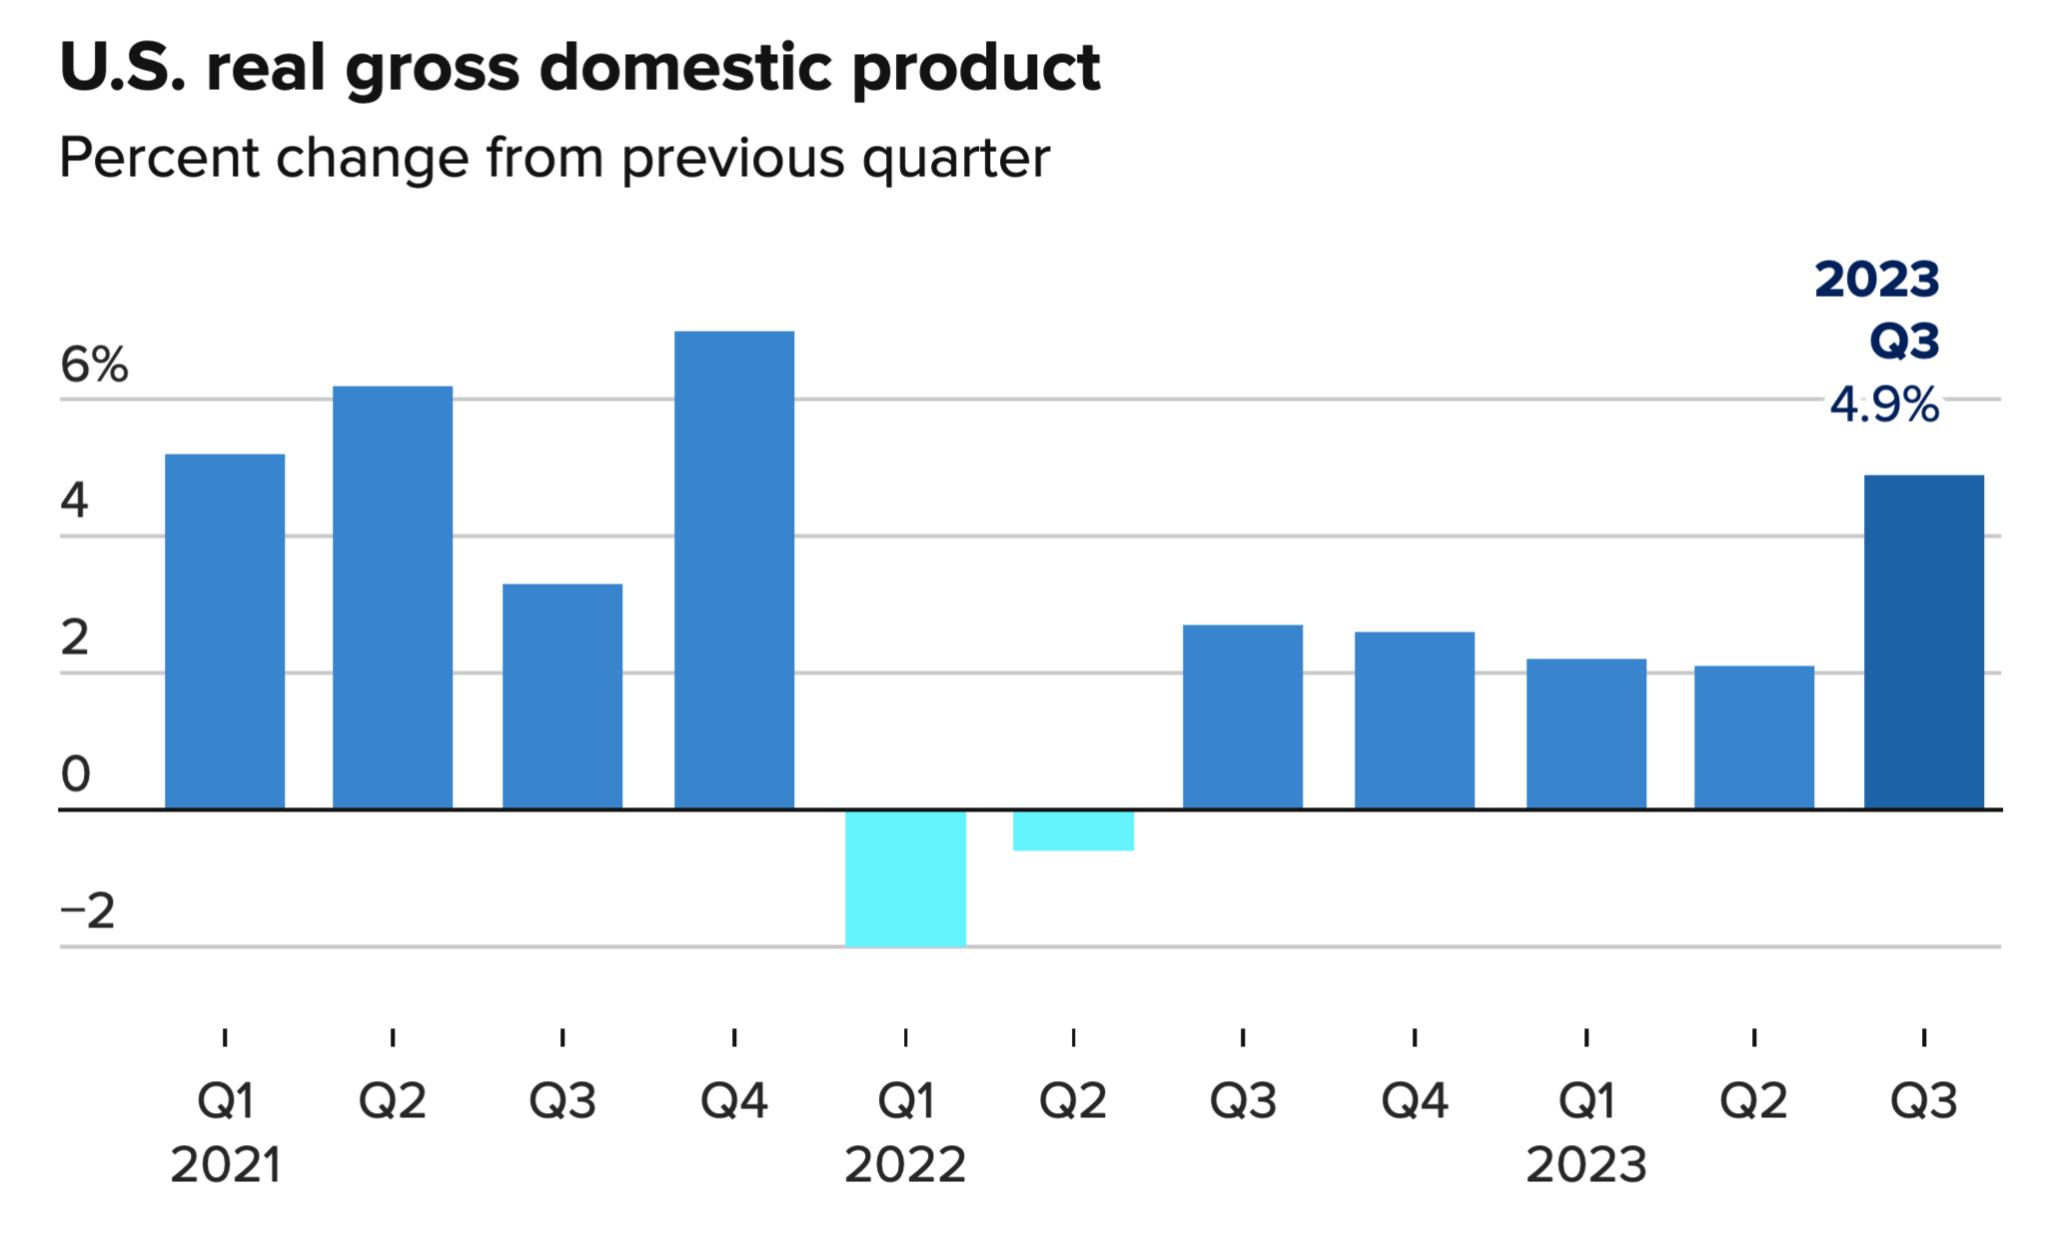
U.S. Q3 GDP growth far exceeds expectations
The Federal Reserve has raised interest rates at the fastest pace since the early 1980s and has signaled it will keep rates elevated until inflation returns to acceptable levels. Yet, GDP continues to grow. Although inflation has moderated recently, price increases remain well above the Fed’s 2% annual target.
We believe neither PCE nor GDP changes alter the outlook for monetary policy. However, the real concern behind these figures is whether current consumption trends can be sustained in the coming quarters amid stagnant or shrinking incomes. High interest rates will eventually have a material impact on the U.S. economy. We will continue monitoring this closely.
Fundamental Analysis
Price Surge — What Lies Ahead?
1. Exchange Bitcoin Inventory
Bitcoin inventory held on cryptocurrency exchanges reflects users' willingness to hold crypto assets. A rapid increase in exchange holdings suggests holders are depositing Bitcoin into exchange wallets in preparation for selling. Conversely, a decline indicates a broader shift of assets to wallets outside exchanges, signaling stronger long-term holding sentiment and a bullish signal for prices.
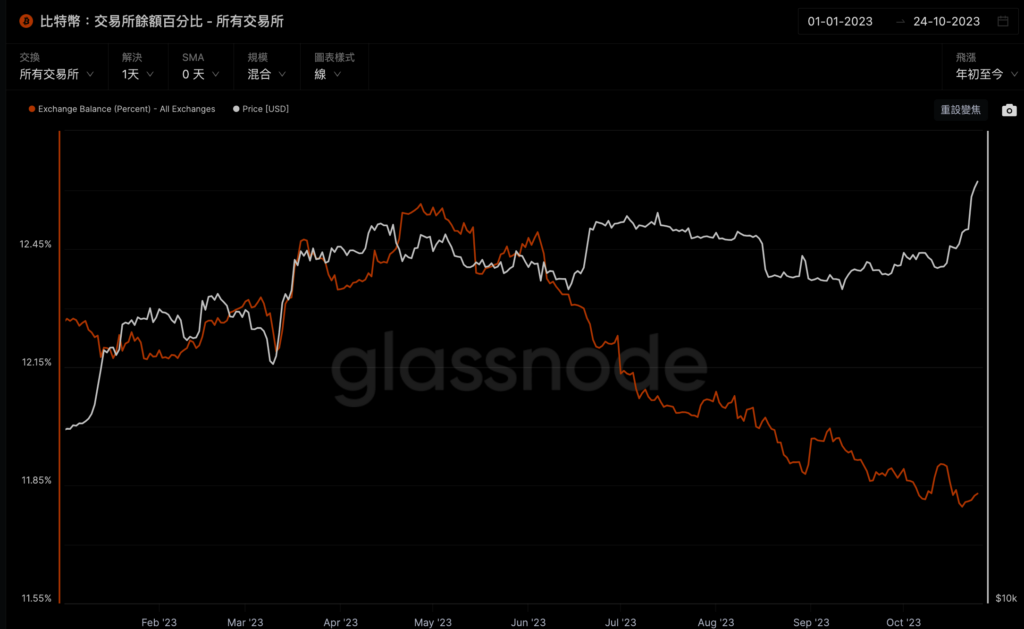
According to Glassnode data, exchange Bitcoin balances have been on a steady downward trend since May, indicating growing long-term holding sentiment and a shrinking proportion of sellable supply—pointing to reduced market selling pressure. This suggests investors expect future price increases and are increasingly accumulating spot holdings, which is a positive bullish signal. However, recent minor upticks indicate some short-term selling pressure has started to build.
Meanwhile, with reduced market supply, even modest demand growth can trigger sharp price rallies. In this context, we still advise caution in futures leveraged trading, especially high-leverage short positions.
2. Exchange Stablecoin Inventory
An increase in stablecoin holdings on exchanges typically means investors are waiting on the sidelines, having sold their tokens for stablecoins—a bearish signal. Conversely, declining stablecoin balances suggest investors are converting stablecoins into cryptocurrencies like Bitcoin and Ethereum, indicating bullish market sentiment.
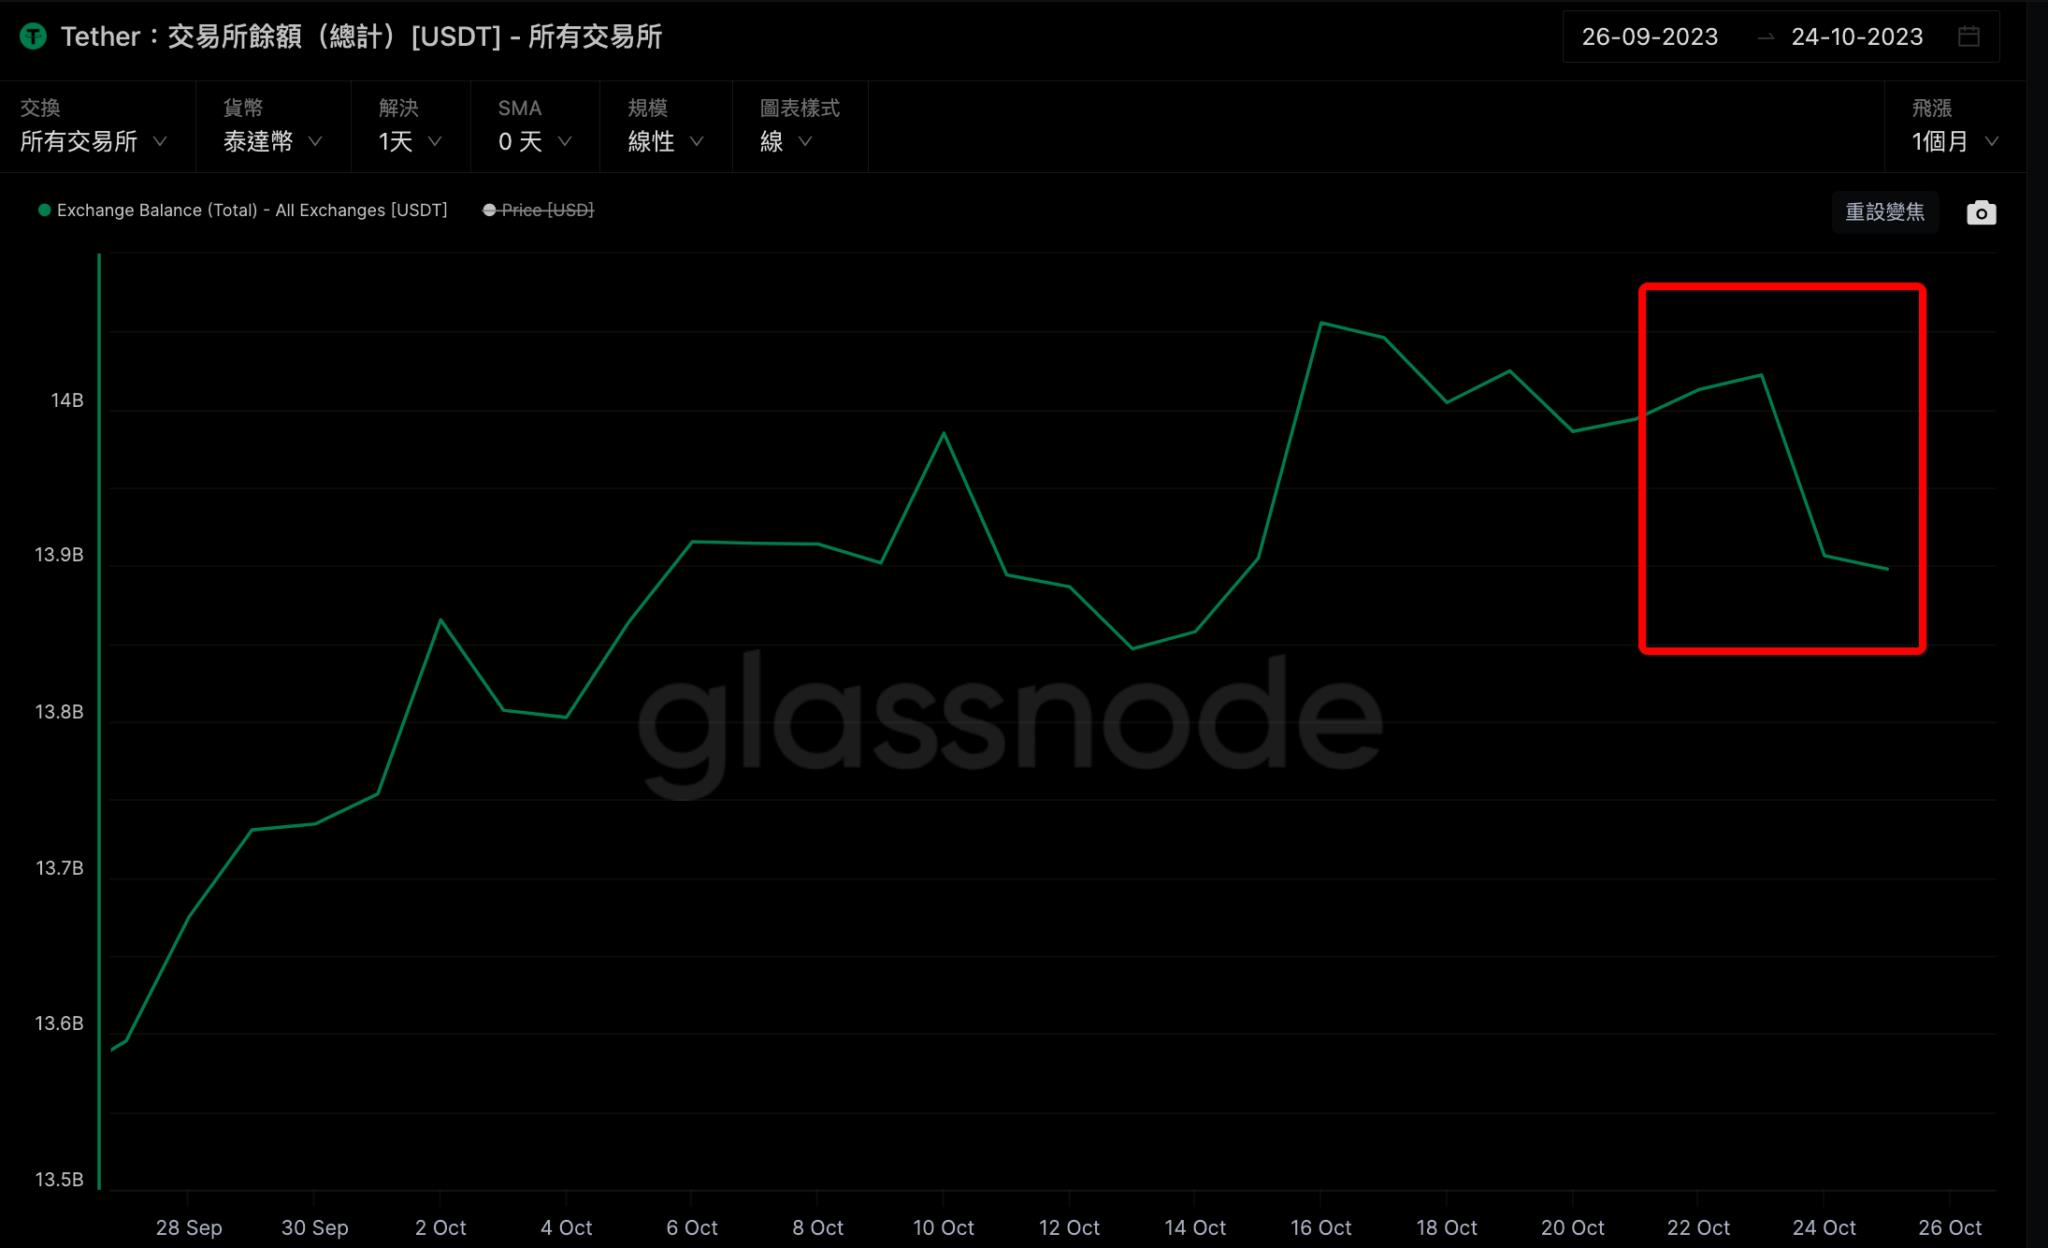
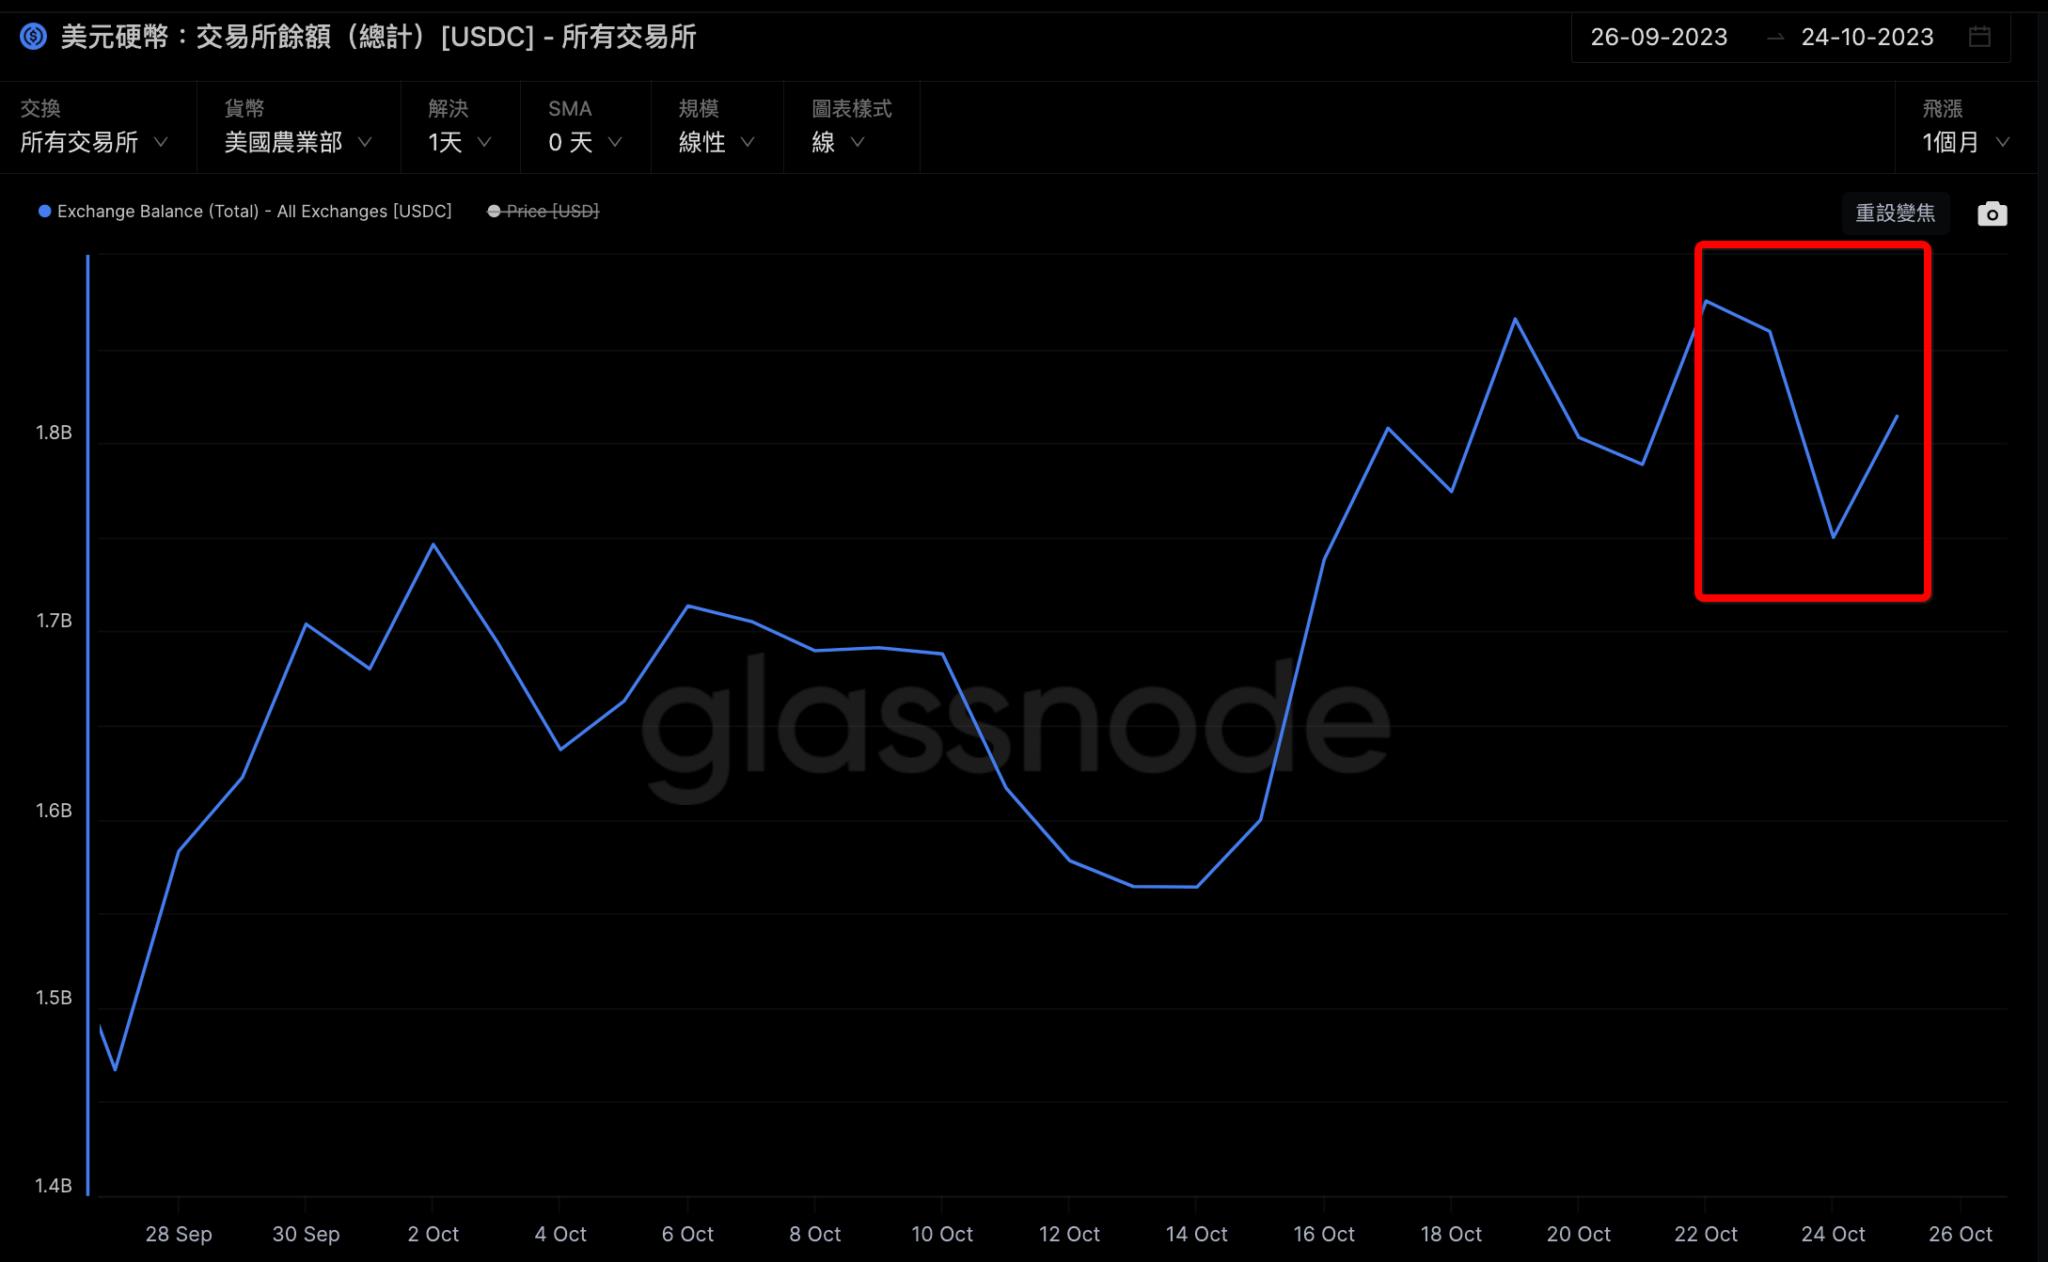
The total stablecoin market cap stands at approximately $122 billion, with USDT and USDC accounting for nearly 87%. Recent exchange-level data show clear declines in both USDT and USDC holdings, signaling strong bullish sentiment in the market.
Exchange data confirm that market sentiment remains elevated. Against a backdrop of stable total stablecoin supply, more investors are choosing to buy and hold Bitcoin, leading to marginal declines in stablecoin inventories and marginal increases in Bitcoin holdings. Whether this trend can persist remains to be seen—we will continue updating data and providing fresh insights.
Technical Analysis
Bitcoin
Last week, we noted that Bitcoin had resumed its bull market structure. On Monday, Bitcoin broke through all resistance levels, officially bringing us back into bullish territory. The magnitude of this breakout reflects substantial capital reserves waiting to enter the market, as well as investor fear of missing out (FOMO). Some attributed the price move to news that BlackRock’s proposed Bitcoin ETF ticker IBTC was listed on the DTCC website—an indication that the ETF approval process at the SEC has progressed. However, reports indicate IBTC was actually added to DTCC back in August, but only began trending on Twitter just before the price surge.
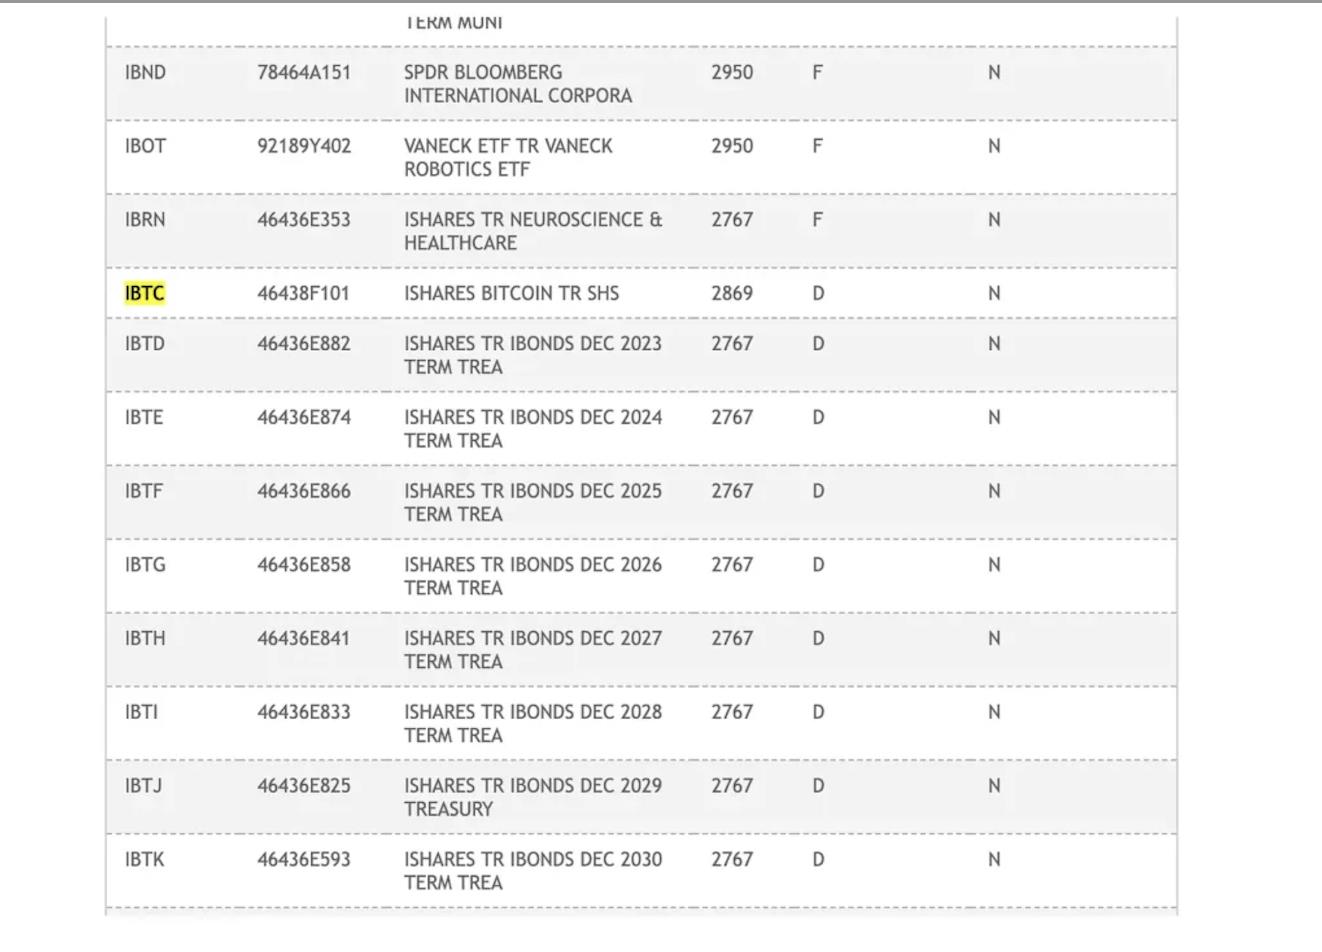
BlackRock clarified that listing a ticker on DTCC does not guarantee ETF approval—it is merely a standard preparatory step, consistent with other ETF filings. Nevertheless, after the clarification, marginal capital inflows did not stop, further supporting our view that this rally is being fueled by FOMO-driven traders.
The weekly candle just closed, showing expanding range (low → high) alongside increasing volume—a clear bullish signal. Additionally, both the 50-day and 200-day moving averages are sloping upward, confirming the overall uptrend. RSI has just entered overbought territory; in a long-term context, this could actually signal the emergence of a powerful new trend (similar to October 2020).
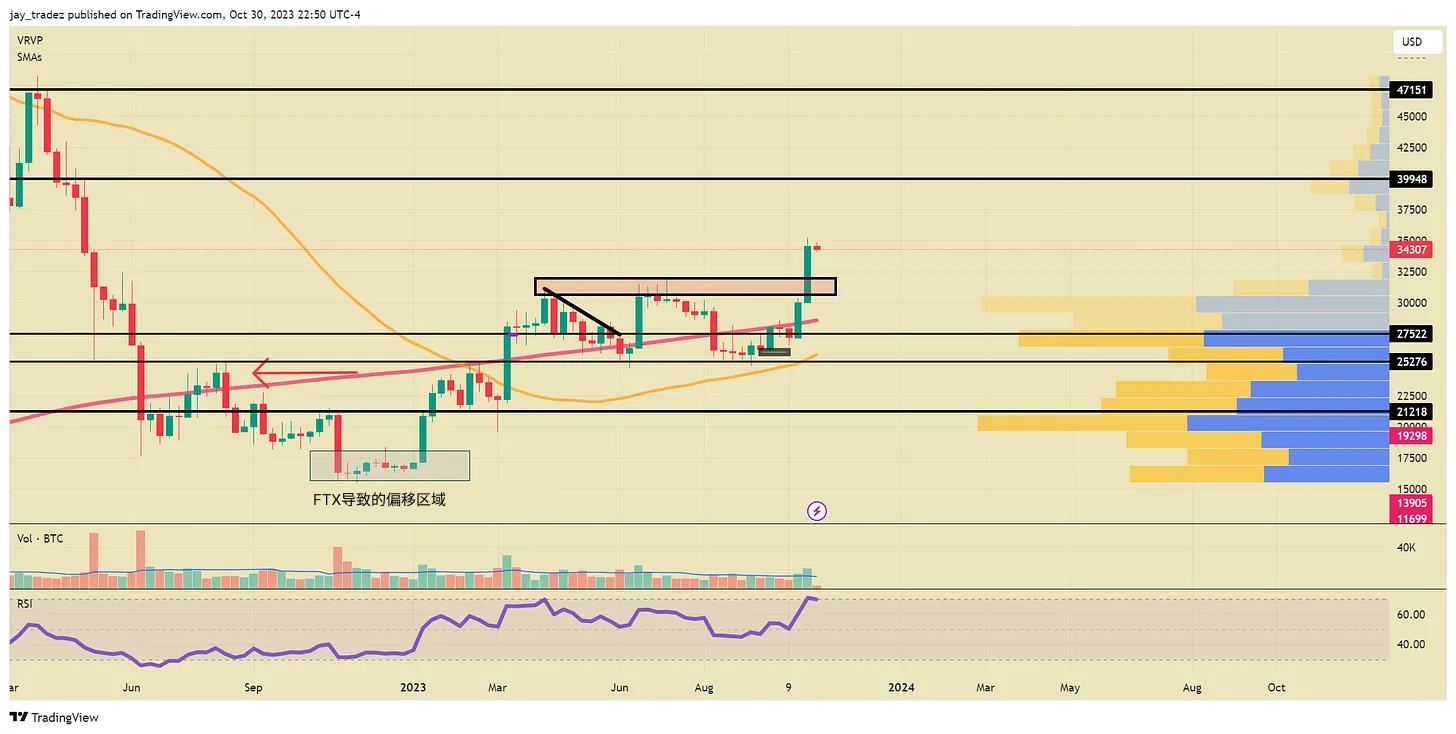
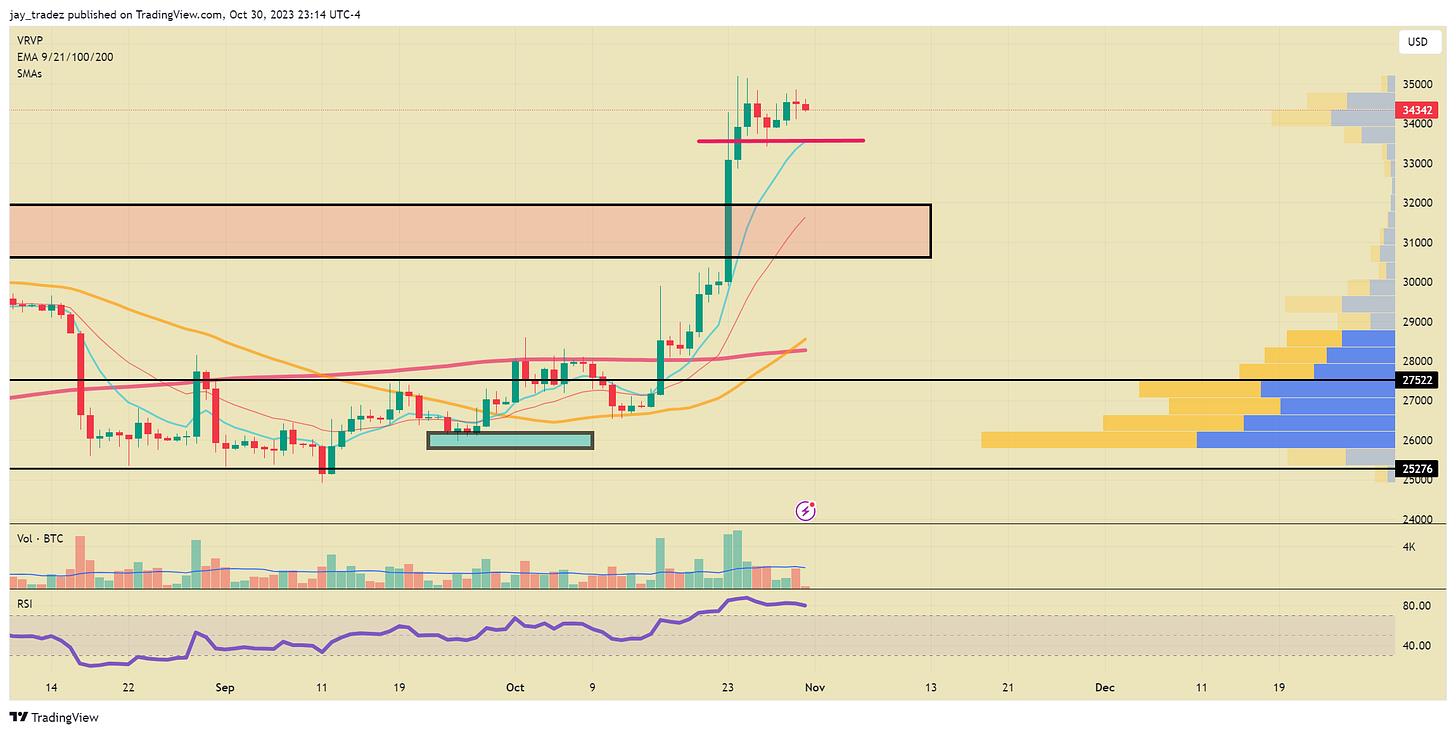
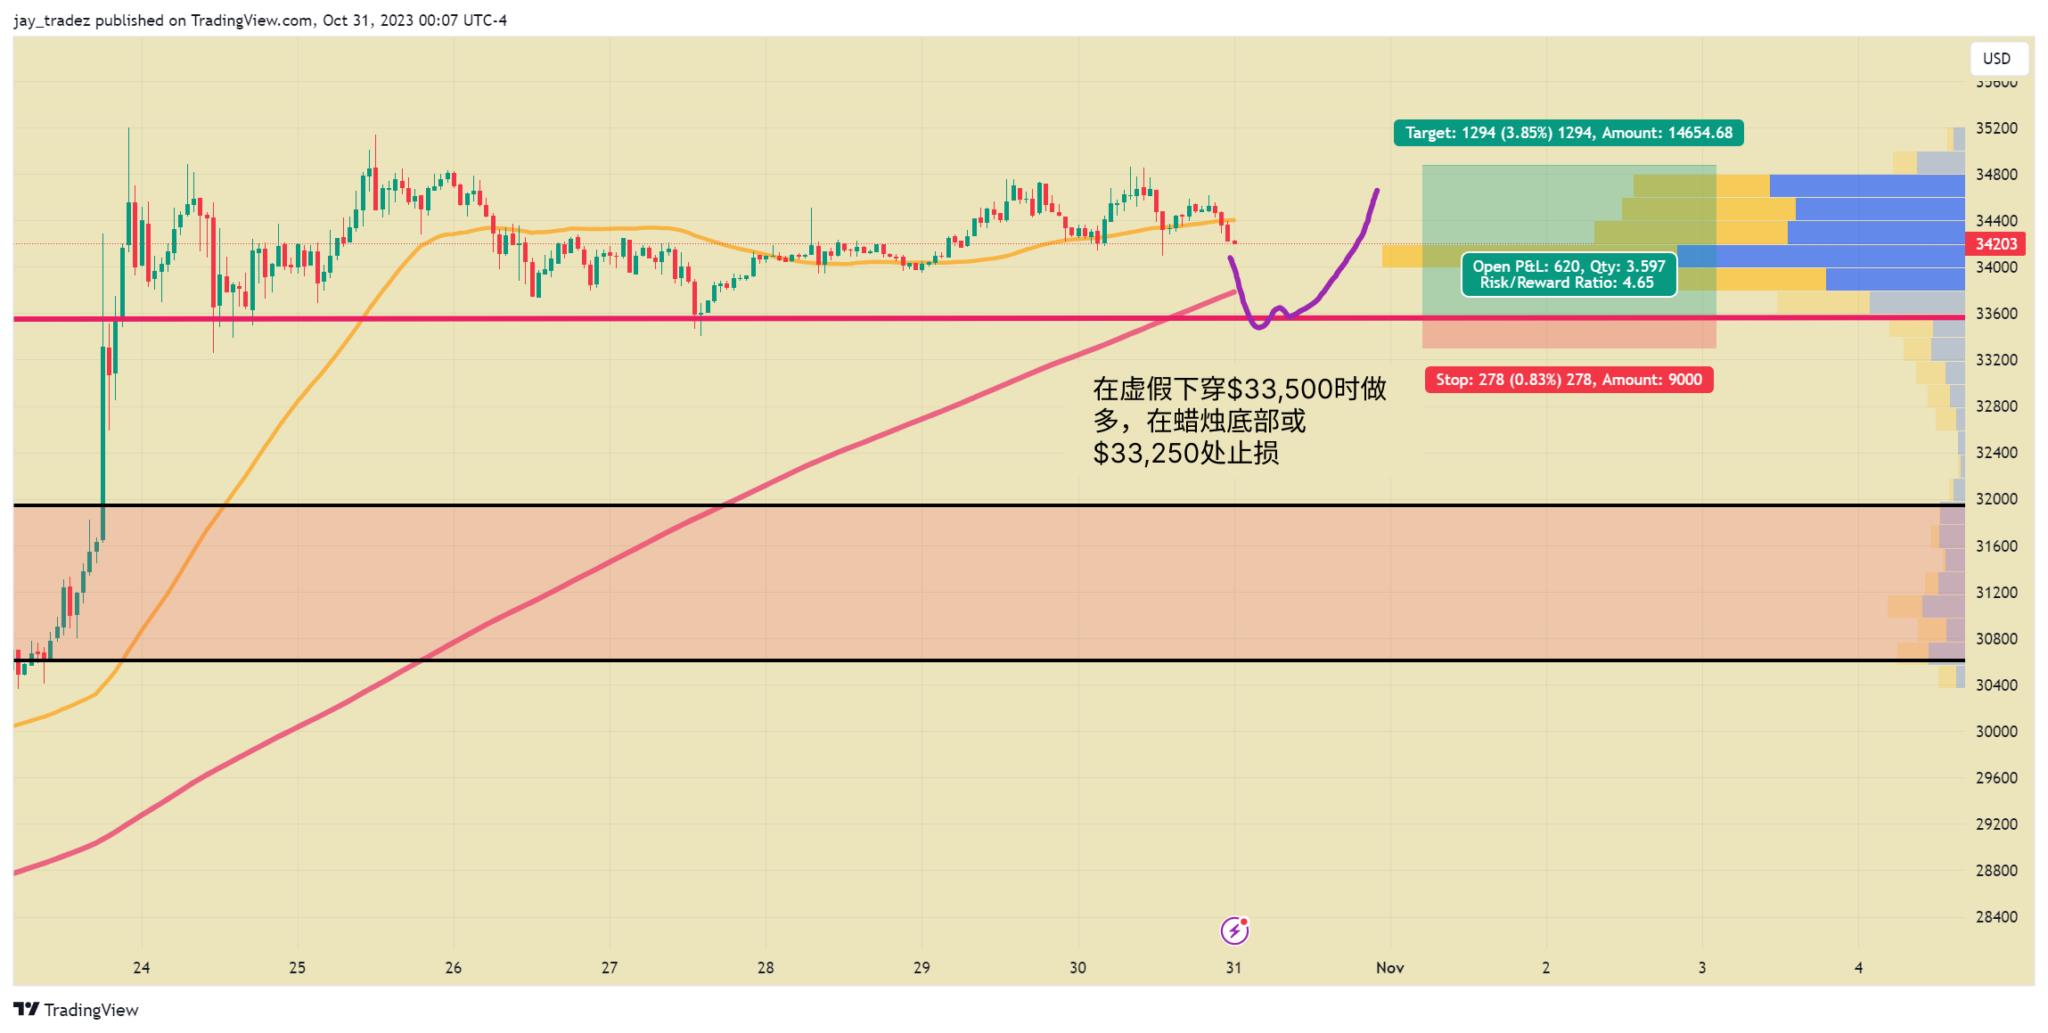
We maintain a bullish stance, believing the likelihood of Bitcoin falling below $30,000 is low. Daily charts appear to show a bullish consolidation pattern. Ideally, we want to see BTC break above $33,500 and establish support there. In such a scenario, going long offers an attractive risk-reward ratio. Alternatively, one could wait for a daily close above $35,000. If that occurs, we may test the next resistance level at $40,000. However, as with any breakout, a false breakout is possible, potentially leading to prolonged stagnation.
Overall, we do not want to see prices fall below $32,000, as that marks a key long-term resistance zone and the prior 2023 high we just broke through. A drop below $32,000 would damage the price structure. That said, if we allow some room, $30,000 could serve as the final support to watch, as it was the short-term resistance we recently surpassed. While we consider this scenario highly unlikely, if prices do fall below $30,000 at any point, we could retest $25,000—and possibly break below. All FOMO buyers would face losses, and the entire bullish narrative would collapse.
SPX/NDX
It's becoming hard to ignore the growing unease in markets. Last Friday, the S&P 500 officially entered correction territory, dropping over 10% from its 2023 peak. The Nasdaq fared worse, down more than 12%, while the Dow experienced its most challenging week since the March banking crisis.
Recent University of Michigan surveys show clear declines in consumer sentiment and expectations. Given that consumer spending is the primary driver of real GDP growth, this is concerning.
The chart below illustrates the relationship between Nasdaq price movements and the percentage of Nasdaq-listed stocks trading above their 200-day simple moving average (SMA). It reveals a continuous decline in positioning among small- and mid-cap stocks since the first quarter of this year.
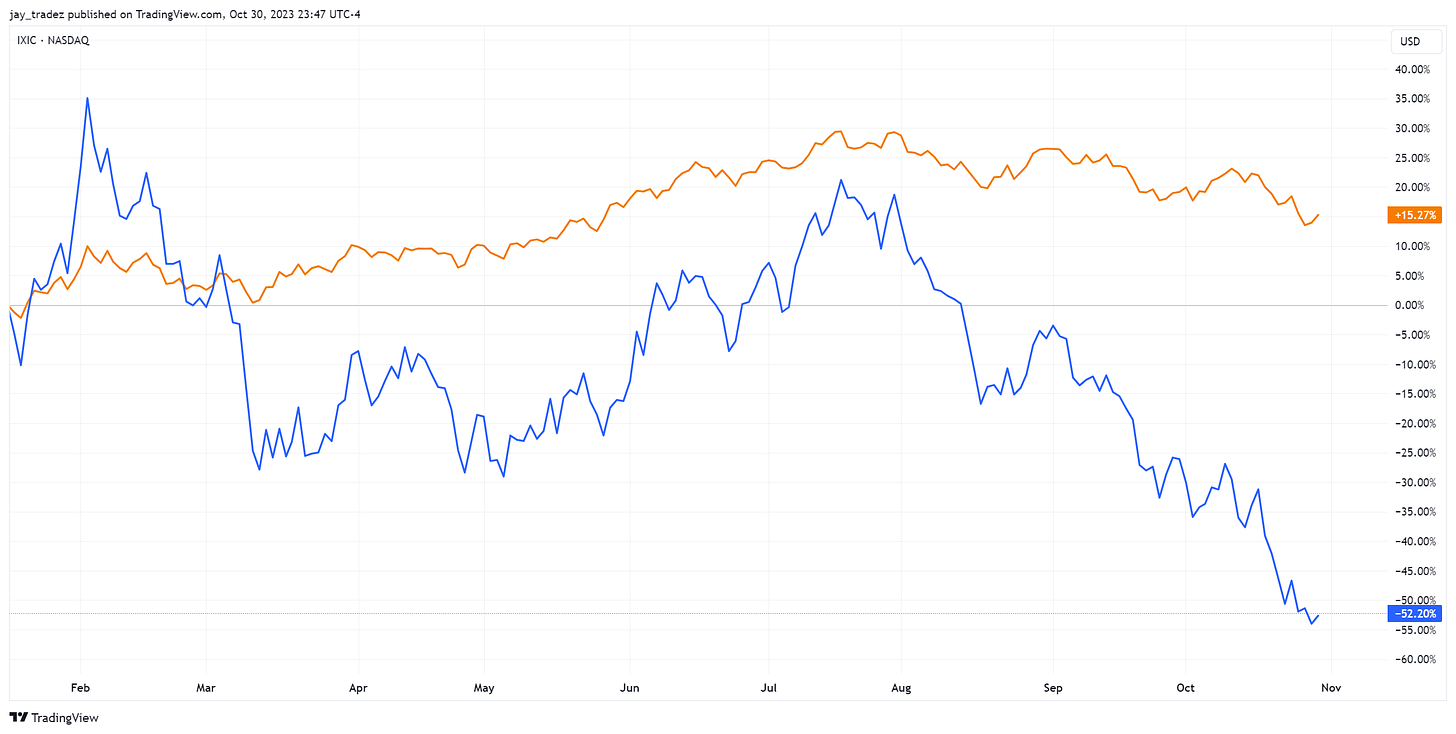
Blue line: Percentage of Nasdaq stocks below 200-day MA Orange line: Nasdaq Composite Index
A large portion of capital within the index is concentrated in what we call the "Magnificent Seven" (Meta, Amazon, Google, Nvidia, Netflix, Microsoft, and Tesla). However, as companies like Google and Tesla release disappointing reports, the entire index suffers. When comparing the Nasdaq 100 with its equal-weighted counterpart, we observe that the equal-weight version is not outperforming the cap-weighted index. This implies that weakness among the Magnificent Seven is dragging down overall market sentiment.
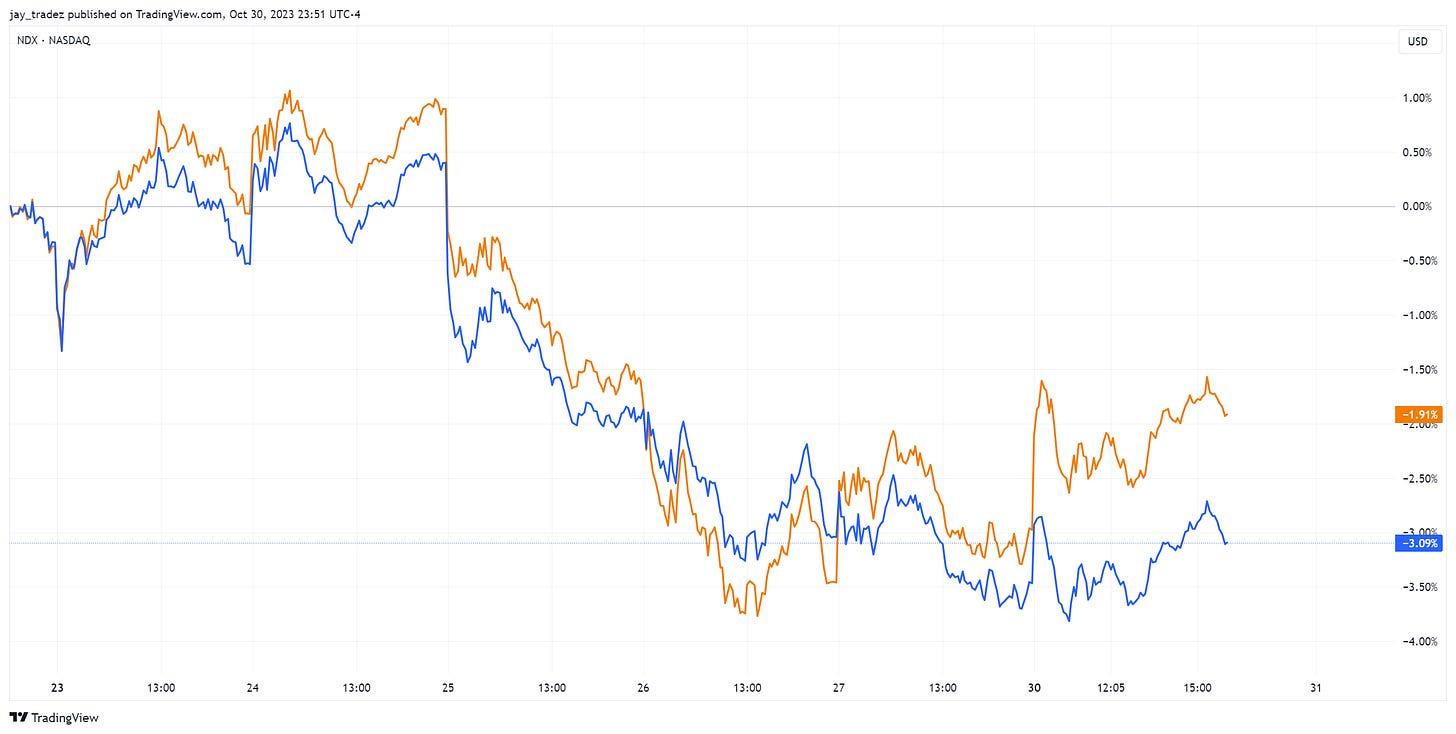
Blue: Equal-weighted, Orange: NDX
Trading Recommendations
Bitcoin
Futures | Spot
As discussed in the technical analysis section, we outline a short-term trading strategy offering a favorable risk-reward profile with a high probability of success. Go long when price breaks and closes above $33,500 on a short-term timeframe (5 minutes – 1 hour). Your stop-loss should be placed at $33,250 or slightly below the low of any false breakdown. The first target is $35,000, giving you a 4.5:1 risk-to-reward ratio. However, if you anticipate further upside, you may choose to wait for a confirmed breakout above $35,000 before entering.
Join TechFlow official community to stay tuned
Telegram:https://t.me/TechFlowDaily
X (Twitter):https://x.com/TechFlowPost
X (Twitter) EN:https://x.com/BlockFlow_News
 @pionex_com