Using P/E Ratio to Evaluate ETH: Buying More When It's Pricier Defies Intuition — Traditional Valuation Methods May Not Apply
TechFlow Selected TechFlow Selected
Using P/E Ratio to Evaluate ETH: Buying More When It's Pricier Defies Intuition — Traditional Valuation Methods May Not Apply
Buy ETH when its price-to-earnings ratio is at a peak, and sell when it's at a trough.
Written by: SAM ANDREW
Compiled by: TechFlow
Ethereum has characteristics of a productive asset—it generates profits that accrue to token holders. But is it valued like a stock? Do Ethereum’s valuation multiples affect the price of ETH?
Valuation multiples are heuristic methods for assessing an asset's value. Google trades at a P/E ratio of 30x. Nvidia trades at 230x. If Google’s current earnings were sustained for 30 years, it would take 30 years to recoup the investment. If Google’s earnings grow, the payback period shortens. Relative to Nvidia, Google appears undervalued. Price multiples—such as the difference between 30x and 230x—are not the sole drivers of returns, but they are significant. Expensive assets like Nvidia embed high growth expectations into their current valuations. If those expectations aren't met, prices can collapse.
Similar valuation multiples can be applied to cryptocurrencies. Market cap divided by total fees is one such multiple for crypto assets. Market cap reflects the market’s current perception of an asset’s value. Fees represent the total revenue generated by the protocol. A blockchain’s revenue is akin to distributed profits across its network. Thus, for blockchains, revenue and earnings multiples are effectively equivalent.
What Is Ethereum’s Valuation Multiple?
Currently, Ethereum trades at 100 times its seven-day annualized fees. Since the summer of 2022, Ethereum’s fee multiple has fluctuated between 25x and 235x (see chart below: ETH price and market cap/fees since the 2022 low).
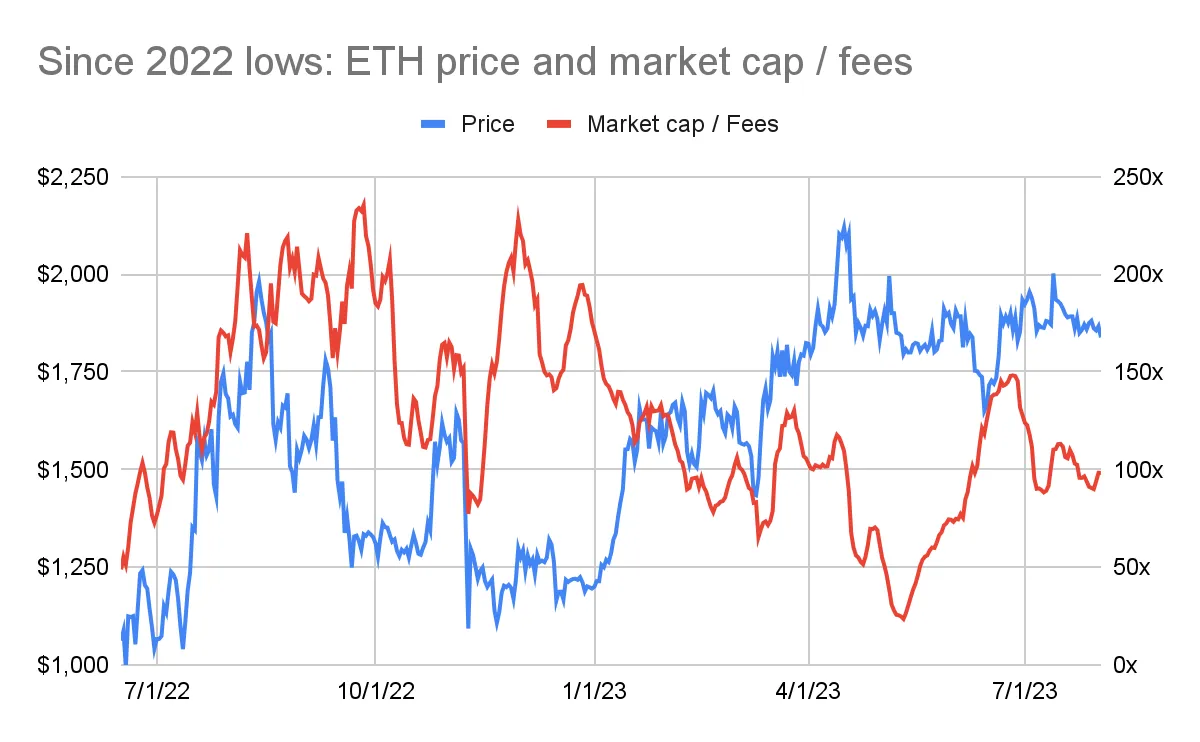
An Unexpected Relationship
The chart above reveals an inverse relationship between Ethereum’s price and its valuation multiple. The best time to buy Ethereum was at the end of 2022, when the price was around $1,200. Yet precisely at that moment, Ethereum’s valuation multiple was higher—reaching 200x fees. By spring 2023, Ethereum’s price approached $2,000, while its fee multiple dropped to 50–100x.
This inverse relationship between price and valuation multiple is counterintuitive. Typically, lower valuation multiples signal better investment opportunities. Multiples tend to be low before an asset reaches an inflection point. Once the market recognizes undervaluation, prices begin rising—and so do multiples.
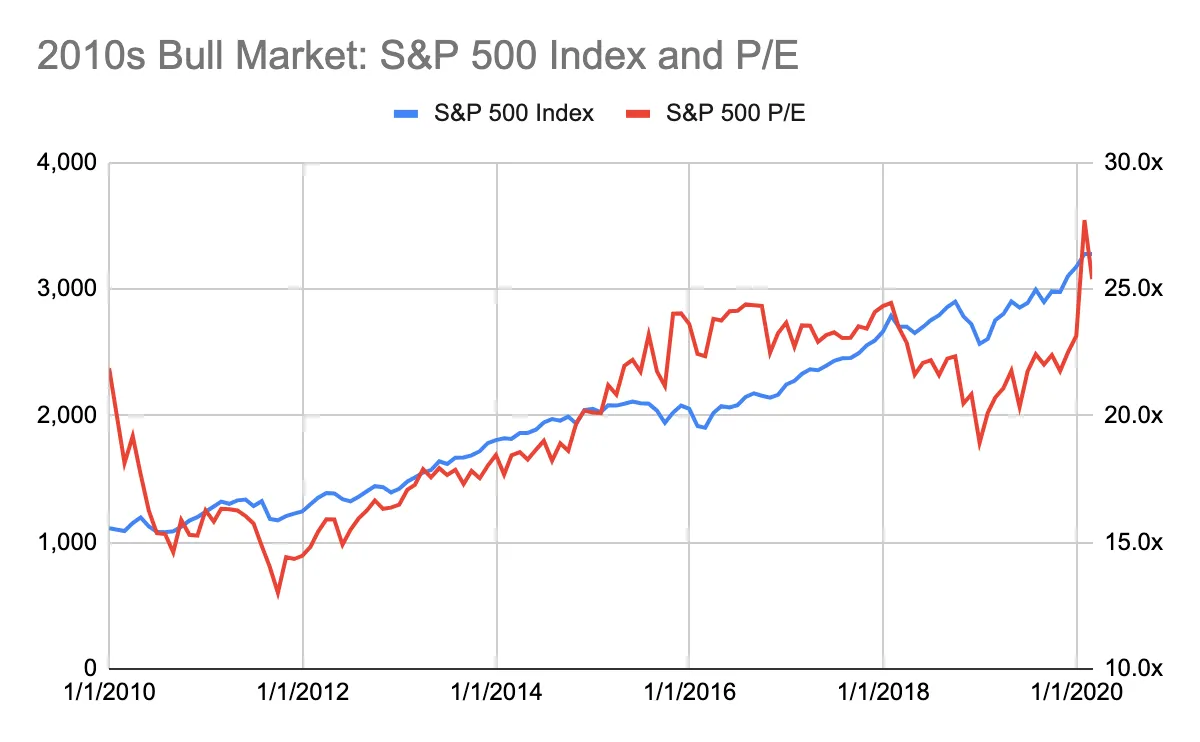
The next chart (Bull Market of the 2010s: S&P 500 and P/E Ratio) illustrates this typical dynamic. It shows the bull run in U.S. equities during the 2010s, prior to the pandemic. At the start of the decade, the S&P 500 traded at about 15x earnings. Its average P/E since 1928 is 18x, and 26x since 2000. In 2011, as the U.S. recovered from the global financial crisis with interest rates near historic lows, an inflection occurred. From then on, both price and multiples rose steadily.
So what can we infer from Ethereum’s multiples?
Do Ethereum’s multiples suggest ETH is “cheap” or “expensive”?
How does “cheap” or “expensive” translate into ETH’s price performance? Is it, like in stocks, a reliable indicator of a good buying opportunity?
Historical data can help answer these questions.
Over the past five years, ETH’s price surged from $10 to over $4,000—a 400x increase. Such dramatic price swings make it difficult to analyze trends within a single chart. Instead, examining distinct periods clarifies the pattern.
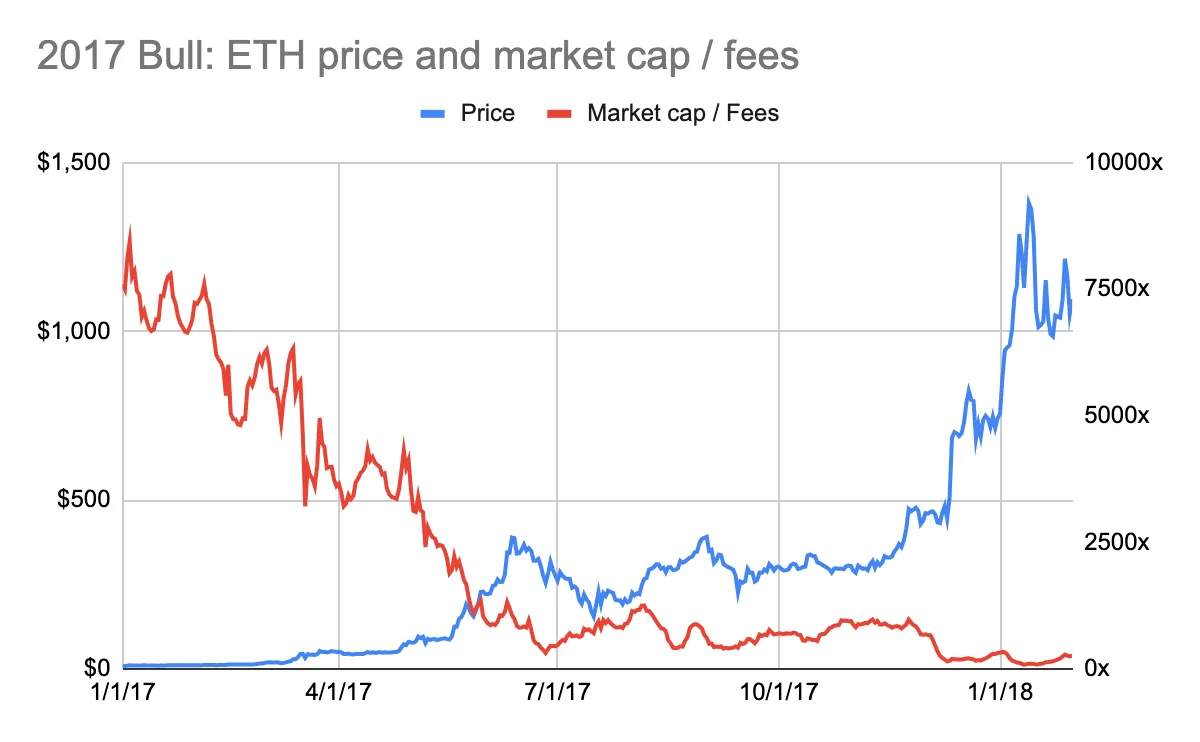
The 2017 bull market highlights the inverse relationship between multiple and price. In early 2017, Ethereum’s multiple peaked at an astonishing 7,700x fees (see chart below: 2017 Bull Market: ETH Price and Market Cap/Fees). Yet from a price perspective, this was an excellent time to buy ETH—at around $10. Subsequently, ETH’s price increased tenfold, while the multiple compressed to 100x.
The 2021 bull market followed the same trend. Buying ETH in early 2020 at around $200 coincided with a fee multiple of 650x (see chart below: 2021 Bull Market: ETH Price and Market Cap/Fees). ETH’s price then grew 24x, while its fee multiple compressed to 22x.

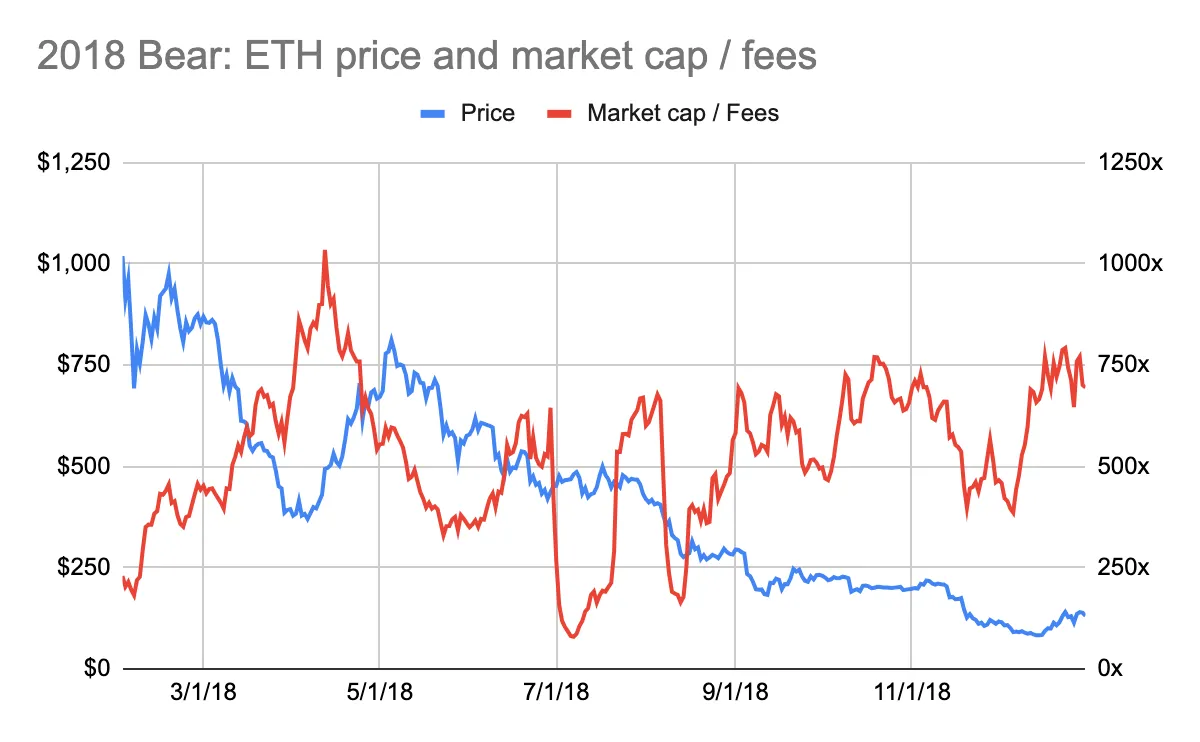
Bear markets also exhibit this inverse pattern. In early 2018, ETH reached nearly $1,000, while its fee multiple dropped to 200x (see chart below: 2018 Bear Market: ETH Price and Market Cap/Fees). Just months earlier, the multiple had exceeded 3,000x (see previous chart: 2017 Bull Market). This suggests it was a good time to sell.
Likewise, at the end of 2021, ETH hit an all-time high above $4,000, while its fee multiple fell to 25x (see chart below: 2022 Bear Market: ETH Price and Market Cap/Fees). Again, this signaled a strong exit point.

Multiple Conclusions
ETH price and valuation multiple move inversely. History suggests: Buy ETH when its trading multiple is at a peak, and sell when it’s at a trough. Buy when ETH is most expensive by valuation, sell when it’s cheapest.
This conclusion is indeed counterintuitive.
It contradicts how productive assets—like stocks—are typically traded.
How Can This Unique Relationship Be Explained?
The counterintuitive pattern can be explained by two key points:
-
Markets are forward-looking.
-
Ethereum is not valued based on fee multiples.
1. Markets Are Forward-Looking
Whether stocks, commodities, or cryptocurrencies, markets are inherently forward-looking. Prices reflect future expectations, not past events. Think of it this way: a company’s value is based on its future cash flows.
The market cap/fee multiple reflects Ethereum’s fees at a specific point in time. The fee data used to calculate the multiple is the sum of the past seven days’ fees, annualized by multiplying by 52 weeks. It does not reflect Ethereum’s future fee potential. This metric is not forward-looking.
Historical analysis confirms Ethereum’s forward-looking nature. During the 2017 bull market, ETH’s price rose before Ethereum’s fees (in ETH terms) began increasing (see chart below: 2017 Bull Market: ETH Price and Fees). Note that the price decline in early 2018 was slower than the drop in fees.

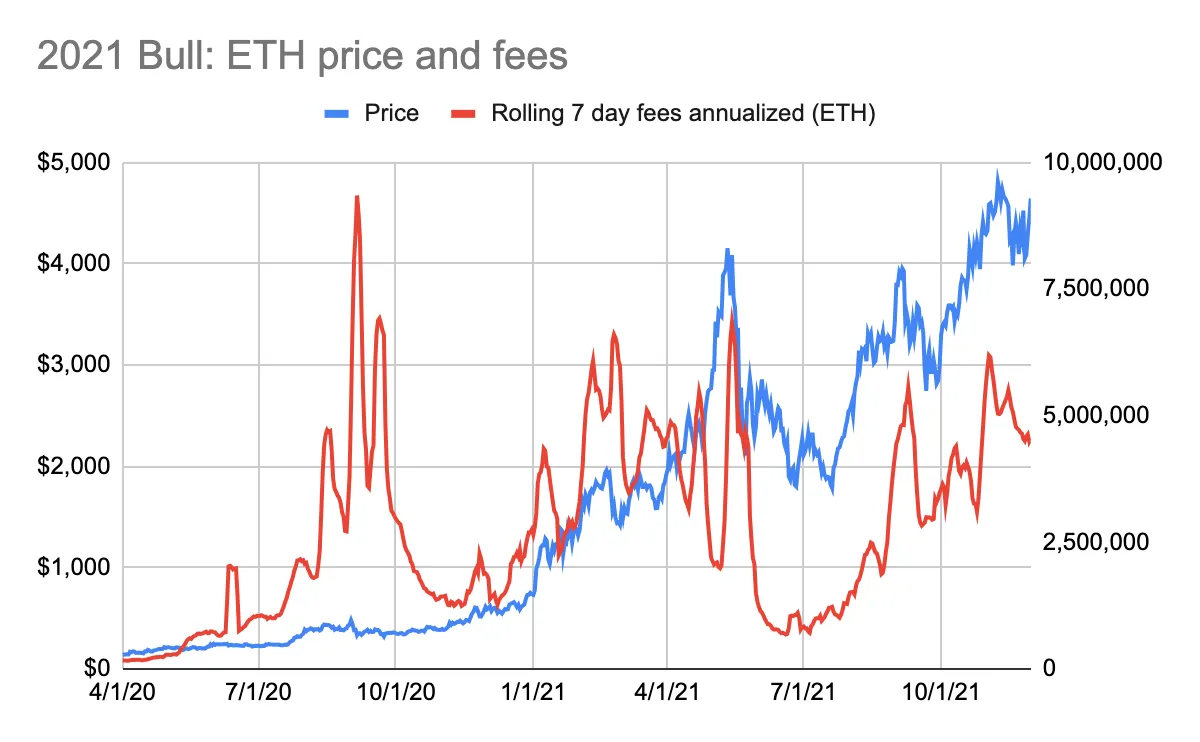
A similar, though weaker, pattern emerged in the 2021 bull market. Up until May 2021, price increases preceded corresponding rises in fees (see chart below: 2021 Bull Market: ETH Price and Fees). However, in summer 2020, fees nearly doubled without a proportional rise in ETH’s price. Conversely, in early 2021, rising fees drove price gains. This reversal may be explained by the pandemic. In summer 2020, lockdowns led to a surge in DeFi applications, increasing user spending on Ethereum fees. Yet institutional investors weren’t yet focused on crypto.
Price movements in anticipation of rising Ethereum transaction fees are most evident during bull markets. When ETH price is falling or consolidating, this relationship is neither confirmed nor refuted.
2. ETH Is Not Valued by Fee Multiples
The market may not value Ethereum based on fee multiples. If it did, ETH’s price and fee multiple should move together to some degree. Conventionally, lower multiples imply more attractive entry points—not the opposite.
Ethereum’s fee multiple fluctuates wildly and tends toward high valuations. Since 2016, Ethereum has traded between 10x and 8,800x its fees. Since 2021, the range has narrowed to 20x–235x. Valuation multiples remain relatively high.
Ethereum exhibits traits of a productive asset, a commodity, and a store-of-value asset. Productive assets are valued on earnings multiples; commodities and stores of value are not. The difficulty in interpreting ETH’s valuation through fee multiples suggests ETH is viewed more as a store of value than a productive asset.
However, there’s a problem...
If ETH isn’t seen as a productive asset, why does its price react to expected fee increases?
Prices shouldn’t fluctuate much. After all, if ETH is purely a store of value, rising Ethereum fees should have little impact on its valuation.
But fees do affect price.
How much?
It’s hard to say. ETH’s price is influenced by many variables—macroeconomic conditions, regulation, competition. Determining which factor dominates is impossible.
In crypto—and especially Ethereum—fundamentals like fees matter. They reflect network health and outlook. For Layer 1 blockchains, however, fundamentals play only a partial role in valuation. Much of a blockchain’s value lies in its monetary properties: its ability to store and transfer value, and secure the network. Protocols and apps built atop Layer 1s rely more heavily on their productive asset characteristics.
Therefore, you cannot derive ETH’s price from trading multiples. Whether Ethereum’s multiple is “cheap” or “expensive” tells us little. But Ethereum’s fundamental metric—its fees—does drive price movements.
Join TechFlow official community to stay tuned
Telegram:https://t.me/TechFlowDaily
X (Twitter):https://x.com/TechFlowPost
X (Twitter) EN:https://x.com/BlockFlow_News