Ethereum Q2 2023 Data Research: $700 Million in Gross Profit, ETH Burn Rate Accelerates from 0.3% to 0.8%
TechFlow Selected TechFlow Selected
Ethereum Q2 2023 Data Research: $700 Million in Gross Profit, ETH Burn Rate Accelerates from 0.3% to 0.8%
With the successful implementation of the Shapella upgrade, which did not trigger an ETH sell-off, metrics across the Ethereum ecosystem—including Layer 2 networks—are growing comprehensively.
Written by: SAM ANDREW
Translated by: TechFlow
If we were to view Ethereum as a company, what kind of company would it be?
In Q2 2023, Ethereum had 340,000 daily active users, generated $700 million (453,000 ETH) in gross profit with an 84% gross margin, and achieved $420 million (227,000 ETH) in net income—a staggering 187% quarter-on-quarter growth.
Driven by strong network effects, the ETH burn rate accelerated from 0.3% to 0.8%. Following the successful Shapella upgrade, there was no sell-off of ETH. Instead, key metrics across the Ethereum ecosystem—including Layer 2 networks—are showing broad-based growth.
This article serves as an unofficial Q2 2023 data report on Ethereum, offering analysis and commentary across four main areas to help you fully understand Ethereum’s operational and financial performance from a data-driven perspective:
-
Ethereum's operational metrics;
-
The Ethereum ecosystem (including L2 metrics);
-
Ethereum’s income statement;
-
Key implications.
Q2 2023 Operational Metrics
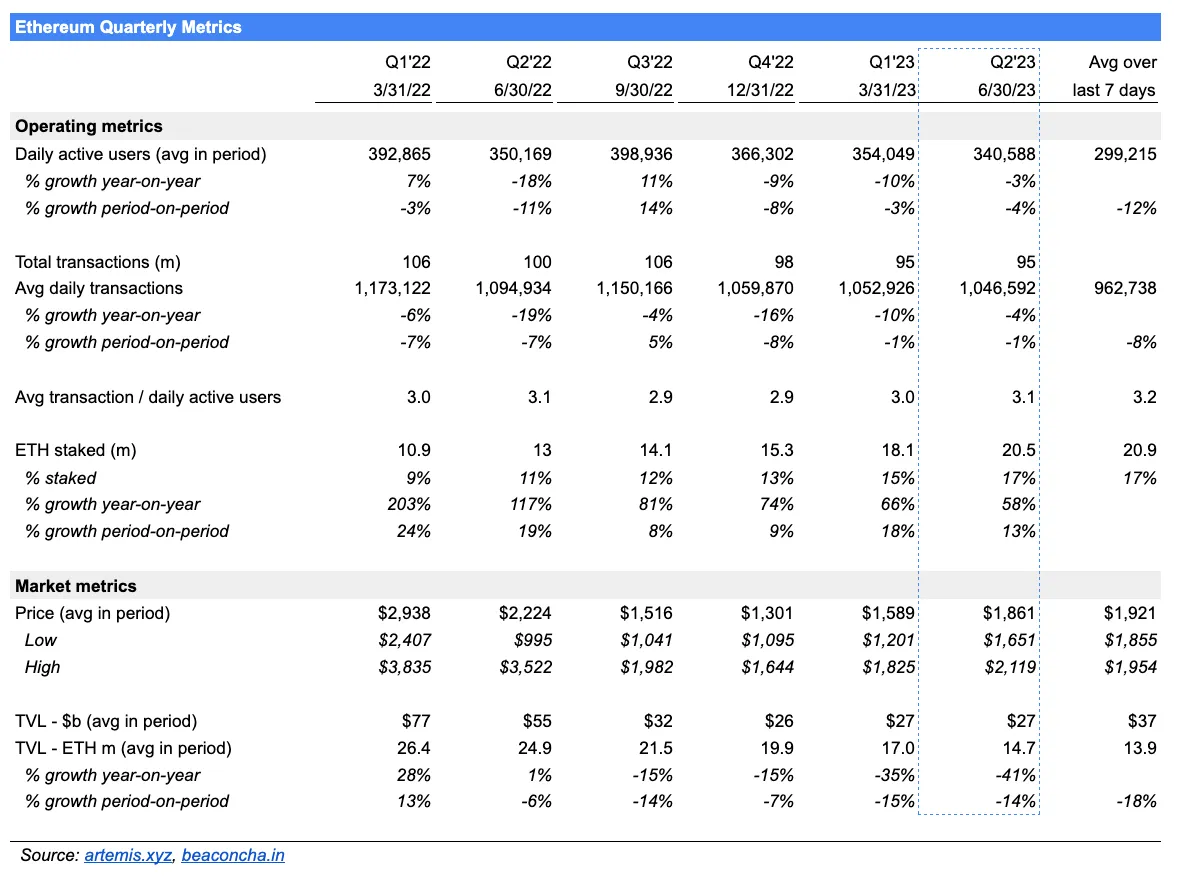
Daily Active Users (DAU): Q2 DAU stood at 340,588, down 3% year-over-year but improved compared to the ~10% decline seen in Q1 2023 and Q4 2022. In early July, average daily active users declined by 12% compared to Q2 levels. The drop in DAU indicates fewer people using Ethereum each day.
Average Daily Transactions: Average daily transactions reached 1,046,592, down 4% year-over-year. However, the rate of decline has slowed compared to previous quarters, stabilizing near -1%. The decline is primarily due to reduced daily active users. Average daily transaction volume showed a downward trend during the first week of July.
Staked ETH: Staked ETH accounts for 17% of total supply. The amount of staked ETH grew 58% year-over-year and 13% quarter-over-quarter.
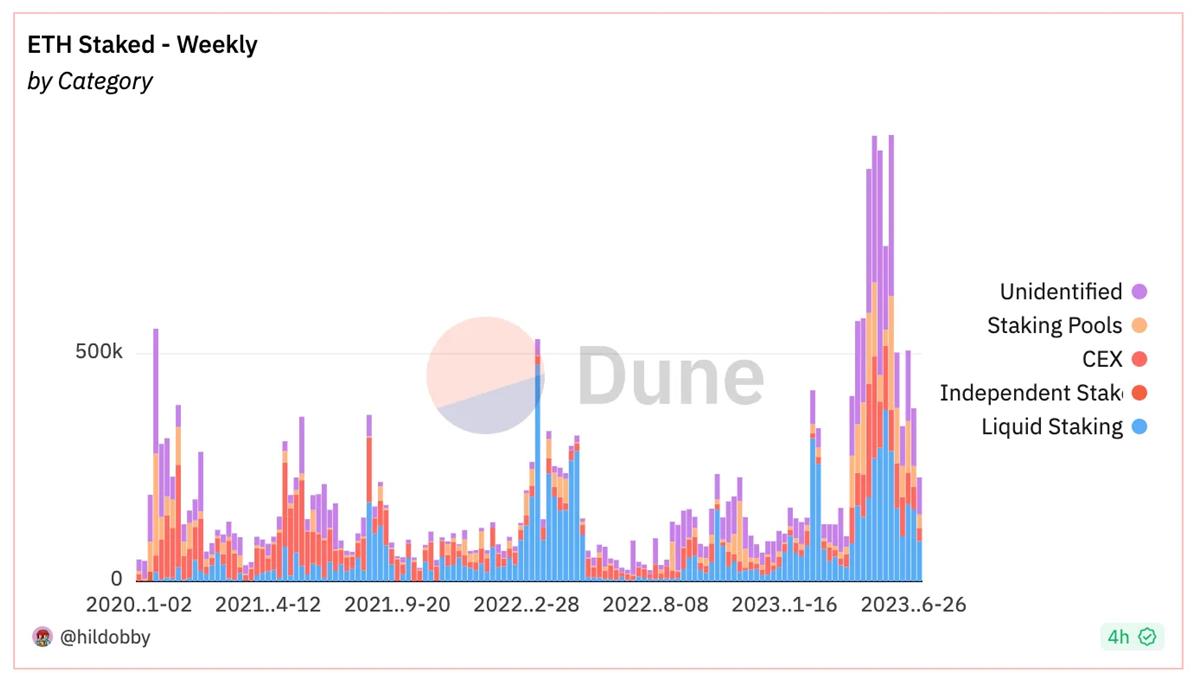
The Shapella upgrade was successfully executed on April 12, 2023. Contrary to some fears, ETH did not experience a sell-off post-Shapella.
The quantity of staked ETH continues to grow, but at a slowing pace. Weekly incremental deposits of ETH have declined both before and after Shapella (see chart below). Approximately 1.8 million ETH were staked in April, 4 million in May, and 2.2 million in June.
Price: The average price of ETH in Q2 was $1,861. Year-to-date, ETH is up 55%, with a quarterly gain of 4%. ETH experienced significant volatility during the quarter, dropping 22% from peak to trough before recovering.
Total Value Locked (TVL): TVL on Ethereum declined 41% year-over-year, with the downward trend continuing to worsen. This aligns with a 14% decline observed in Q1 2023.
The Ethereum Ecosystem
Ethereum’s health is increasingly assessed through the lens of its broader ecosystem, which includes Layer 2 scaling solutions. Arbitrum, Optimism, Polygon zkEVM, StarkNet, and zkSync Era are used to evaluate the health of Ethereum’s Layer 2 landscape. Activity has migrated to these L2s, which offer cheaper and faster transaction settlement. Evaluating the full Ethereum ecosystem—combining base layer and L2 activity—paints a different picture. Daily active users (DAU) and average daily transactions within the Ethereum ecosystem are growing.
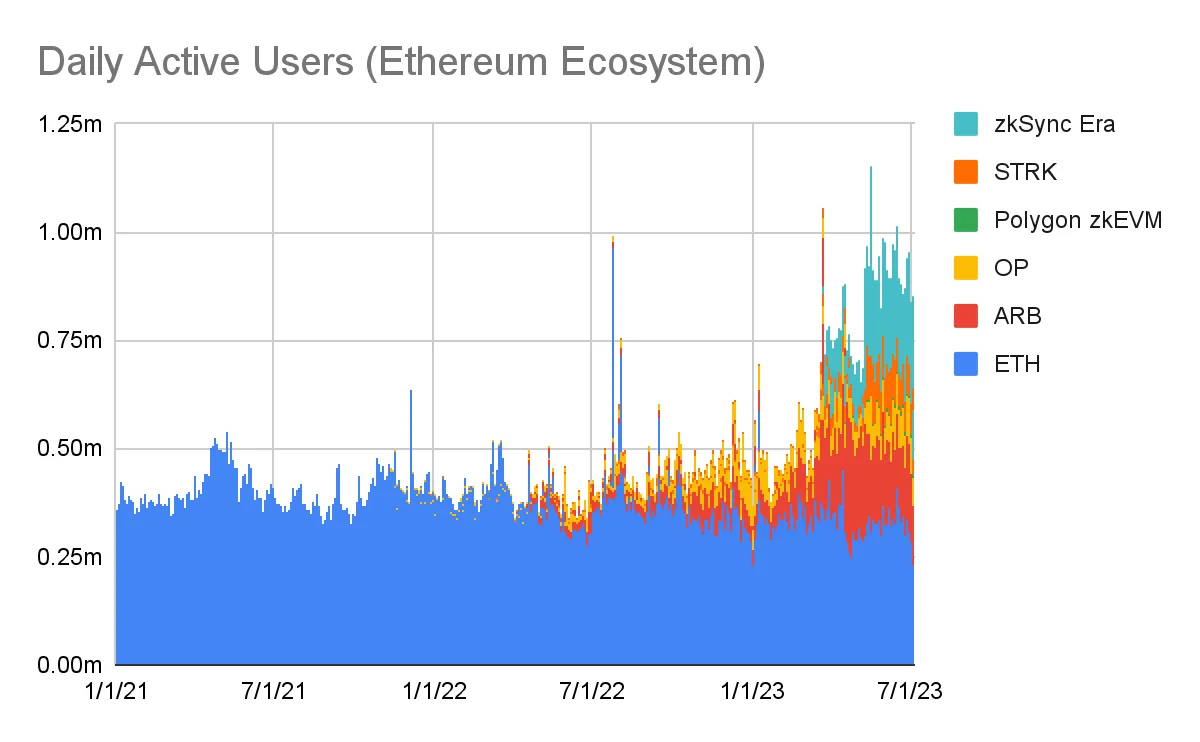
Since 2021, Ethereum’s standalone DAU growth has stagnated. Over the past year, however, DAU across the broader Ethereum ecosystem has doubled—from around 400,000 to nearly 800,000 (see chart above). That said, this increase doesn’t necessarily mean more unique individuals are interacting with the ecosystem. A more likely explanation is that many Ethereum DAUs are also becoming L2 DAUs.
Polygon PoS data is excluded from the Ethereum ecosystem. As a sidechain, Polygon PoS operates separately. However, users may gradually migrate to Polygon zkEVM, which is now the focus of Polygon’s development. Such migration could benefit the Ethereum ecosystem. Currently, Polygon PoS has 360,000 DAUs—more than Ethereum’s 300,000. But after migration, Ethereum’s DAU won’t simply double; a significant portion of Polygon PoS users are likely already active on Ethereum.
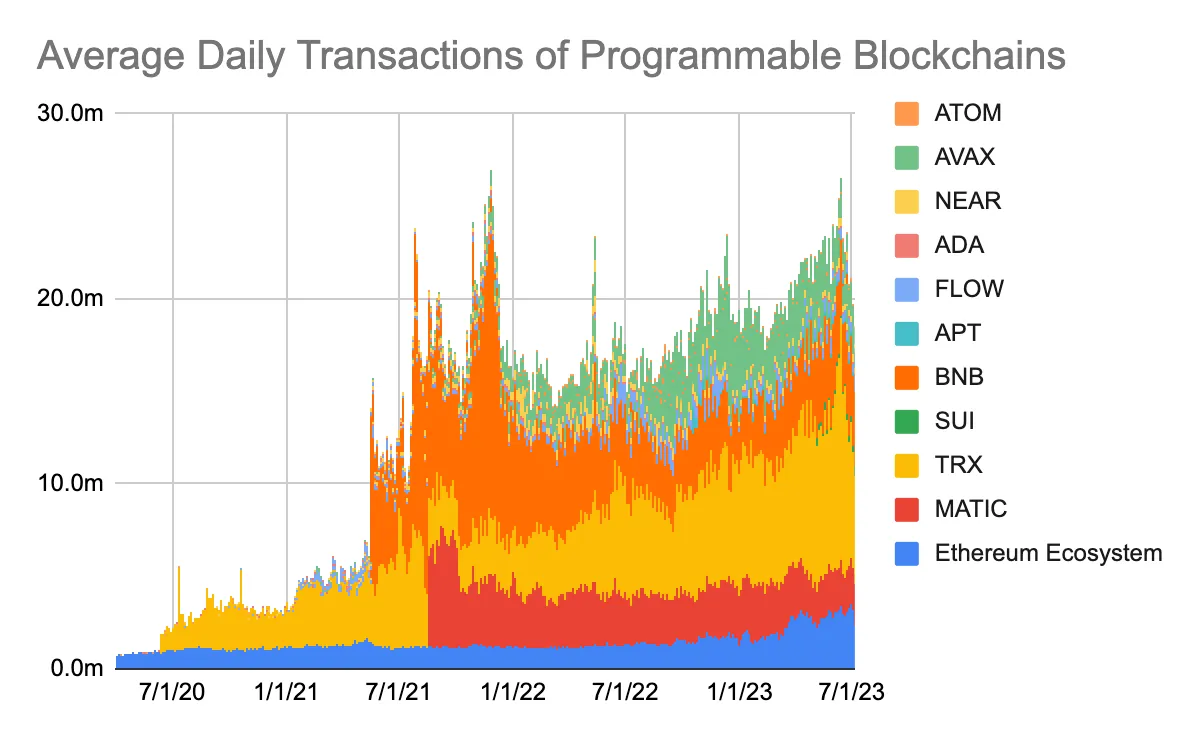
With the rise of Layer 2s, users in the Ethereum ecosystem are conducting more transactions. Since late 2020, Ethereum’s daily transaction count has hovered around 1 million—the network’s throughput limit. Layer 2s have collectively added another 2 million daily transactions. Total transaction volume across the entire Ethereum ecosystem has nearly quadrupled over the past year (see chart below). For every 1 transaction on Ethereum’s base layer, there are now 2 transactions on L2s.
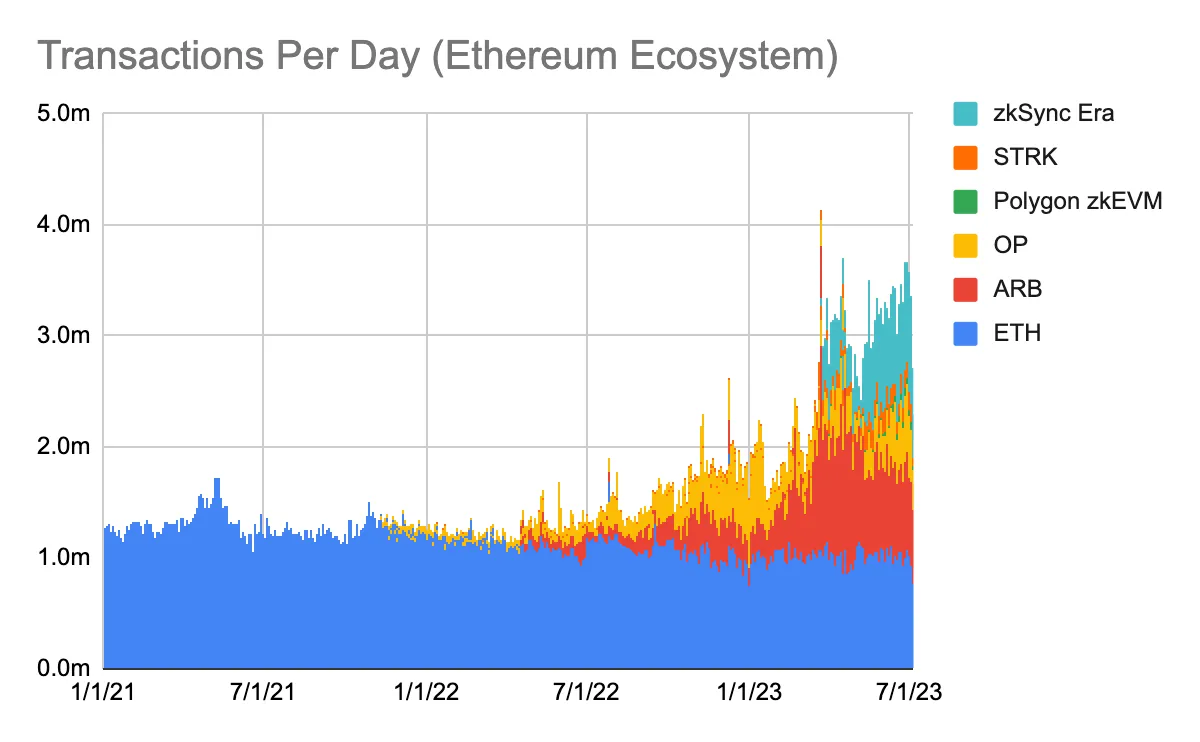
Polygon PoS averages 2.4 million transactions per day. If those transactions migrate to Polygon zkEVM or other Ethereum L2s, daily transaction volume across the Ethereum ecosystem would nearly double.
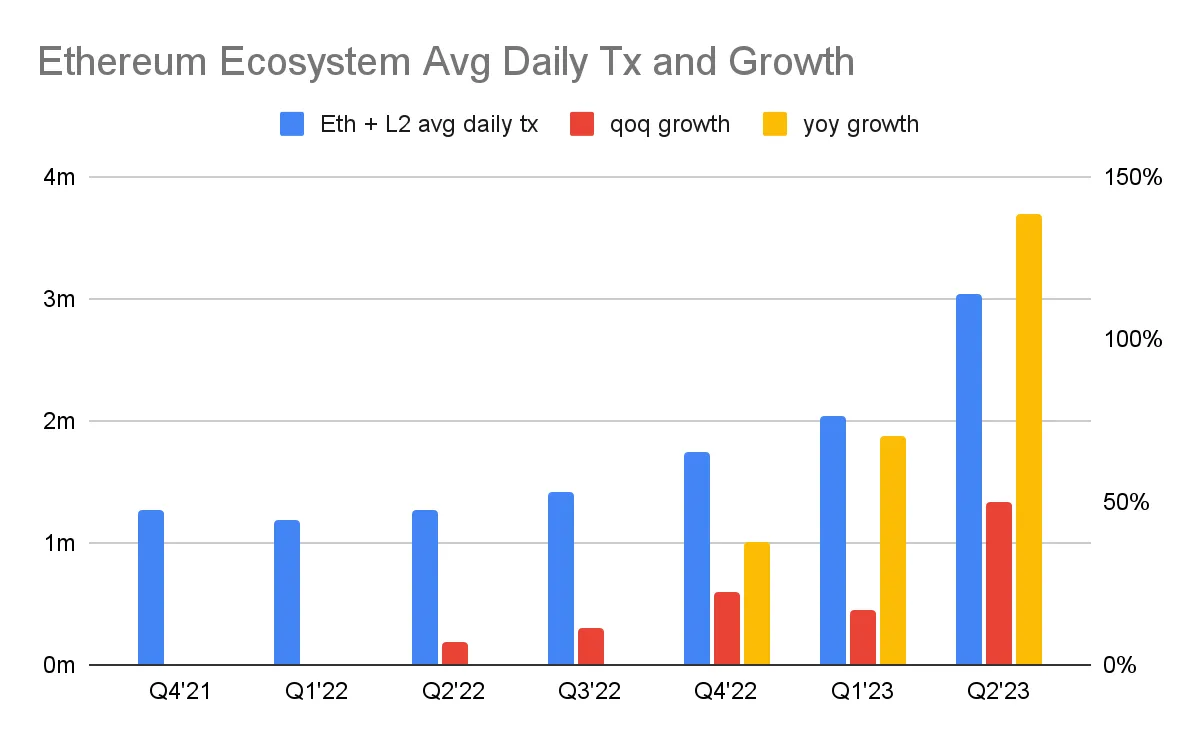
In Q2 2023, the entire Ethereum ecosystem averaged 3 million daily transactions, up from 2 million in Q1. The sequential growth rate in average daily transaction volume accelerated from 17% in Q1 to 50% in Q2. On a year-over-year basis, average daily transaction volume across the Ethereum ecosystem rose 139% in Q2 2023 (see chart below).
The Ethereum ecosystem accounts for 16% of daily transaction volume across all programmable blockchains excluding Solana (see chart below). Solana processes about 20 million transactions daily and is among the highest-performing blockchains. However, due to its high throughput and low fees, a large portion of its transactions are considered spam or bot activity.
If Polygon PoS were included, Ethereum’s share of total transaction volume would double to approximately 30%. Excluding BNB Chain and Tron—which differ significantly in their centralized nature—Ethereum dominates 60% of daily transaction volume.
Ethereum’s Income Statement
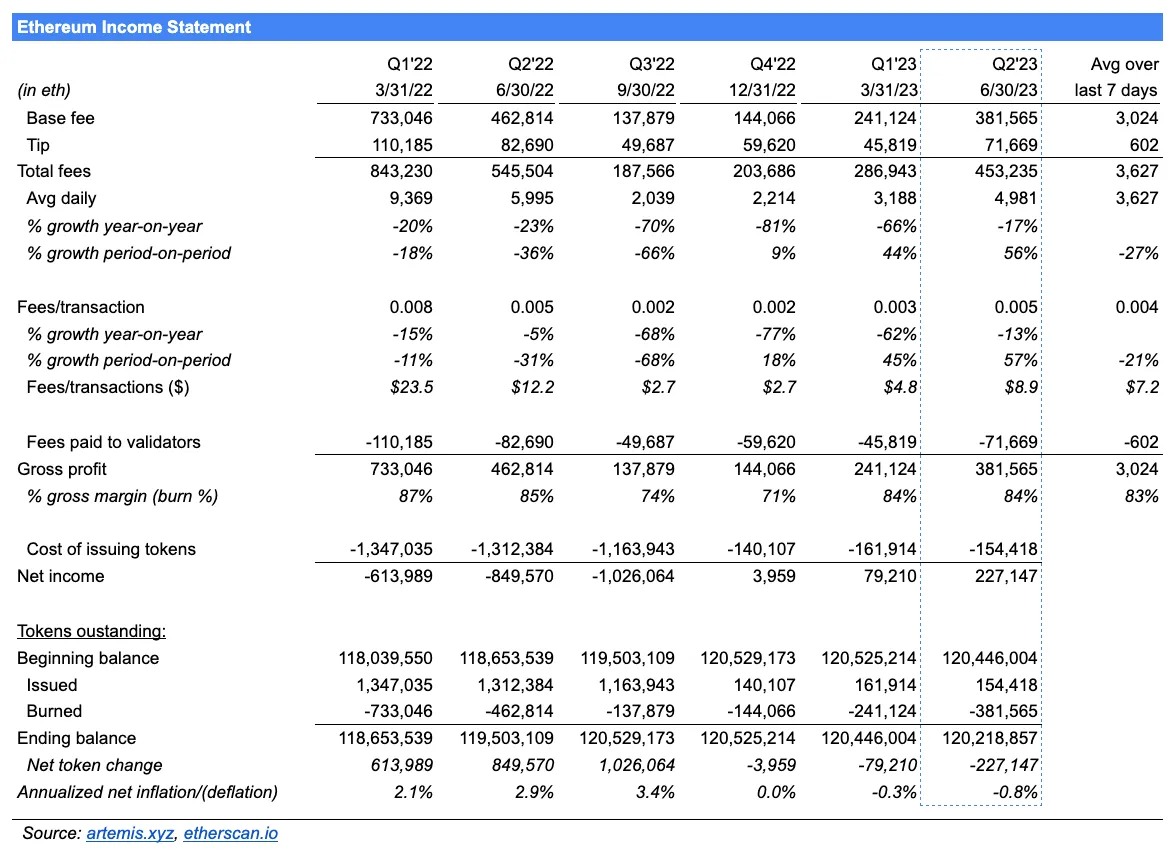
Total Fees: Total fees in Q2 amounted to 453,235 ETH ($843,470,335), down 17% year-over-year due to a 13% decrease in transaction fees and a 4% decline in transaction volume. However, total fees rose 56% quarter-over-quarter, driven by a 57% increase in average fee per transaction despite a 1% drop in volume. Total fees represent the aggregate cost paid by users to execute transactions on Ethereum. In traditional financial terms, this is equivalent to the “company’s” total revenue.
Gross Profit: Gross profit reached 381,565 ETH ($710,092,465), resulting in a gross margin of 84% for the quarter—meaning 84% of total fees were burned. Gross profit is often referred to as “network revenue.” It captures the portion of fees accrued to token holders. Gross profit grew in line with total fees on a year-over-year basis.
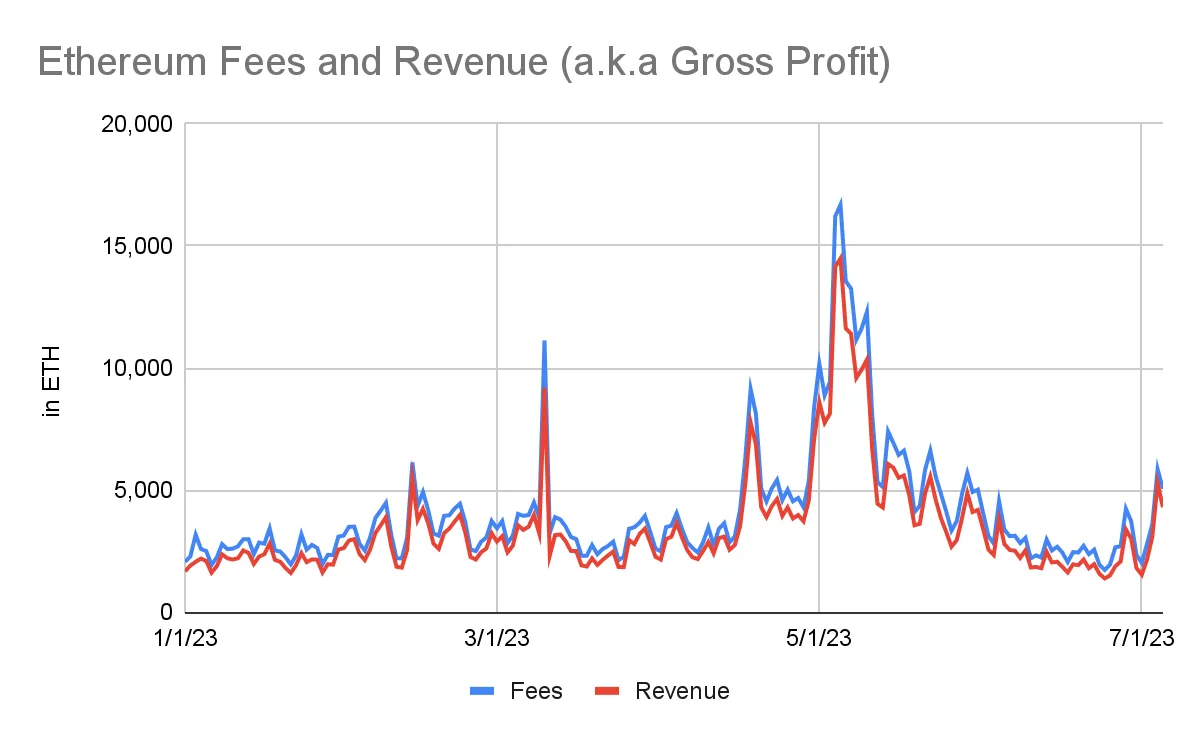
Daily fees and gross profit (i.e., revenue) tripled in May (see chart below), fueled by meme coin mania led by Pepe. Afterward, fees and gross profit returned to baseline levels. Absent another one-time fee driver, fees are expected to decline quarter-over-quarter in Q3 2023. During the first week of July, average daily fees were down 27% compared to the Q2 average.
Net Income: Net income in Q2 reached 227,147 ETH ($422,720,567)—a nearly threefold increase quarter-over-quarter. This surge was driven by the 56% rise in total fees. The outsized growth in net income demonstrates Ethereum’s operating leverage: costs do not scale with revenue. While total fees increased by 56%, Ethereum’s fixed cost—the issuance of new tokens to validators—declined by 5% quarter-over-quarter. As a result, net income surged 187%.
Ethereum has been profitable every quarter since transitioning to Proof-of-Stake. The dramatic improvement in profitability stems from a 90% reduction in issuance costs.
Pending Issuance: In Q2 2023, Ethereum burned more tokens than it issued. The pending issuance balance decreased from 120.45 million to 120.22 million. Annualized net issuance (net issuance divided by starting balance) fell from low single-digit percentages to -0.8%. In 2022, Ethereum increased its circulating supply by about 3%. Now, it is reducing supply by approximately 1% annually.
How to Interpret Ethereum’s Income Statement?
Total fees represent the cost users pay to publish transactions on the Ethereum blockchain. These fees consist of base fees and tips. Tips are transferable fees paid directly to validators. Note that the tip line item equals the payment to validators—it represents a variable cost that scales proportionally with usage. Users pay tips to prioritize their transactions.
Base fees are the core cost of processing transactions. Importantly, the base fee number matches the gross profit figure. Gross profit reflects how much value Ethereum earns from processing transactions, denominated in ETH. It is sometimes called “network revenue.” The gross margin shows what percentage of total fees is burned. Burned tokens are permanently removed from circulation—similar to stock buybacks.
Issuance cost refers to the amount paid to validators to secure the network. This is a fixed cost and does not scale with usage.
Net income is the difference between base fees (i.e., gross profit) and newly issued tokens. In Q2 2023, Ethereum’s net income of 227,147 ETH means it collected 227,147 more ETH in base fees than it issued to validators. Consequently, the total supply of pending issuance decreased by 227,147 ETH.
The more net income Ethereum generates, the more ETH is burned, and the lower the pending issuance becomes. All else equal, lower issuance increases the value of each remaining token.
Conclusion
1. The Q2 Surge in Total Fees Was Temporary
The spike in total fees and associated ETH burning in Q2 was temporary, driven by a one-off event—meme coin mania. This surge lasted only about two weeks. Q3 2023 is expected to show weaker quarter-over-quarter performance.
2. Focus Shifts to Layer 2 Solutions
Operational metrics of the broader Ethereum ecosystem—including Layer 2 solutions—show a healthy, growing network. In contrast, Ethereum’s standalone metrics suggest stagnation. Growth is being driven by Layer 2s, whose success is critical to Ethereum’s future. The upcoming EIP-4844 upgrade will have a major impact on both L2s and Ethereum itself.
In the short term, the only way to increase Ethereum’s revenue is by raising per-transaction fees—higher gas prices. Currently, Ethereum caps at roughly 1 million transactions per day. However, Layer 2 transactions are expected to grow substantially. These transactions will be batched into a single input on Ethereum’s base layer, allowing the cost of one expensive Ethereum transaction to be shared among many L2 users.
3. Growth in Staked ETH Slows Down
Growth in staked ETH surged before and immediately after the successful Shapella upgrade. However, the recent slowdown suggests that staking may not exceed 50% as quickly as previously anticipated. Reaching a 50% staking ratio would require an additional 40 million ETH to be staked. At the current pace of ~1 million ETH staked monthly, it would take 40 months—or 3 years and 4 months—to reach that threshold.
This slowdown isn’t necessarily negative for ETH stakers. A lower staking ratio implies higher staking rewards for validators—and thus higher ETH yields. ETH yield comprises staking returns, MEV rewards, and inflation/deflation dynamics of the token supply. The most economically attractive scenario is low staking ratio (high staking rewards) combined with high fees (high yield). The opposite is less favorable. However, economic incentives aren’t the only factor influencing ETH’s value. Higher staking ratios enhance blockchain security, which could theoretically support a higher ETH valuation.
The slowdown in staked ETH growth has hurt Lido and Rocket Pool. This quarter, LDO and RPL dropped 17% and 18% respectively, while ETH remained flat. Slower staking growth combined with Rocket Pool’s smaller mini-pool size has led to fewer RPL buyers.
4. Operating Leverage Drives Massive Burns
Ethereum’s profitability and burn mechanism are critically important. Ethereum shifted from a daily $22 million sell pressure (at $1,860 ETH price) to a daily $5 million buy-side demand—an effective swing of $28 million. This $28 million shift represents 4.5% of Ethereum’s market cap.
Ethereum’s old Proof-of-Work model had two economic flaws. First, it issued 17,000 ETH daily to miners—equivalent to a 5% annual dilution rate. Second, an estimated 70% of these tokens were immediately sold to cover costly mining operations. At $1,860 per ETH, this created $22 million in daily sell pressure.
The shift to Proof-of-Stake and the introduction of the burn mechanism transformed $22 million in daily sell pressure into $5 million in daily buy pressure. Ethereum now burns (i.e., buys back) $5 million worth of tokens daily, whereas previously it sold $22 million worth of ETH. The table below outlines the projected income statement shift from PoW to PoS.
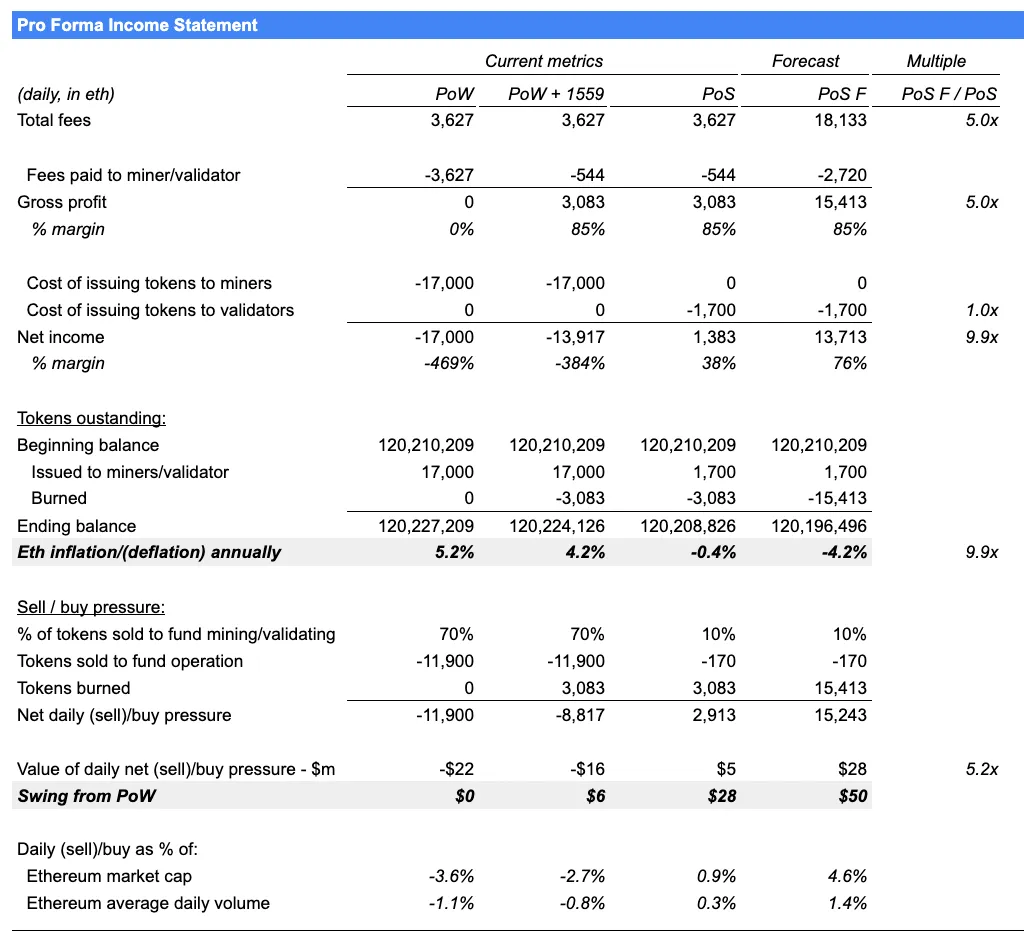
Most people misunderstand Ethereum’s operating leverage. Operating leverage is a traditional finance concept describing assets where profits grow much faster than revenue. Profits grow sharply because operating costs remain flat while revenue increases. Technologists often fail to grasp operating leverage, just as traditional finance investors often fail to understand crypto.
The “Projected” column in the chart above illustrates Ethereum’s operating leverage. It assumes a 5x increase in total fees. With fees up 5x, net income grows 9.9x. Why? Because Ethereum’s fixed operating cost—issuance to validators—does not increase with usage. The result is a 9.9x increase in Ethereum’s deflation rate. Compared to today’s 0.4% annual contraction, a 5x revenue increase would reduce pending issuance by 4.2% annually. Buy-side pressure would rise 5.2x—from $5 million to $28 million per day.
Join TechFlow official community to stay tuned
Telegram:https://t.me/TechFlowDaily
X (Twitter):https://x.com/TechFlowPost
X (Twitter) EN:https://x.com/BlockFlow_News