VanEck Ethereum Valuation Report Full Text: ETH Approaching $12,000 by 2030
TechFlow Selected TechFlow Selected
VanEck Ethereum Valuation Report Full Text: ETH Approaching $12,000 by 2030
VanEck, a traditional institution that once managed a $69 billion ETF, predicts that by 2030, one ether will be worth $11,800.
Authored by: Matthew Sigel, Patrick Bush
Translated and compiled by: BlockTempo
VanEck, an asset management firm based in New York City, was founded in 1955 and is one of the world's leading investment management companies. It operates across a wide range of asset classes including equities, bonds, commodities, gold, and emerging markets. In 2020, it managed approximately $69 billion in ETFs.
Recently, the firm released a valuation report on Ethereum, forecasting ETH’s price in 2030. They estimate that under normal conditions, ETH could reach $11,800. Below is the full report:
ETH Could Become a Competitor to U.S. Treasuries
Given Ethereum’s recent hard fork, which allows users to withdraw staked Ether (ETH), we believe this positions Ethereum as a significant competitor to U.S. Treasuries. We have re-evaluated Ethereum using a more rigorous valuation model.
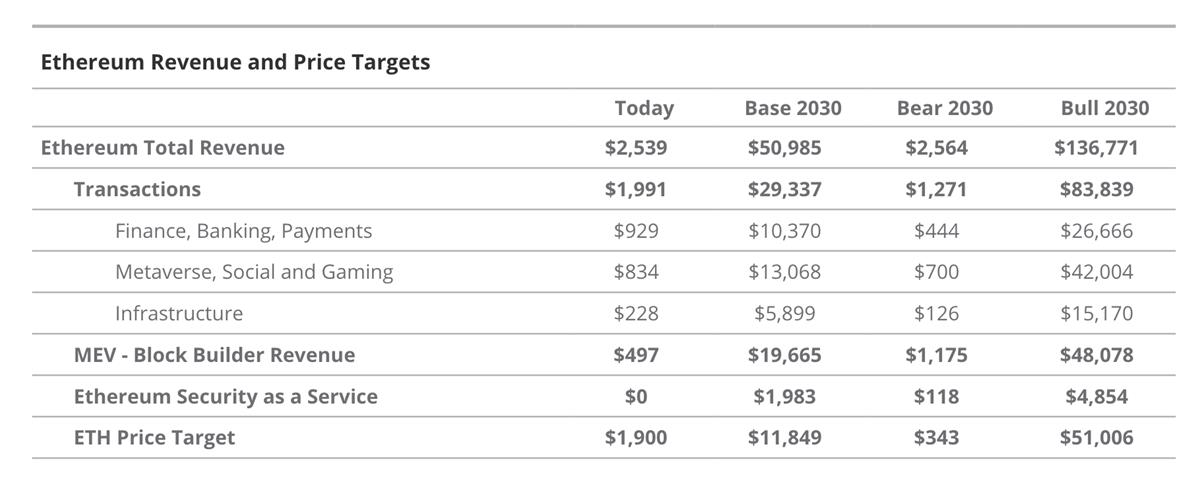
According to our estimates, Ethereum network revenue will grow from $2.6 billion annually today to $51 billion by 2030.
Assuming Ethereum maintains a 70% market share in smart contract protocols, this implies an ETH price of $11,800 in the 2030s. Discounting this back to today at a 12% cost of capital—derived from Ethereum’s historical volatility—gives us a present value of $5,300.
Discounted cash flow (DCF) is a financial concept used to assess the value of future cash flows. In valuation models, future cash flows are considered less valuable than the same amount received today due to risks and uncertainties. DCF adjusts future cash flows to their present value, reflecting both time value and risk.
This analysis provides a clear valuation methodology for Ethereum, incorporating transaction fees, MEV (Maximal Extractable Value), and "security-as-a-service." We evaluate Ethereum’s market share in key sectors and its potential as a store-of-value asset within the evolving cryptocurrency landscape.
Ethereum Valuation Methodology: Cash Flow Projections and FDV Calculation
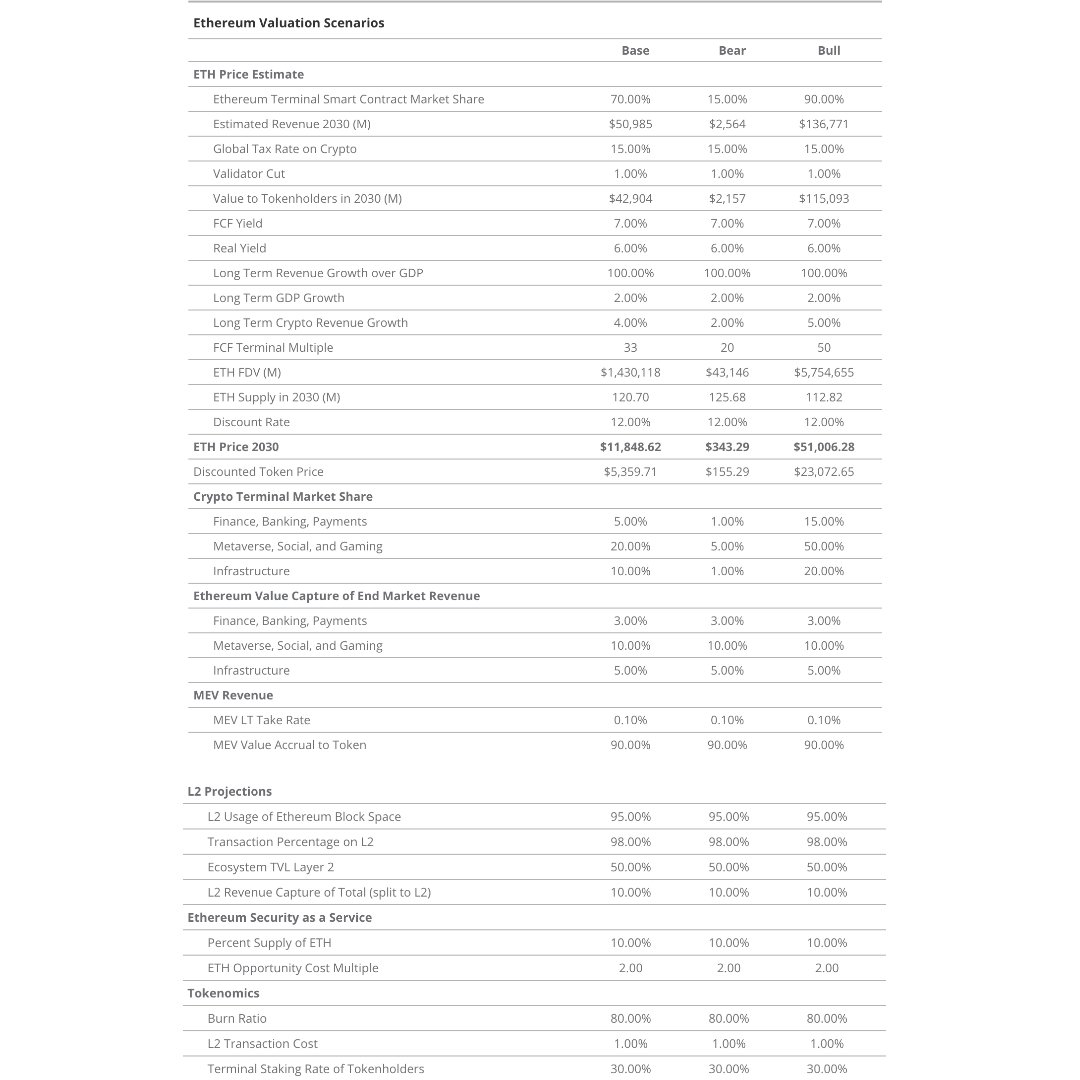
We assess Ethereum’s value by estimating cash flows for the year ending April 30, 2030. We forecast Ethereum’s revenue, subtract global tax rates and validators’ share of income, arriving at a free cash flow figure.
Then, we apply a terminal growth rate by taking the long-term expected cash flow yield (7%) minus long-term crypto growth (4%). This gives us Ethereum’s fully diluted valuation (FDV) in 2030. Dividing this by the expected number of circulating tokens and discounting back to April 20, 2023, at a 12% discount rate yields today’s valuation.
Macro View of Ethereum’s Business Model: Digital Mall, Validators, and On-chain Commerce
To properly understand our valuation approach for Ethereum, it's essential first to grasp what Ethereum is, how it works, and where its value lies.
Imagine Ethereum as a Digital Mall
At its most basic level, think of Ethereum as a digital mall existing on the internet—a secure venue for online commerce. Users interact within this mall via wallets, and the mall itself is composed of layers of smart contract code.
Ethereum’s software defines the structure and rules of the mall, while validators ensure these rules are followed, protect security, and maintain the ledger recording all economic events within the mall. Ethereum allocates limited space inside the mall by charging users fees for conducting business and exchanging value.
The Role of Validators
Computers running Ethereum software are called validators. They receive inflationary rewards and a portion of fees paid by users conducting activities on Ethereum.
To execute value transfers or interact with on-chain businesses, users must pay fees to Ethereum. These fees correlate with computational intensity and demand on the network. Interestingly, unlike traditional enterprises that bear costs like rent and electricity, users directly pay these operational expenses through transactions—making Ethereum both the host and primary supplier of on-chain services.
Thus, users fund the hosting and computing costs of on-chain operations through transaction fees, meaning on-chain businesses effectively pay their own operating expenses via Ethereum.
On-Chain Commerce
To do anything on Ethereum, users must use ETH tokens. Additionally, validators must stake ETH as collateral for honest behavior. If a validator cheats, their ETH is slashed.
Since ETH is the currency validators sell to cover costs, this links demand and supply—Ethereum users buy ETH to use the network, while validators sell ETH to “supply” Ethereum. What does “supplying Ethereum” mean? Essentially, it means participating in Ethereum’s consensus mechanism, validating transfers, deploying smart contracts, or enabling calls to Ethereum’s software.
All business logic and asset exchanges are recorded as ledger entries in blocks. Blocks are simply Ethereum’s computerized “to-do list,” executed every twelve seconds. Users pay base fees and priority fees (tips) to get their actions included in a block. When demand for block space is high, users can increase tips to prioritize their transactions.
Moreover, Ethereum creates a market for auctioning transaction ordering rights within each block. This is because there is substantial value in controlling transaction sequence. These two functions represent Ethereum’s core business—selling block space and selling the right to order transactions within that space. In short, Ethereum sells secure, immutable block space to facilitate network commerce.
Ethereum Revenue: Transaction Fees, MEV, and Security-as-a-Service
Transaction Fees
Since Ethereum isn’t a traditional company, we define revenue as token usage tied to its core business: providing immutable, decentralized computation via block space sales. Therefore, we treat transaction fees—including base fees and tips—as revenue items. Some analysts only count base fees (which are burned, affecting all ETH holders) and ignore tips (paid solely to proposer validators).
In their view, only staked ETH earns tips. However, we include both base fees and tips because they both reflect economic activity related to block space sales. Thus, this value accrues to Ethereum as an economic entity.
Additionally, we subtract burned ETH from base fees and account for reduced total supply when assessing token value. Admittedly, unlike other components in our model, ETH usage significantly impacts current token valuation through supply contraction. Furthermore, we do not treat inflationary issuance as revenue, as it is not directly linked to external entities purchasing block space.
MEV
Beyond transaction fees, we explicitly recognize MEV as a revenue stream for ETH. For example, entities like Flashbots auction block space to builders, and part of MEV accrues to ETH stakers via validators. Similar to validator tips, we consider block-building fees part of Ethereum’s revenue since they stem from block space monetization.
Security-as-a-Service (SaaS)
In our model, due to Ethereum’s programmability and maturing cross-chain messaging, we introduce a novel revenue category called “Security-as-a-Service” (SaaS).
Conceptually, ETH’s value can be used inside and outside Ethereum to secure applications, protocols, and ecosystems. With projects like Eigenlayer, ETH can support entities such as oracles, sequencers, validators, bridges, and even undiscovered future constructs.
As a result, ETH becomes analogous to Layer 0 assets like Bitcoin, Polkadot’s DOT, or Cosmos’s ATOM—assets capable of bootstrapping new blockchains. Since ETH is a holding asset, it can be locked behind guarantees for specific protocols or ventures, ensuring honest behavior. If misconduct occurs, this value can be seized to penalize bad actors and/or compensate affected parties. This functions like performance bonds or collateral, ensuring victims can recover losses while malicious actors bear consequences.
Looking ahead, this business model depends on ETH’s token value and Ethereum’s software security and longevity. Therefore, given Ethereum’s ability to export security, SaaS participants should earn a multiplier over the sum of priority fees, tips, block-building fees, and inflationary rewards—the opportunity cost and risk borne by ETH holders. This multiplier reflects average security and investment risk associated with locking up ETH as a guarantee.
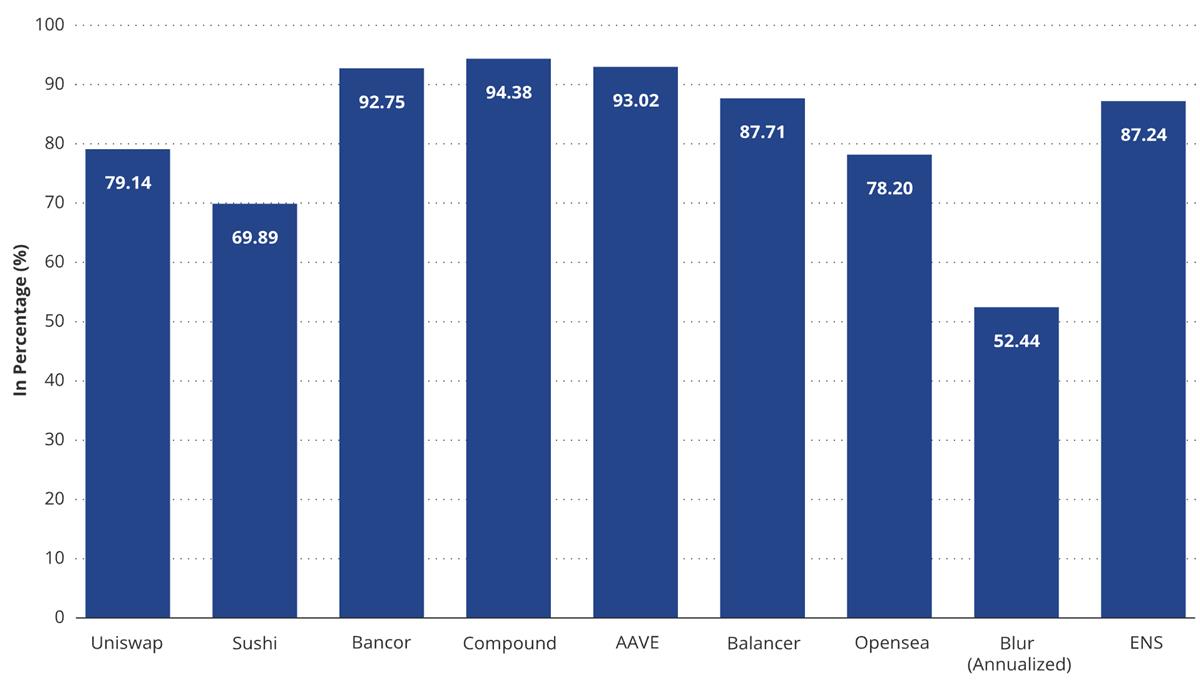
Annual Share of Total User Fees Going to On-Chain Businesses
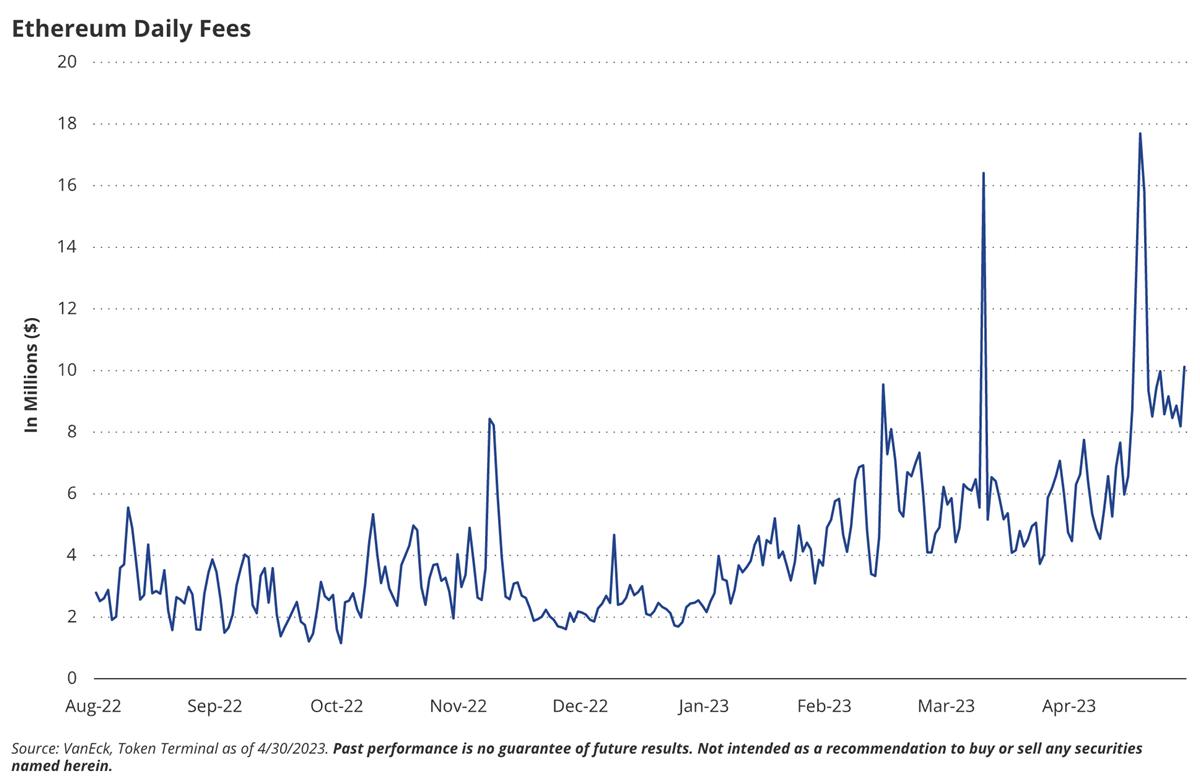
Source: VanEck, Token Terminal, as of April 30, 2023. Past performance is not indicative of future results. This article does not constitute a recommendation to buy or sell any securities mentioned.
From the chart above, we infer that over the past year, AAVE users split costs between the platform and application at 6.98% to the platform (Ethereum) and 93.02% to AAVE (the app and its lenders). Regarding value accrual for platforms like Ethereum, we expect this dynamic to shift over time as off-chain businesses migrate on-chain to reduce costs and unlock new revenue streams. In our model, we assume application fee shares will vary between 90% and 97% depending on end markets, while Ethereum’s share across business categories will range from 3% to 10%.
We believe approximating this fee split is necessary because “transaction revenue” is not an ideal framework for describing future blockchain value capture. As previously noted, transactions are merely Ethereum’s computational “to-do list,” and many blockchain uses cannot be neatly described as “transactions.” For smart contract platforms like Ethereum, block space is a more accurate unit for measuring and describing the product sold.
Smart contract blockchains could package block space into “service-level agreements” offered to third parties, guaranteeing certain levels of current or future computational or transaction throughput. This would create complex, liquid futures markets for block space, similar to commodity derivatives. However, to align with current conventions, we retain the term “transaction revenue.”
To project future ETH supply reductions, we start with historical ETH burn-to-fee ratios, assuming 80% of transaction fees are burned. We estimate average transaction costs across Ethereum and Layer 2 platforms, projecting a ~60% decline. We speculate L2 cost differences will be about 1/100th of Ethereum’s.
Next, we calculate Ethereum’s future monthly active users (MAU) based on terminal market MAUs and Ethereum’s penetration rate. Ethereum’s user share depends on its extraction rate from underlying economic activities (between 5% and 20%, depending on the end market).
We do not project transactions and derive revenue from them. Instead, we assume Ethereum’s transaction costs gradually decrease and forecast annual burn volumes from base fee destruction. This burned amount is subtracted from Ethereum’s total circulating supply, significantly impacting token value as the market cap is distributed over fewer tokens.
MEV Revenue: Transaction Ordering, On-Chain Activity, and Long-Term Forecasting
MEV is often seen as a “villain” in blockchains, with many entities trying to eliminate it. In reality, MEV can be mitigated but not eradicated. We believe MEV plays a crucial long-term role in securing blockchain safety (by rewarding validators and stakers), given its inherent value.
Its persistence resembles shelf space in supermarkets—there will always be premium spots (e.g., “eye-level” shelves) worth paying for, even at others’ expense. Similarly, transaction ordering has intrinsic value, and monetizing it unlocks significant economic gains.
Because MEV correlates strongly with on-chain activity, it is difficult to predict. For our estimates, we assume MEV scales directly with the total value of assets secured on Ethereum. This gives us a “management fee” proportional to value held on Ethereum.
Currently, we estimate MEV’s annual value at approximately 2.0% of Ethereum’s total locked value (TVL—not all on-chain assets). Long-term, we assume MEV’s share will shrink as protocols take steps to minimize its impact, on-chain asset turnover declines, and apps return some value to users.
Thus, we project MEV will fall to 0.15%. We assume total on-chain asset value correlates with overall blockchain-hosted assets, derived from Ethereum’s share of retained FBP and market dominance.
L2 Settlement Dynamics: Scaling Solutions, Revenue Distribution, and Future Profit Outlook
Since L2 settlements represent the long-term scaling solution for executing transactions on Ethereum, they are considered one of Ethereum’s most critical future revenue streams.
L2 settlements involve batches of transactions submitted to Ethereum. We model settlement revenue as a function of L2 income and the profit margin remaining after paying security costs to Ethereum. In our model, L2 revenue consists of MEV and transaction fees, both estimated using Ethereum’s framework.
We assume L2s pay a portion of this revenue as security fees to Ethereum. We observe L2 “profit margins” ranging from 15% to 40%, depending on Ethereum’s gas costs.
Long-term, we assert most L2 revenue—including MEV—will ultimately accrue to Ethereum. We make this assumption because we expect thousands of L2s to compete for Ethereum’s block space and profits. We project L2s’ long-term profit margin to be 10%, down from the current 15–40%. This estimate is admittedly arbitrary, but we anticipate fierce competition among chains for Ethereum’s block space will severely compress L2 profitability.
Regarding value distribution, we assume 98% of transactions occur on L2s, while 50% of total asset value remains on L2s. Nevertheless, we assert Ethereum will still host half the ecosystem’s value, as certain assets and transactions may require the highest levels of security, composability, and atomicity.
Ethereum’s Emerging Security Services Model
We define Ethereum’s SaaS business as revenue earned by exporting ETH’s value to secure external ecosystems, apps, and protocols. This is a rapidly growing yet highly unpredictable use case for ETH. To estimate how much ETH might be used for security services, we examine historical cross-chain asset movements. Currently, only 0.47% of ETH has been bridged to other networks,
and Atomized off-chain supply is around 0.5%. Historically, wrapped Bitcoin exported to other chains peaked at 1.7%, and during peak bridge activity, over 15% of Ethereum’s USDC supply was moved off-chain. As a starting point, we assume 10% of ETH will be used to provide off-chain security, earning a 2x premium over on-chain ETH due to risk exposure.
Ethereum Price and Revenue Targets: Base, Bear, and Bull Scenarios
In our base case, we assume Ethereum achieves $51 billion in annual revenue by April 30, 2030. After deducting 1% for validator expenses and a 15% global tax rate, we arrive at $42.9 billion in free cash flow. Applying a 33x free cash flow multiple and assuming 120.7 million tokens in circulation, we derive a 2030 price target of $11,848 per token. To determine today’s value, we discount this at 12%, despite calculating an 8.74% discount rate via CAPM. We use a higher rate to reflect increased uncertainty around Ethereum’s future. Thus, our discounted present value in the base case is $5,359.71.
CAPM stands for Capital Asset Pricing Model, a framework for estimating the relationship between risk and expected return in capital markets. Based on portfolio theory, CAPM assumes investors require compensation proportional to the risk they take when investing.
We base these estimates on the view that Ethereum will become the dominant open-source global settlement layer, hosting the majority of commercial activities with the greatest potential to benefit from migrating business functions to public blockchains. Among competing smart contract platforms, we assume Ethereum holds a dominant position likely to capture most of the market.
Join TechFlow official community to stay tuned
Telegram:https://t.me/TechFlowDaily
X (Twitter):https://x.com/TechFlowPost
X (Twitter) EN:https://x.com/BlockFlow_News