









Web3 "Company" Revenue Rankings: Where Does Value Capture Come From?
TechFlow Selected TechFlow Selected
Web3 "Company" Revenue Rankings: Where Does Value Capture Come From?
Spare no effort to deeply explore on-chain revenue.
 Navigating Web3 tides with focused insights
By: FM Research Team
TLDR; Conclusion:
(1) Total Revenue: Web3 business models have evolved significantly, with “selling block space” remaining the most powerful, followed by NFT marketplaces, DeFi, GameFi, and infrastructure.
(2) Protocol Revenue: Most revenue is still generated by supply-side participants such as Liquidity Providers and Lenders. Actual protocol-level earnings (Protocol Revenue) remain minimal, and even less flows to Token Holders. While users enjoy staking rewards and governance rights, core economic benefits are still not guaranteed.
(3) Protocol Revenue has auditing loopholes, posing risks to Token Holders: Risk provisioning within Protocol Revenue is often unaccounted for. Protocol revenue data is frequently conflated with token sale proceeds, and in some cases, hides potential Rug Pull risks.
1. Overview of Web3 Company Revenues
1.1 These Web3 Companies (Protocols) Generate the Highest Revenue
Revenue is one of the most critical metrics across all companies. So, are Web3 companies actually generating revenue? Currently, the most credible data comes from Token Terminal, while The Block, Messari, and Web3 Index also provide partial datasets. Unfortunately, no single source comprehensively covers the entire market. We combine these four sources to deliver our exclusive analysis. Due to missing on-chain data, certain figures may contain minor inaccuracies, which we aim to refine over time.
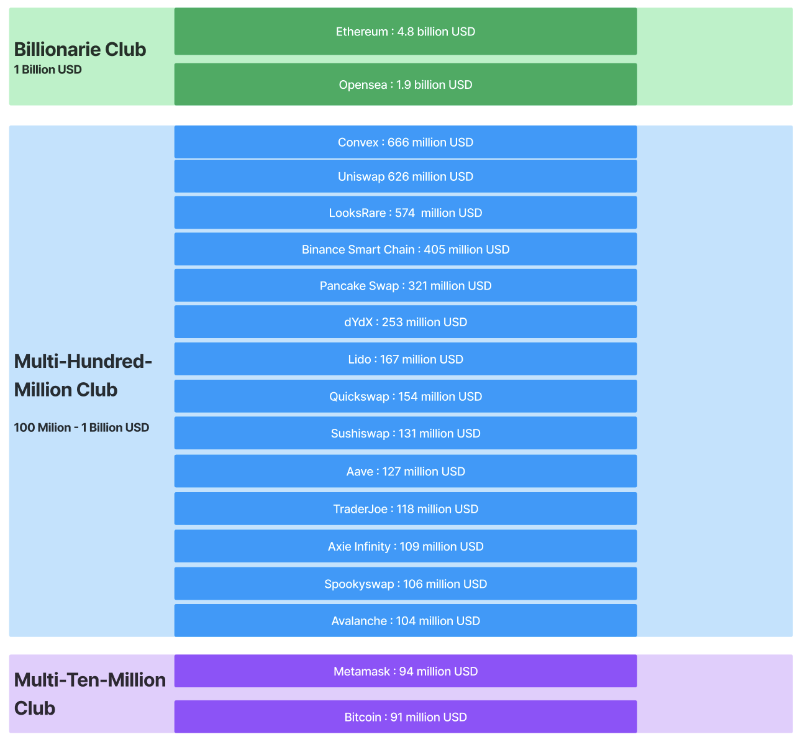
(Figure 1) Top 17 protocols by total revenue over the past 180 days
Since Web3 revenue depends heavily on market volatility, we use a 180-day window (non-annualized) for measurement. The top 17 protocols collectively generated over 10 billion USD in total revenue.
● Tier 1: Ethereum and OpenSea — Ethereum leads the list with $4.6 billion in six-month revenue; OpenSea follows with approximately $1.8 billion, making it an extraordinary cash cow.
● Tier 2: Mostly DeFi protocols. Convex and Uniswap lead in total revenue, each earning around $600 million over six months.
● Tier 3: Most notably Metamask, the leading tooling product, with $81 million in revenue over six months.
1.2 Does Business Model Determine Revenue Ceiling?
We analyzed the composition of total revenue above to assess how much impact business models have.
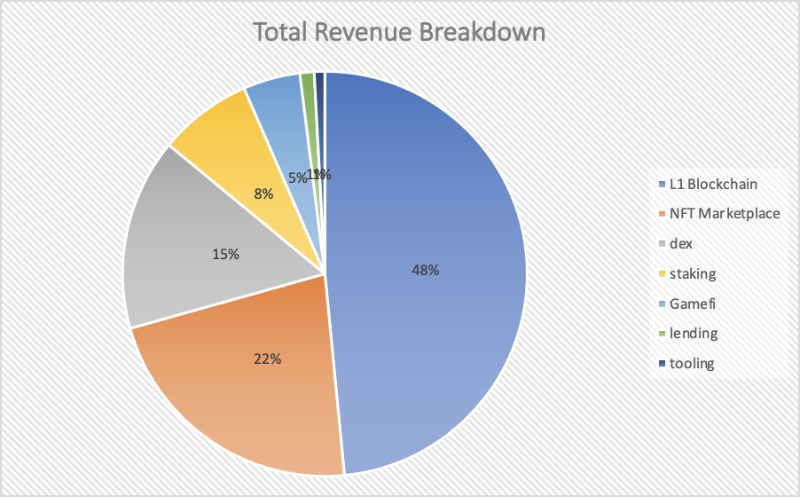
(Figure 2) Sector distribution among the top 18 highest-revenue protocols over the past 180 days (Source: Token Terminal, curated by FutureMoney Research Q2 2022)
Key observations:
● Layer 1 accounts for nearly half of total revenue, primarily through the "sale of block space";
● NFT marketplace revenue makes up 22%, driven by royalty commissions;
● DeFi DEXs contribute 15% via trading fees and liquidity provision;
● Staking-based DeFi earns 8%, modeled on asset management carry or interest spreads;
● GameFi represents 5%, monetizing via royalties, transaction fees, and NFT sales;
● Lending-focused DeFi generates about 1%, relying on interest rate spreads;
● Tooling contributes ~1% through service fees.
It’s clear that Ethereum is the strongest revenue engine, thanks to its "block space" business model, far outpacing others. Similarly, revenue polarization is stark among L1 blockchains.
Secondly, NFT marketplaces are strong revenue generators. Beyond the NFT hype, platforms charge high royalty rates (2–2.5%)—compare this to typical DEX fees like TraderJoe’s 0.05%.
2. Protocol Revenue Showdown
2.1 The Protocol's Own Value: Protocol Revenue
Typically, Web3 protocol revenue consists of two components: Supply-side Revenue and Protocol Revenue, where the latter can be allocated to Treasury or Token Holders (see figure below).
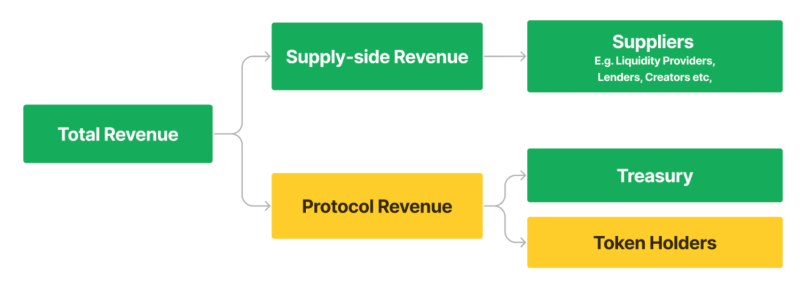
(Figure 3) Distribution of total revenue in Web3 protocols (curated by FutureMoney Research)
Explanation:
Total Revenue = Supply-side Revenue + Protocol Revenue
● Supply-side Revenue: Generated by suppliers—such as liquidity providers in DeFi, borrowers in lending protocols, or stakers—who earn returns after principal deduction. This value is created and retained by suppliers.
● Protocol Revenue: The portion retained by the protocol itself after delivering services. Typically, part goes to Treasury and the remainder may go to Token Holders.
According to our analysis, among the top 17 highest-earning protocols, Protocol Revenue typically constitutes a very small share.
● For most DeFi projects, Supply-side Revenue exceeds **90%** of Total Revenue. Uniswap, despite processing $1 trillion in trading volume and earning $600 million in six months, generates zero Protocol Revenue.
● Centralized platforms like OpenSea and Metamask lack tokenomics, so their Protocol Revenue reflects value captured by the company.
2.2 Protocols with High Protocol Revenue: Inherent Profitability
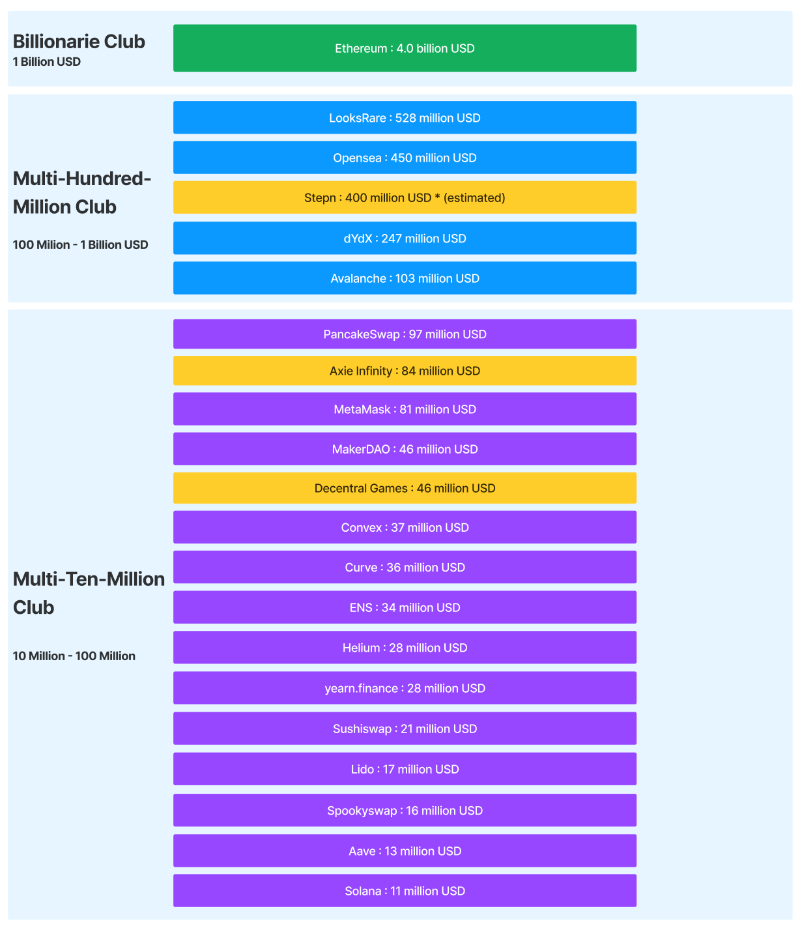
(Figure 4) Protocols with Protocol Revenue exceeding $10 million over the past 180 days (Source: Token Terminal, The Block, curated by FutureMoney Research)
When measuring profitability via Protocol Revenue, the ranking differs sharply from Total Revenue rankings. DeFi drops significantly, while L1s, NFT marketplaces, and GameFi projects maintain stronger positions.
Note: Some projects are highlighted in yellow
● Stepn isn't widely tracked but shows significant revenue—we’ve estimated based on public data
● Axie Infinity’s revenue has declined drastically, now below 10% of peak levels
● Decentral Games is only listed on Token Terminal, possibly affecting data accuracy
Thus, setting aside Governance Rights, let’s further examine which protocols actually return value to their tokens.
2.3 How Much of Protocol Revenue Flows to Token Holders?

(Figure 5) A meme about UNI (curated by FutureMoney Research)
Protocol Revenue can transfer value to Token Holders in three ways:
1. Direct Distribution (Revenue Sharing): Direct payouts to token holders—rare due to compliance issues
2. Real-Time Burn: Common in L1 blockchains, automatically executed in smart contracts
3. Buyback and Burn: More centralized, initiated and managed by the team
Among protocols with Protocol Revenue, we adjusted the dataset (notably adding BSC, which publicly discloses real-time burn and buyback plans but isn’t covered by Token Terminal). We identified eight protocols where tokens meaningfully capture income value.
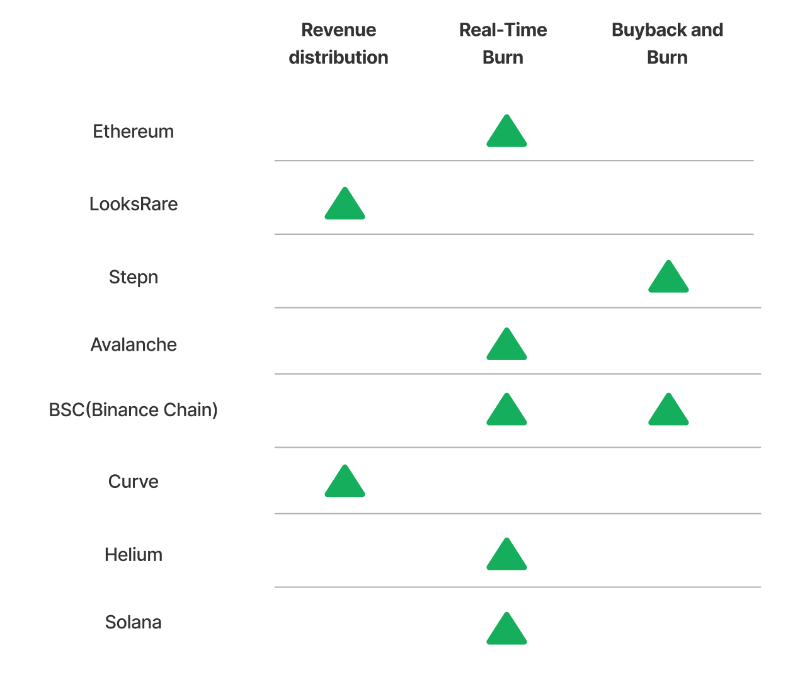
(Figure 6) Protocols with revenue-sharing or buyback mechanisms (curated by FutureMoney Research)
In terms of method, real-time burning is the dominant mechanism. Ethereum leads in burn volume, having destroyed nearly 2.38 million ETH; BSC follows with 37 million BNB burned via buybacks. Beyond these eight, none of the other top 20 Protocol Revenue-generating protocols return value to Token Holders.
Moreover, common auditing flaws exist in reporting Protocol Revenue—if overlooked, they could mislead assessments of a protocol’s true value.
3. Common Audit Flaws in Protocol Revenue: Our Perspective
3.1 Some Revenues Lack Risk Provisioning
Many staking platforms emphasize “high yields” or “high liquidity” to attract users. However, their competitive edge lies not in technology, but in leveraging financial engineering.
Take Lido: Normally, Ethereum staking involves long lock-up periods. But on Lido, users receive stETH immediately and retain staking rewards. Lido’s cost is issuing stETH at a 1:1 peg to staked ETH, and its revenue comes from taking a 10% cut of staking rewards.
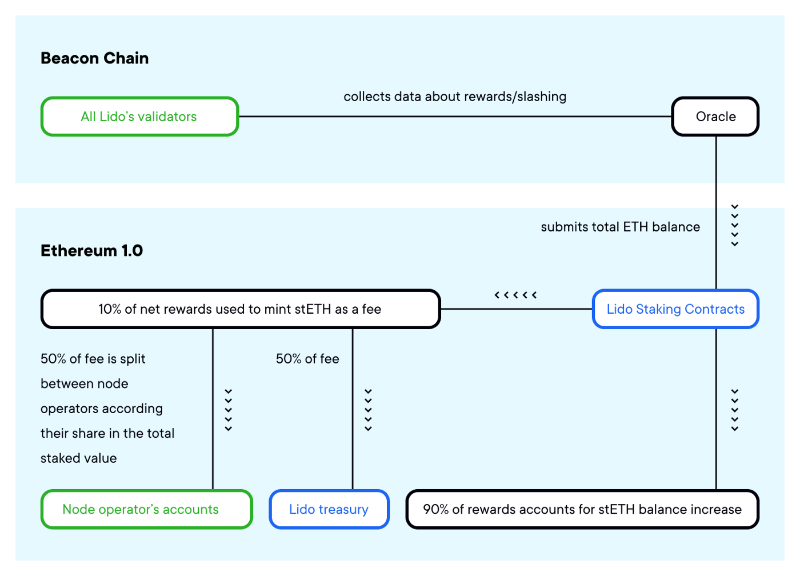
(Figure 7) Lido’s model (source: Lido, curated by FutureMoney Research)
Of course, there’s no free lunch. Lido holds large amounts of locked ETH but issues liquid stETH with a promise of 1:1 redeemability, requiring substantial reserves to cover withdrawal risks. These platforms perform well during credit expansion cycles but face severe profit declines and systemic risk during contraction phases. While Lido earned $16.6 million in 180 days, if risks materialize, this revenue could vanish. And the protocol’s primary obligation is to protect stETH holders—not LDO token holders.
3.2 Some Revenues Are Essentially Token Sales—and Highly Volatile
According to Web3 Index, revenue can be classified as internal or external. We extend this framework:
● Explicit Revenue (External): Payments made by users for using services—utility-driven
● Implicit Revenue (Internal): Payments made by users to obtain protocol tokens—speculative or arbitrage-driven
Implicit Revenue is common in x-to-earn and Web3 infra projects. Similar to Supply-side Revenue in DeFi, it closely resembles token sales: participants use the protocol to gain tokens (for speculative gains), contributing ETH or SOL as “revenue,” then selling tokens later for profit.
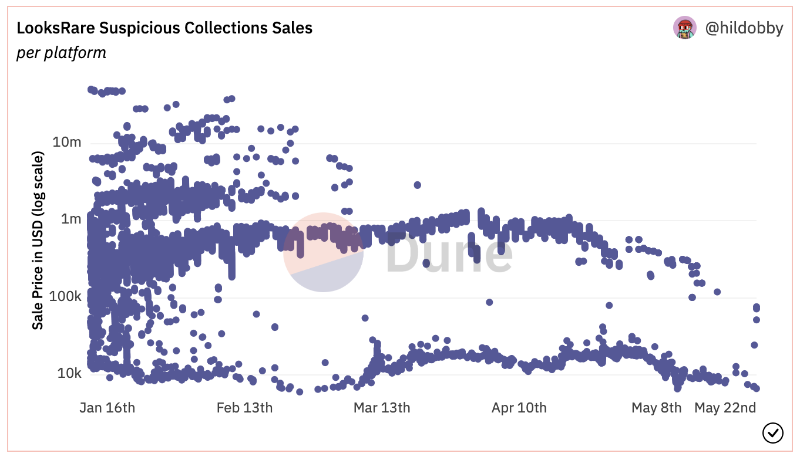
(Figure 8) Suspicious trading activity on LooksRare (source: hildobby, curated by FutureMoney Research)
For example, wash traders are the biggest contributors to Implicit Revenue on LooksRare. They pay large amounts of ETH in trading fees, earn LOOKS tokens, and sell them for profit—essentially engaging in circular arbitrage. This resembles token-sale-driven fundraising rather than organic, usage-based revenue.
Additionally, although LooksRare distributes Protocol Revenue to LOOKS stakers, the ETH collected is automatically sold into LOOKS and paid out in LOOKS. This functions as a built-in token sale mechanism.
Ultimately, while LooksRare reports massive profits ($580 million in 180 days), all other participants—wash traders and token holders alike—end up paying ETH and receiving LOOKS tokens. Who truly captures value? The treasury or LOOKS holders?
3.3 Some Revenues Are Never Disclosed: Inflationary Gains in Dual-Token Systems
In GameFi 2.0, dual-token models are common:
● Governance Token: Distributed to VCs/investors, capped supply, often includes buyback/burn mechanisms
● Utility Token: Awarded to players, uncapped, non-repurchased, designed to stabilize in-game economies independently of investors. While well-intentioned, poor execution can allow teams to extract excessive value from the ecosystem.
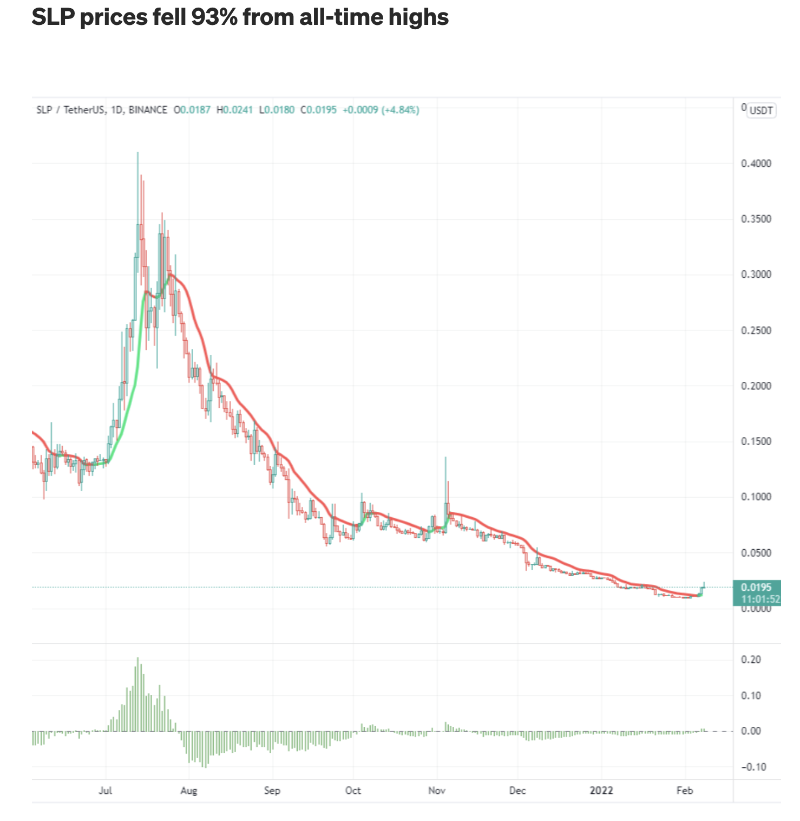
(Figure 9) SLP’s dramatic decline (source: hildobby, curated by FutureMoney Research)
On-chain analysts often overlook a key issue: while celebrating rising “inbound/outbound” transaction volumes in games, Utility Tokens are continuously inflated. Teams may use multiple addresses to repeatedly trade these utility tokens, extracting large profits without disclosing them. According to whitepapers, they’re only required to disclose release schedules for Governance Tokens.
Although Governance Tokens may deflate and accumulate value, unchecked inflation of Utility Tokens allows project teams to siphon value from the game economy—akin to a slow rug pull, harming investors. Currently, we lack hard data on this hidden income stream, though it remains a plausible concern.
As of 2022, Web3 companies have demonstrated viable business models and significant revenue-generating capacity.
Finding fairer, more community- and society-beneficial ways to distribute this revenue remains a difficult challenge. Some protocols keep revenue for themselves, others hold it in treasuries, and a few return it to communities. Unfortunately, some avoid disclosure altogether, masking profit-taking while exposing Token Holders to substantial risks.
We hope to see more development in Web3 auditing, financial transparency, and regulatory oversight to mature the industry. If you're working in—or interested in—these areas, feel free to reach out via email.
Source link: https://mp.weixin.qq.com/s/Cw4pdy9YhQxVWGflnCeCrA
Join TechFlow official community to stay tuned
Telegram:https://t.me/TechFlowDaily
X (Twitter):https://x.com/TechFlowPost
X (Twitter) EN:https://x.com/BlockFlow_News






