The Rise of Algorithmic Stablecoins: An Analysis of Terra, Olympus, and FRAX
TechFlow Selected TechFlow Selected
The Rise of Algorithmic Stablecoins: An Analysis of Terra, Olympus, and FRAX
Real-world use cases and sustainable high yields are the key to a stablecoin's success.
 Navigating Web3 tides with focused insights
Author: CJ_Blockchain
TechFlow is authorized to publish
I. Terra
(1) Model: Dual-Token Model
1. Dual Tokens
LUNA: LUNA is the governance token of the Terra protocol, primarily used for protocol governance and staking mining. Users stake Luna with validators, who record and verify transactions on the blockchain in exchange for transaction fee rewards.
UST: The Terra ecosystem includes multiple tokens, with several stablecoins pegged to different fiat currencies. TerraUSD (UST), pegged to the US dollar, has the largest market cap and trading volume. TerraKRW (KRT), pegged to the South Korean won, is used in the Chai payment app. Here we focus on UST.
2. Mechanism
UST maintains a stable 1:1 exchange rate with USD because LUNA absorbs UST's volatility through arbitrage mechanisms. The Terra algorithm ensures that 1 UST can always be exchanged for $1 worth of LUNA, and vice versa. This mechanism creates risk-free arbitrage opportunities when UST deviates from $1, which naturally pushes its price back toward parity.
3. Simulation Example
Let’s consider a simple example:
Suppose UST trades at $1.10 in the market.
- Arbitrageurs send $1 worth of LUNA tokens to the protocol
- The protocol burns the $1 worth of LUNA and mints 1 UST
- Arbitrageurs sell this 1 UST on the market for $1.10, earning a $0.10 profit
Result: UST inflation and LUNA deflation. As UST expands and LUNA contracts simultaneously, LUNA holders benefit from rising prices due to reduced supply. Meanwhile, increased UST supply brings its market price back down to $1.
Conversely, suppose UST trades at $0.90.
- Arbitrageurs buy 1 UST for $0.90 on the open market and send it to the protocol
- They exchange 1 UST for $1 worth of LUNA via the Terra protocol
- Then they sell the LUNA for $1, making a $0.10 profit
Result: UST contraction and LUNA inflation. Reduced UST supply drives its price back up to $1.
(2) Model Analysis
The key to algorithmic stablecoins lies in price stability, which requires both a viable economic model to maintain system equilibrium and real demand. Investors are profit-driven. Compared to DAI, which is over-collateralized, or USDC, backed by government-regulated reserves, holding an algorithmic stablecoin carries higher risk. Therefore, for an algorithmic stablecoin to succeed, it needs not only a sound economic design but also genuine use cases.
In terms of economic structure, Terra developed a dual-token algorithmic stablecoin model where LUNA absorbs UST's volatility through arbitrage. On the application side, Anchor within the Terra ecosystem played a crucial role.
1. High "Risk-Free Yield" Drives Strong Demand
Anchor is a lending protocol on the Terra network offering UST depositors an average annual yield of 20%. A 20% annual return on a stablecoin is highly attractive in the DeFi space. In finance, when two currencies have similar purchasing power but vastly different interest rates, capital flows from low-yield to high-yield assets—a phenomenon known as the “siphon effect.” People prefer holding higher-yielding currencies, selling off lower-yielding ones, thereby driving up the value of the high-interest currency. UST was no exception—its upward price pressure was fully absorbed by LUNA (via UST inflation and LUNA deflation), one reason why LUNA surged dramatically over the past year.
Anchor’s high staking yield created an ideal use case for UST, giving investors a compelling reason to hold a high-risk stablecoin.
2. Is the High Yield Sustainable?
A 20% yield may not sound extraordinary in DeFi, but note that Anchor pays depositors in UST—not its own native token. Unlike other lending protocols that incentivize users with platform tokens, Anchor distributes actual value. Can Anchor’s revenue cover this 20% payout, let alone generate profit? All data below is accurate as of April 20, 2022.
(1) Interest Income from Loans
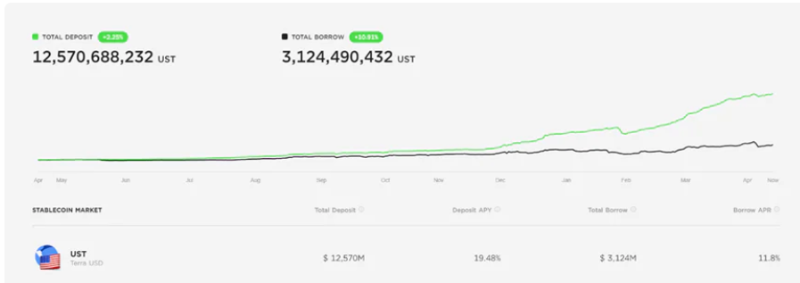
Lending protocols survive by attracting deposits at low rates and lending out at higher rates. Can Anchor lend at rates above 20%? No. Anchor’s borrow APR is 11.8%. After deducting ANC rewards, the effective borrowing rate drops to 5.12%. With total loans amounting to $3,124.5 million, annual interest income equals 3,124.5 × 11.8% = $368.69 million.
(2) Collateral Revenue
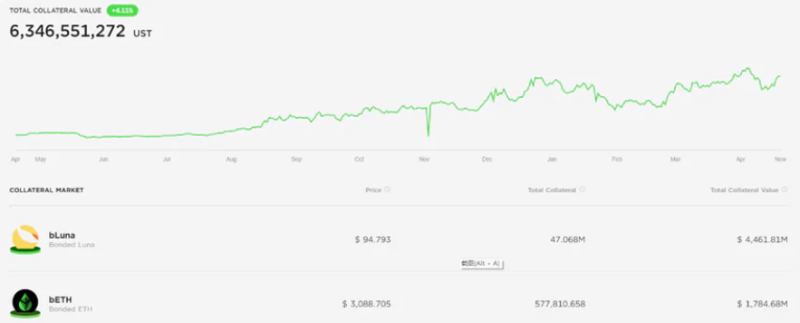
Anchor earns not just from loan interest, but also reinvests collateral posted by borrowers to generate additional returns. Primary collaterals on Anchor are bLUNA and bETH. Anchor stakes bLUNA on the Terra network and bETH on Lido to earn staking yields. bLUNA yield = 4,461.8 × 6.98% = $311.43 million; bETH yield = 1,784.7 × 3.8% = $67.81 million.

(3) Insufficient Revenue
Anchor’s annual interest expense on deposits is approximately $2,448.63 million ($12,570.69 million × 19.48%). Total estimated income is $368.69M + $311.43M + $67.81M = $747.93 million. Thus, maintaining such high deposit yields would result in an annual loss of about $1.7 billion.
(3) When Will the Death Spiral Begin?
Currently, Anchor holds around $15.8 billion in UST deposits (net deposits plus staked amounts), while UST’s total circulating supply is about $17.72 billion—meaning Anchor accounts for 89% of all UST liquidity. If Anchor fails to retain these funds, UST holders will have nowhere else to go.
As previously analyzed, Anchor’s high deposit yields are unsustainable. The sole reason Anchor has maintained a ~20% yield so far is continuous financial support from LFG (Luna Foundation Guard). Hence, UST’s stability now hinges entirely on Anchor, which in turn depends on LFG—the final backstop for the entire Terra ecosystem. To boost confidence and reduce risks, LFG recently added BTC to its reserves, effectively using Bitcoin to indirectly back UST. However, none of these measures address Anchor’s fundamental deficit issue.
Long-term, I believe a death spiral for UST is highly likely. It could unfold in various ways. One scenario involves a black swan event in crypto—LUNA crashes sharply along with the broader market. Once LUNA’s market cap falls below UST’s, panic ensues, as 1 UST can no longer be redeemed for $1 worth of LUNA. Even before reaching that point, fear-driven selling of UST could trigger a cascade. As UST de-pegs, arbitrageurs mint more LUNA using UST and dump it into an already collapsing market, further depressing LUNA’s price—sparking a full-blown death spiral. Another path: Anchor reduces its deposit yield due to unsustainability. Once the yield drops below a critical threshold where most holders see unacceptable risk-reward imbalance, the $15.8 billion UST pool could flood the market like a dam breaking. The stablecoin exchange market cannot absorb such massive outflows, triggering yet another spiral.
II. Olympus
(1) Model: Single-Token Model
1. Single Token
OHM is the algorithmic stablecoin launched by Olympus DAO. There is no separate governance token—Olympus operates on a single-token model where OHM serves as both the stablecoin and governance token.
2. Mechanism
Olympus DAO is governed by its community and features PCV (Protocol Controlled Value)—a treasury controlled by the protocol to manage OHM issuance/buybacks and bond mechanisms, pushing OHM toward “stability.” This “stability” differs from traditional stablecoins. OHM does not rigidly peg 1:1 to DAI, but every newly issued OHM must be backed by $1 of DAI in reserves.
3. Simulation Example
OHM uses DAI as its reference peg—though again, this means each new OHM issued must be backed by $1 DAI, not that 1 OHM must equal 1 DAI in price. The amount of OHM minted or burned is controlled by ICV (Inflation Control Variable) and DCV (Deflation Control Variable). The protocol doesn’t infinitely issue OHM to correct price deviations.
Specifically: when 1 OHM trades above 1 DAI, the protocol issues and sells new OHM; when below, it buys back and burns OHM—using inflation or deflation to maintain alignment.
Whether OHM trades above or below DAI, the protocol profits. It distributes 90% of profits to OHM stakers and 10% to the Olympus DAO treasury. How does it profit in both scenarios? For example: if 1 OHM = 2 DAI, the protocol mints new OHM and sells them at 2 DAI each, while requiring only 1 DAI in backing per OHM—keeping the extra 1 DAI as profit. With increased reserves, it can mint even more OHM. Conversely, if 1 OHM = 0.5 DAI, the protocol buys back OHM at half price, increasing its reserve ratio.
Beyond minting and burning, Olympus employs a Bonding mechanism: it offers discounted OHM bonds. For instance, if OHM trades at 100 DAI, a bond might offer it at 95 DAI (actual pricing based on Risk-free Value / Premium). Investors pay with equivalent LP tokens (e.g., OHM/DAI pair), receiving 5 DAI in profit. Through this, Olympus accumulates large amounts of LP tokens, enhancing market liquidity and locking substantial OHM into liquidity pools.
(2) Model Analysis
High Staking Yields + Inflationary Economics Enable (3,3) Equilibrium
Returning to our earlier question: Why would investors choose an algorithmic stablecoin over safer, collateral-backed alternatives? What use cases does OHM offer? Like Terra, OHM’s primary utility is staking yield, which can reach annualized levels exceeding 7900%.
Two factors enable these astronomical returns: first, compounding—OHM automatically re-stakes rewards every 8 hours without user intervention; second, its unique economic model—when OHM trades above $1, the protocol enters inflation mode, distributing newly minted OHM as staking rewards.
With a robust economic model and extreme yields, Olympus achieves a game-theoretic Nash equilibrium—commonly referred to as the (3,3) pool. Simply put: staking OHM offers enormous returns, and widespread staking reduces circulating supply, pushing prices up. Higher prices lead to more inflation and higher yields, incentivizing further staking rather than selling. As a result, after launch, OHM’s price rose steadily, peaking above $1,300.
(3) The Death Spiral Arrived Anyway
Many forget—or choose to ignore—that Nash equilibrium includes not only the (3,3) outcome but also the (-3,-3) collapse scenario, what crypto communities often call the “death spiral.” If OHM’s price keeps rising, all is well. But if it begins falling consecutively, the protocol’s ability to inflate weakens, staking rewards shrink, fewer people stake, circulating supply increases, and prices fall further. This cycle accelerates quickly—even a small initial drop can trigger collapse. Participants know it resembles a Ponzi scheme, yet believe they’ll exit before the end. But someone is always the smartest—and fastest—leading to cascading sell-offs.
What followed is well-known: OHM peaked around $1,350 in October 2021. Within weeks, its price halved repeatedly. By April 22, 2022, OHM traded around $70.
III. FRAX
(1) Model: Dual-Token Model
1. Dual Tokens
FRAX: A stablecoin pegged to $1 USD.
FXS: Governance token, collects seigniorage, with a total supply of 100 million. Like Terra’s LUNA, FXS absorbs FRAX’s volatility to stabilize its price.
2. Mechanism
Frax starts fully collateralized, then gradually shifts to partial collateralization via algorithmic adjustments.
Initially, Frax sets a 100% collateral ratio—each FRAX requires $1 USDC in backing. The collateral ratio adjusts based on FRAX’s market price: if FRAX > $1, demand exceeds supply, so the ratio decreases (less USDC required); if FRAX < $1, supply exceeds demand, so the ratio increases (more USDC required). The logic: when FRAX trades above $1, market confidence is high, allowing higher risk-taking through reduced collateral, thus cooling demand.
3. Simulation Example
Assume 1 FRAX = 1.1 USDC with an 80% collateral ratio. Arbitrageurs can mint 10,000 FRAX using 8,000 USDC and $2,000 worth of FXS. Selling these 10,000 FRAX at $1.10 yields a $1,000 profit. The treasury retains the USDC as collateral or reinvests it, while FXS is immediately burned. Conversely, if FRAX trades below $1, the reverse process pulls price back to parity. (Note: Seigniorage paid in FXS is ignored here for simplicity.)
(2) Model Analysis
AMO (Algorithmic Market Operations)
FRAX introduced AMO—Algorithmic Market Operations—to reinvest idle collateral and generate yield, supporting long-term growth. Since the collateral ratio dynamically adjusts, excess USDC can be deployed into DeFi platforms like Curve and Aave. Notably, FRAX and Convex jointly hold significant CVX, enabling strong liquidity incentives for FRAX-related pools on Curve. Starting October 2021, all AMO earnings are distributed to FXS stakers (previously 50%), significantly boosting FXS utility and staking appeal.
(3) Can a Death Spiral Happen?
Though FRAX positions itself as a partially algorithmic stablecoin, analysis shows it fundamentally differs from projects like OHM and Terra—it has real USDC backing. Currently, FRAX’s collateral ratio is about 83%, meaning even in worst-case scenarios, each FRAX is still worth $0.83 in USDC, with only the remaining 17% exposed to FXS-based volatility absorption. Moreover, as FRAX’s price drops, the collateral ratio rises automatically, potentially allowing investors to recover more than expected during a crisis.
Overall, FRAX represents the lowest-risk category among algorithmic stablecoins. However, this comes at the cost of capital efficiency. The original vision of algorithmic stablecoins was to create a non-collateralized, algorithmically stabilized coin—so in some sense, FRAX isn't a "true" algorithmic stablecoin.
IV. Conclusion
The core of algorithmic stablecoins may not lie in algorithms. A solid algorithm and economic model are necessary conditions for success, but the true key to sustained stability is creating real demand. Every algorithmic stablecoin must answer one question: Why should investors hold a stablecoin riskier than USDT or USDC? Is there a genuine, essential use case? Or is there sufficient risk premium? Thus, real-world applications and sustainable high yields are the real keys to success.
Join TechFlow official community to stay tuned
Telegram:https://t.me/TechFlowDaily
X (Twitter):https://x.com/TechFlowPost
X (Twitter) EN:https://x.com/BlockFlow_News