

Far More Than Just Gold and Silver Have Collapsed
TechFlow Selected TechFlow Selected
Far More Than Just Gold and Silver Have Collapsed
Assessing China’s stock market hinges primarily on closely monitoring the intensity and implementation effectiveness of domestic policies, as well as verifying listed companies’ earnings performance.
Authors: Ding Ping, Duan Mingzhu
This is the worst of times—and precisely when calm, rational scrutiny is most needed.
Within just two or three days, gold and silver collapsed, followed by U.S. equities—and then cryptocurrencies. On Monday, China’s A-share market will also face a “stormy downpour.”
Let’s trace the sequence.
On January 30, 2026, COMEX gold plunged below $5,000 per ounce—a peak decline of up to 16%. Silver corrected even more sharply: COMEX silver fell from a high of $121.785 per ounce to a low of $74 per ounce, registering a maximum drop of 39%. After the frenzy, gold and silver inevitably crashed.
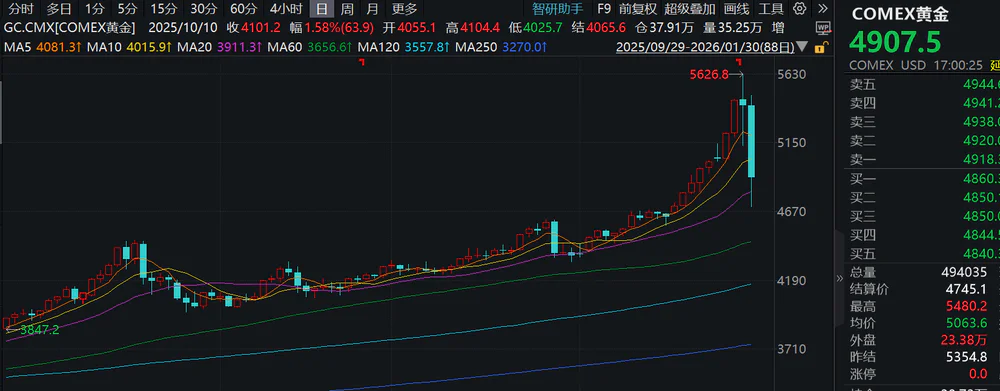
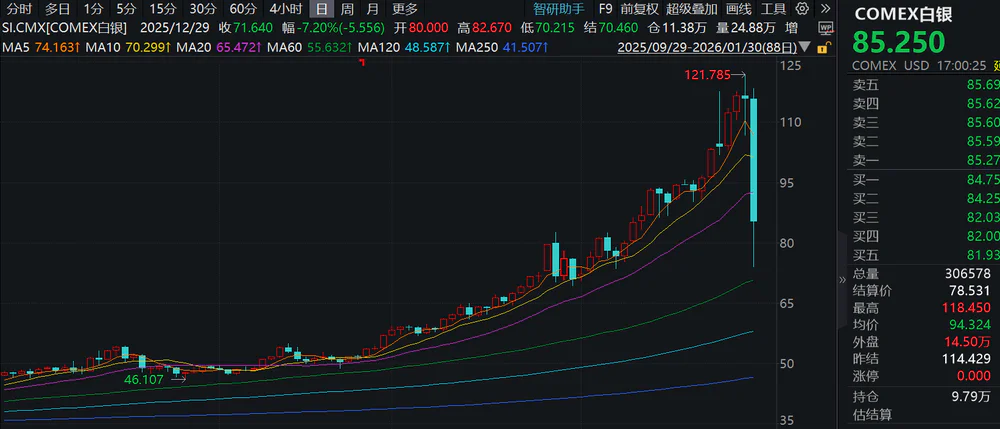
Source: Wind
On the same day, U.S. equities were hit by a bloodbath: all three major indices closed lower, and mega-cap tech stocks broadly declined.
Then, on January 31, Bitcoin tumbled nearly 10%, breaking below the $80,000 psychological threshold. This served as a risk rehearsal—signaling that Monday’s capital markets would be anything but tranquil.
Why did gold and silver suddenly crash? Has the rally peaked—or is this merely a “reverse gear” maneuver to pick up latecomers? Why did U.S. equities (especially tech) follow suit? What impact will this have on China’s A-share market? And what should ordinary investors do? This article addresses each question in turn.
Why Did Gold and Silver Crash So Suddenly?
The immediate trigger was a dramatic reversal in Fed rate-cut expectations.
On the evening of January 29, news surfaced that Kevin Warsh would become the next Federal Reserve Chair; on the evening of January 30, Donald Trump officially announced the appointment. As a former Fed governor, Warsh has consistently advocated aggressive balance sheet reduction and more aggressive quantitative tightening (QT).
Markets thus converged on the view that, under Warsh’s leadership, the Fed would push hard for balance sheet contraction—removing dollar liquidity from markets—and possibly adopt a tighter monetary policy stance. This directly undermines the previously near-universal expectation of continued monetary easing. And non-yielding assets like precious metals—highly dependent on loose financial conditions—were the first to suffer.
In reality, Warsh’s appointment as next Fed Chair wasn’t a black-swan event—the market had anticipated it. Yet the violent reaction stemmed from how sharply gold and silver had surged beforehand: short-term expectations had been fully priced in, and profit-taking positions were highly concentrated. Against this backdrop of extreme sentiment, even modest positive developments—like de-escalation in Iran—amplified downside risks, triggering a rush for the exits and culminating in a sharp correction.
It’s unsurprising that silver fell harder than gold. Compared to gold, silver’s market is tiny—just 15.6% the size of gold’s. According to CompaniesMarketCap data, global gold market capitalization stands at ~$33.3 trillion, while silver’s is only ~$5.2 trillion.
Thus, silver is inherently more speculative and more elastic: during rallies, its gains far outpace gold’s—recently the gold/silver ratio dropped as low as 46. But once liquidity expectations shift and risk appetite wanes, silver becomes especially vulnerable to systemic deleveraging—and the first asset investors flee.
So the key question remains: Is this crash a true top—or just a temporary pullback?
Gold Awaits Release of Panic Sentiment
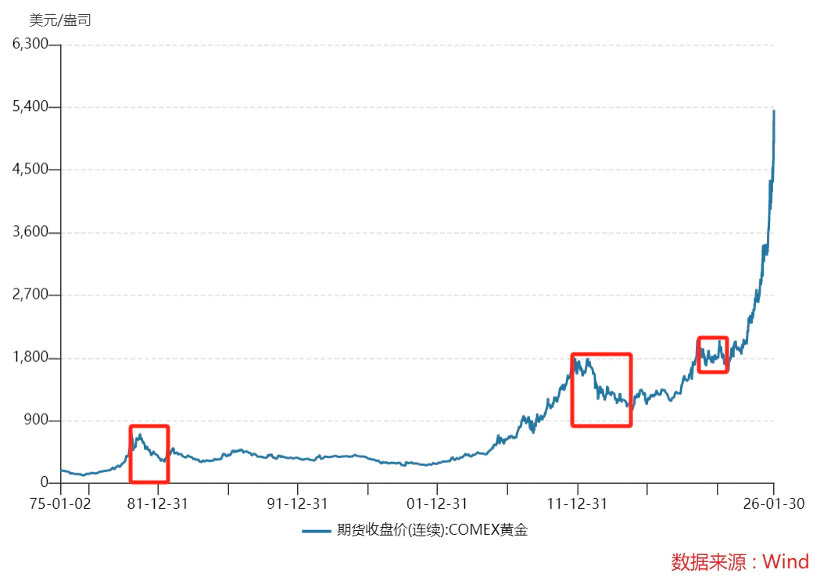
Before answering, let’s revisit historical gold tops.
After the collapse of the gold standard, gold entered a freely floating era—giving rise to several cyclical peaks.
The first occurred in 1980, when gold hit an all-time high (~$850/oz, unadjusted for inflation). That peak ushered in a 20-year bear market: by 1999, gold bottomed near $255/oz—a nearly 70% decline.
Multiple factors drove this: First, Fed tightening—Chairman Paul Volcker hiked the federal funds rate to 20% to tame inflation. Second, economic recovery and stock-market boom—under Reagan, the U.S. economy stabilized; the 1990s internet bubble fueled equity gains, drawing capital away from non-yielding gold. Third, central bank gold sales—European, German, and French central banks began large-scale gold disposals in the 1990s.
The second major top came in 2011, when COMEX gold peaked near $1,870/oz. It then fell to ~$1,080/oz by January 2016—a ~40% drop. Again, Fed policy reversal was key: In 2014, the Fed announced QE tapering; in 2015, it launched its hiking cycle—pushing real yields higher and weighing on gold. Also, safe-haven demand receded: From mid-2012 onward, the Eurozone debt crisis eased and the U.S. economy recovered first—risk appetite rose, and capital flowed out of gold.
Beyond these two iconic peaks, gold also saw a cyclical high in 2020 amid Fed easing—but later plunged as pandemic-induced panic triggered broad-based risk-asset selloffs and a liquidity crisis. Even gold—traditionally the most liquid asset—wasn’t spared. Rising inflation also stoked rate-hike expectations, further pressuring prices.
In summary, gold tops typically share common drivers: Fed tightening, economic recovery, central bank gold sales—or forced liquidations during financial crises due to liquidity crunches.
Returning to today: This gold crash reflects fading easing expectations—and profit-taking after a sharp run-up. Crucially, gold’s fundamentals remain intact.
Even if Warsh assumes Fed leadership, the Fed is unlikely to implement tight monetary policy anytime soon.
First, it defies logic that Trump would appoint someone diametrically opposed to his own agenda. A more realistic interpretation is that this move carries strong political symbolism. With persistently high inflation dominating voter concerns, balance-sheet reduction—pulling liquidity back from markets—is aimed squarely at inflation control. By appointing Warsh, Trump signals commitment to taming inflation, delivering a clear message to voters ahead of the November 2026 midterm elections.
But whether this policy direction continues post-midterms remains highly uncertain.
Second, the U.S. economy remains relatively weak—and its debt burden keeps ballooning, nearing $39 trillion. Theoretically, resolving debt issues hinges on three paths: fiscal austerity (revenue enhancement + spending cuts), economic growth (expanding the pie), or default (outright reneging).
Yet none are viable for today’s U.S.: Fiscal austerity is politically untenable; robust growth lacks grounding; and default consequences are unimaginable. We’ve discussed this extensively in our piece “America’s ‘Rob-from-Poor-to-Rich’ Trap”.
The most feasible solution lies in inflation and rate cuts. “Inflationizing debt” means eroding the real value of government debt through currency depreciation. Meanwhile, low rates reduce interest-payment burdens—making balance-sheet expansion + rate cuts more conducive to alleviating U.S. debt pressure.
Moreover, gold’s long-term bullish thesis remains compelling.
Recently, ultra-long-dated sovereign bond yields across major economies have risen almost in tandem—especially Japan’s 40-year JGB yield, which hit a 30-year high. Even as some central banks signal rate cuts, long-end yields continue rising—driven by massive debt rollover pressures amid high deficits, persistent supply overhang, and weak global growth, prompting investors to demand higher risk premiums.
Result: Rising bond yields undermine long-term domestic-currency credibility.
If this trend persists, advanced Western economies’ fiscal models may gradually morph into “national debt Ponzi schemes”—relying on perpetual new debt issuance to sustain existing obligations. As rates climb, interest costs balloon rapidly—raising market doubts about the system’s sustainability.
Hence, markets’ core concern isn’t just short-term volatility—it’s whether this institutional framework can endure long-term stability. Will policies swing erratically to preserve short-term calm—further exhausting credibility?
We also doubt the Fed’s independence will hold. Political capture remains highly plausible—and once it occurs, the dollar’s credibility will erode further, reinforcing gold’s role as the ultimate safe haven.
Consequently, demand for gold—from both individual investors and central banks—shows no signs of weakening. The clearest evidence? Tether, the world’s largest stablecoin issuer, is aggressively accumulating gold—holding nearly 140 tons, making it the largest non-central-bank gold holder globally.
When a crypto-native institution begins loading up on gold, it signals deepening anxiety about the entire credit architecture—transcending traditional finance and crypto worlds alike.
Against this backdrop, gold’s current dip should be viewed as mere volatility—not a directional reversal.
While short-term panic sentiment still needs to exhaust itself—and Monday’s losses are already booked—there’s no need for excessive pessimism. With the long-term thesis intact, this sharp correction presents a better entry window.
Operationally, avoid going “all-in,” using leverage, or buying everything at once. Instead, deploy capital in tranches—gradually entering at key support levels. Since precise bottoms are impossible to call, position sizing must accommodate long-term holding horizons.
Silver Is Less Safe Than Gold
Gold’s bull case remains solid—but silver harbors latent risks.
Why? Let’s recap silver’s recent surge-and-crash dynamics.
In 2025, silver evolved from gold’s laggard to the precious metals sector’s top performer—a meteoric rise driven primarily by a short squeeze.
How does a short squeeze form?
Silver wears multiple hats: financial asset, industrial commodity, and speculative instrument. Recently, both its financial and industrial attributes signaled strength—bolstering bullish momentum. Longs piled into silver futures and physical silver—and even hoarded deliverable warehouse receipts. With deliverable inventories low (under 30% of total stock), short covering became increasingly difficult.
Note: Silver inventory structure is unique and highly segmented—including investment stock (ETFs and investor-held bars—“potentially recyclable” but highly behavior-dependent), industrial stock (raw materials held by electronics, EV, and solar firms—rarely price-sensitive), and deliverable stock (exchange-approved standard warehouse receipts).
Under these conditions, shorts were forced to buy physical silver or receipts at steep premiums to fulfill delivery obligations—spiking demand and pushing prices higher. The higher silver climbed, the more desperate shorts became—fueling a self-reinforcing feedback loop. Longs often refused to unwind positions, worsening supply-demand imbalance—creating a textbook short squeeze.
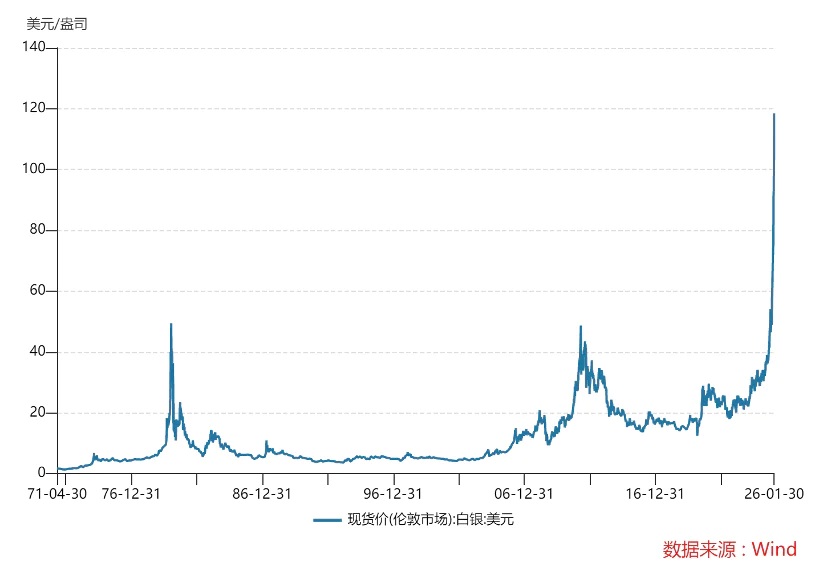
Given silver’s inherently limited deliverable inventory, shorts are easily squeezed. Historically, two major silver crashes stemmed precisely from structural squeezes hitting their limits before reversing violently.
In 1980, the Hunt brothers amassed massive physical silver holdings and built enormous long futures positions—effectively controlling global deliverable supply. They drove silver from $1.50/oz to nearly $50/oz.
But the CME (the core trading platform for gold and silver futures, handling all quoting, matching, and clearing) introduced “Rule 7”—banning new long positions and sharply raising margin requirements. Combined with the Fed’s tightening cycle, the longs’ financing chain snapped—and silver collapsed.
The second surge unfolded amid successive Fed QE rounds and the Eurozone debt crisis. At its peak, SLV (the flagship silver ETF) held 30–40% of annual global mine output—severely compressing investable silver supply. Silver rose from $8.50/oz in 2008 to $49.81/oz on April 25, 2011—a 486% gain.
The reversal came when the CME repeatedly raised margins—forcing leveraged longs to unwind—triggering rapid bubble deflation and accelerating price collapse.
This time, silver’s crash wasn’t caused by failed structural squeezes—but that doesn’t mean silver is risk-free.
Although, as noted earlier, the probability of imminent Fed tightening remains low, two risks warrant caution:
First, the CME’s ongoing margin hikes could force some longs to reduce positions. However, margin hikes only threaten tops when markets are highly leveraged and speculation extreme. While current silver leverage and speculative intensity haven’t yet reached historic highs, they exhibit early topping signals (margin hikes + concentrated longs + overheated sentiment)—meriting vigilance.
Second, industrial-demand narratives could falter—particularly in solar and EV sectors, where growth falls short of expectations—or silver substitution advances faster than anticipated.
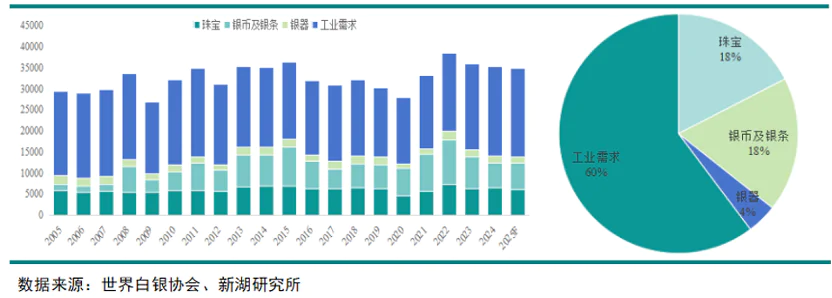
Silver isn’t just a financial asset—it’s a widely used industrial material. Its exceptional thermal/electrical conductivity and malleability make it indispensable across consumer electronics, premium tableware, fine jewelry, and medical devices.
The Silver Institute forecasts 2025 global silver demand at 36,000 metric tons—of which 21,000 tons (60%) stems from industrial use, mainly solar and EV applications.
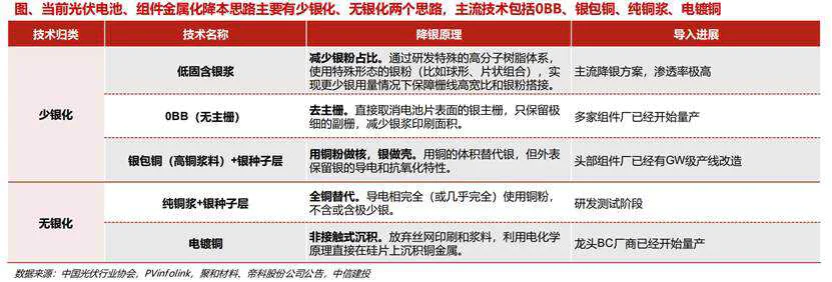
Skyrocketing silver prices—coupled with solar producers operating near breakeven—have made reducing silver usage in photovoltaics an urgent priority for module manufacturers.
PV paste cost-reduction strategies include base-metal substitution and process optimization. Base-metal substitution centers on replacing silver with copper or aluminum—copper being the dominant path.
First, copper’s resistivity (1.68) closely matches silver’s (1.56), yielding comparable conductivity. Second, at ~$18,000/kg for silver, copper costs just ~0.5% as much—and unlike scarce silver, copper is a high-volume commodity whose PV usage exerts negligible impact on global supply-demand.
Technologically, progress is evident: zero-busbar (0BB) technology is now mass-produced by multiple vendors; silver-coated copper technology has completed GW-scale production-line upgrades at leading manufacturers—expected to ramp up in H1 2026; and electroplated copper technology is already in mass production at top-tier BC-cell makers.
Whether solar and EV growth disappoint hinges on key signals—such as tightening industry subsidies or escalating U.S.-China trade tensions disrupting supply chains.
All told, silver’s upside case is markedly weaker than gold’s—and its risks are substantial. High leverage makes it fragile. Investors with low risk tolerance should tread carefully.
The rationale behind gold and silver’s crash is clear—but why did U.S. equities also “implode”?
What Are U.S. Equities Panicking About?
On January 30, U.S. capital markets exhibited four distinct patterns:
- First, gold/silver miners tumbled—iShares Silver Trust (SLV), the world’s largest silver ETF, plunged 28%; Coeur Mining dropped >16%; Gold Fields fell >14%.
- Second, tech stocks cratered—AMD fell >6%; Intel >4%. Notably, Microsoft plunged 9.99% the prior day—erasing nearly $360 billion in market cap, the second-largest single-day loss ever, with $54.79 billion in turnover (topping daily volume). On Jan 30, it slid another 0.74%. Less-covered domestically but critically important: AppLovin (AI app leader) plunged 16.89%; Unity (game engine) crashed nearly 25%.
- Third, some tech stocks rose—SanDisk (memory) opened high but closed up 6.85%; Tesla gained 3.32%, adding $46.1 billion in market cap overnight.
- Fourth, other sectors rallied—Chevron, Coca-Cola, Walmart, Procter & Gamble, and Eli Lilly (pharma) provided crucial ballast.
Notably, on Jan 30, the Nasdaq Golden Dragon China Index fell 2.36%, and the FTSE China A50 Index futures dropped 0.30% in overnight trading.
The first group’s plunge was unsurprising—mining stocks rode the rally up and inevitably corrected.
The tech selloff had two drivers: First, skepticism about AI ROI, sparked by Microsoft’s earnings. Second, Google’s AI world-model prototype Project Genie—capable of generating 3D games in seconds—threatens to disrupt current AI application logic, particularly game development, reinforcing fears of “large models consuming everything.”
Meanwhile, though precious-metals crashes didn’t trigger systemic liquidity crises, they precisely targeted highly leveraged speculative funds. Through sentiment contagion and funding linkages (sharp risk-aversion drop), they delivered short-term shocks to U.S. tech stocks—whose valuations were already fragile.
Among rising tech stocks, SanDisk’s pre-market surge (+20%) reflected blowout earnings—but market panic still dragged it down from its highs, showing even this year’s critical “tech pricing power” narrative is vulnerable to short-term fear. Tesla’s resilience stemmed from solid earnings and tailwinds from robotics and SpaceX.
This reflects intra-tech “quality rotation”—capital shifting from lower-quality to higher-quality growth stories, repricing certainty amid turbulence.
The fourth group benefited from flight-to-safety flows—investors favoring assets with minimal macro sensitivity and high earnings visibility.
Overall, U.S. equity volatility resulted from a triple storm: reversal of macro narratives, invalidation of micro-earnings stories, and cross-market liquidity shocks.
With gold/silver and U.S. equities both collapsing, will China’s A-shares get dragged down?
Will China’s A-Shares Bow First?
A-shares have largely decoupled recently—but external shocks still matter.
Monday’s A-share open will likely be lower. Currently, the market is range-bound between 4,018–4,186—stuck in this zone for 13 days. Indices show mixed performance, with heavyweight stocks rotating to support the market and investor sentiment deeply divided. Now, this external shock hits—immediately transmitting negative sentiment and risk aversion to A-shares. Some stocks may even open limit-down.
Xueqiu’s trending list reveals investor focus: Zijin Mining, Sunway Communication, Chunzhong Technology, Vanke A, Xingye Silver & Tin, BlueFocus, and Kweichow Moutai dominate the top 10—all loosely correlated with U.S. peers and likely to diverge.
Zijin Mining and Xingye Silver & Tin belong to the nonferrous metals sector. On Jan 30, they’d already been hit—nonferrous metals plunged >8% collectively, with over 30 stocks hitting limit-down, including Baiyin Nonferrous and Xingye Silver & Tin. This confirms that, in sentiment-driven extremes, A-share metal stocks track commodity prices tightly in the short term.
Prior to this, multiple listed companies issued risk alerts. Chifeng Gold noted recent gold price surges would materially impact operations; Sichuan Gold highlighted that gold concentrate prices fluctuate significantly with gold prices—large swings could severely affect earnings.
This mirrors a recurring A-share pattern: sector-wide rallies → wave of abnormal-trade notices → subsequent crashes.
Panic sentiment hasn’t fully cleared—so sectoral corrections persist. Given precedents in commercial aerospace and AI applications, Friday’s single limit-down may not suffice to stabilize things—don’t rush to catch falling knives.
But beyond gold, other metals are more industrially oriented—so medium-to-long-term fundamentals matter most. With annual earnings previews peaking, consider Zijin Mining: 2025 net profit forecast at RMB 51–52 billion—up 59–62% YoY, its best-ever annual result—and it projects higher 2026 output of gold, copper, lithium, and silver.
Next steps: Monitor when market sentiment stabilizes, then seek quality names. Industry leaders with superior resources and cost discipline withstand volatility better—and attract renewed capital post-correction. Also watch more earnings previews to verify whether price gains translate into profits.
Sunway Communication is viewed as a beneficiary of SpaceX’s plan to deploy one million satellites—and as a genuine commercial aerospace player with real technical capabilities and business traction. Though current revenue contribution is small, investors prize its strategic positioning for long-term growth.
Thus, despite brutal sector-wide corrections recently, Sunway’s stock held up well. As commercial aerospace was the first to correct, it should logically rebound first when broader indices finally catch up.
However, widespread optimism warrants caution—overheated opening sentiment could backfire, especially after excessive prior speculation.
Chunzhong Technology belongs to the liquid-cooling and NVIDIA themes—its sudden surge stemmed from a newly granted patent titled “A Chip Testing Device.” Yet its stock had just endured multiple limit-downs.
Currently, market reactions to good news are random—sometimes catalysts trigger selloffs, sometimes multi-day rallies. Only intraday confirmation of capital acceptance can guide action.
Chunzhong—and indeed all NVIDIA-chain tech firms—face the same AI ROI skepticism.
Newly, Jensen Huang clarified NVIDIA never committed to OpenAI’s rumored $100 billion investment—instead, it will assess each funding round individually.
Wall Street had already dubbed NVIDIA, OpenAI, and Oracle’s tripartite alliance the “AI closed-loop hegemon.” But OpenAI’s massive fundraising—versus unclear monetization—created tension. Huang’s pivot, combined with Oracle’s layoffs and credit line withdrawals, amplifies market worries.
Even NVIDIA’s stellar earnings couldn’t prevent a post-announcement stock decline—reflecting fresh anxiety: investors applaud past results but fear future sustainability.
This anxiety spills over to Chinese AI-chain firms—especially those with stretched valuations and prices already pricing in future earnings. Their ability to deliver market-satisfying growth this year is now highly uncertain—diminishing upside potential.
On Jan 30, semiconductors and communications showed relative resilience—opening low but quickly rebounding. Still, Monday’s open will heavily depend on U.S. tech stocks’ performance.
BlueFocus, an AI-application leader, appearing in the top 10 is unsurprising. Its apparent headwinds include Friday’s after-hours share-sale announcement and earnings disappointment—RMB 200 million net profit, implying a 400x P/E. But digging deeper: Q4 revenue growth is expected ≥20%—double the first three quarters—proving AI drives growth. And the insider sale amount poses minimal threat.
Logically, competition at chip and model layers is already intense and structurally settled—massive investments demand returns. Only application-layer firms can generate revenue and profits to validate commercial viability. Hence, capital must push application-layer narratives—to find an exit for the entire AI story.
Yet, as noted, if large models truly “eat everything,” the foundational logic of many independent AI application firms collapses—even if threats currently manifest mostly in gaming, where value chains undergo extreme restructuring and concentration. This is a deep, systemic threat.
It parallels early internet history: countless independent websites and apps ultimately saw their value absorbed and restructured by a few platforms—Google, Facebook, Amazon. AI may follow suit—evolving toward “foundational model platforms + a handful of super-apps + vast numbers of highly customized/vertical-specific agents.” Generic middle-layer applications will vanish.
Weekend Yuanbao red envelopes are already being distributed—possibly lifting related stocks Monday. But Tencent’s Hong Kong-listed stock performance—and ultimately Yuanbao’s user retention and conversion metrics—will determine real validation.
This implies AI applications still have room to run this year—but investors must seek firms with edge in “deep hardware-software integration” and “exclusive data assets.”
Finally, Vanke A and Kweichow Moutai represent real estate and its linked consumption sector. Amid talk of a “once-in-a-decade real estate inflection point”—plus proximity to the “mini-spring” housing season—real estate discussions intensified, lifting Vanke A and peers. The liquor sector nearly hit collective limit-ups on Jan 29.
But Vanke A’s Jan 30 earnings preview doused the flames: projected 2025 net loss of RMB 8.2 million—the largest single-year loss in A-share history.
By contrast, Kweichow Moutai is the “star pupil”: revenue still growing, dividends steady, i-Moutai selling strongly, and Spring Festival sales season approaching—price hike rumors abound.
Yet it faces two big challenges. First: Has its business logic shifted entirely—from “long-term brand premium preservation” to urgent “cash-flow-and-turnover-driven fiscal logic”? Will its hard-won luxury-consumer image crumble—and its business model change irrevocably? Second: How to balance traditional distribution with direct-sales models.
Still, the liquor sector trades at low valuations, boasts predictable profitability, and sits near its cyclical trough. If capital seeks safety and “rotation to lower valuations,” it may revisit the sector—recent collective gains signaled such a test, a left-side rebound.
Beyond liquor, U.S. analogues suggest similar low-valuation, high-certainty, macro-insensitive sectors may attract safe-haven flows—and indices need sectors to anchor stability and momentum.
Examples include domestic-demand- and policy-driven themes—decoupled from global cycles, directly benefiting from China’s stabilization policies: consumer staples (essential consumption), agriculture (food security), and autos (trade-in incentives).
What Should Investors Watch?
Short-term, A-shares face a stress test on sentiment and liquidity. Once panic subsides, A-share trajectories will swiftly anchor to domestic fundamentals and policy. Moreover, after thorough shakeouts, the spring rally remains promising.
Specifically, investors should note:
- Avoid panic-selling quality holdings: For investors already holding fundamentally sound, sector-leading stocks, this dip is better viewed as a stress test—and a long-term accumulation opportunity—not a disaster. Of course, if pressure mounts, trimming positions temporarily and re-entering post-stabilization is prudent.
- Use the correction to optimize allocation: This pullback is a “litmus test” for company quality. Use it to gradually shift exposure from speculative stocks toward core leaders in “hard tech” and “hard demand” sectors—or initially allocate to defensive names.
- Monitor key signals: Track when U.S. peers in relevant sectors stabilize—and more importantly, watch 2025 annual reports and 2026 Q1 earnings: earnings delivery will be the strongest “stabilizer” for stock prices. Also monitor major domestic policies—China’s “slow-bull” guidance and domestic-demand stimulus (e.g., consumption subsidies) will underpin markets.
In truth, all economic problems are political problems. When U.S. equities crashed, European indices rose across the board—precisely because Europe stood opposite America’s current predicament, becoming a short-term safe haven and rebalancing destination.
If geopolitical risks escalate, China’s stable macro policies and financial-market openness may attract international “safe-haven” capital. The scale and effectiveness of “domestic-demand expansion” policies will be pivotal in sustaining A-share independence and luring capital back.
Still, judging China’s equity market hinges on watching the pace and implementation of domestic policies (fiscal, monetary, industrial)—and verifying corporate earnings (especially in the above-mentioned core sectors). After all, external variables amplify volatility—but don’t dictate direction.
Join TechFlow official community to stay tuned
Telegram:https://t.me/TechFlowDaily
X (Twitter):https://x.com/TechFlowPost
X (Twitter) EN:https://x.com/BlockFlow_News


