

1,000 wallets contribute 85% of transaction volume—stablecoin payments are more centralized than you think
TechFlow Selected TechFlow Selected
1,000 wallets contribute 85% of transaction volume—stablecoin payments are more centralized than you think
The adoption rate of stablecoins continues to rise over time, with their transaction volume and number of transactions more than doubling between August 2024 and August 2025.
Author: Artemis
Translation: TechFlow
This report presents an empirical analysis of stablecoin payment usage, covering transactions between peer-to-peer (P2P), business-to-business (B2B), and peer-to-business/business-to-peer (P2B/B2P).
Through empirical analysis of stablecoin payment usage, this report examines transaction patterns across peer-to-peer (P2P), business-to-business (B2B), and peer-to-business/business-to-peer (P2B/B2P) interactions. We utilize the Artemis dataset, which provides metadata for wallet addresses including geolocation estimates, institutional ownership labels, and smart contract identification. Transactions are classified based on sender and receiver wallet characteristics. The analysis focuses on the Ethereum network, which hosts approximately 52% of the global stablecoin supply.
We primarily studied two major stablecoins: USDT and USDC, which together account for 88% of market share. Despite a significant increase in stablecoin adoption and regulatory attention over the past year, a key question remains unanswered: How does actual stablecoin usage in payments compare to other activities? This report aims to uncover the main drivers behind stablecoin payment adoption and provide insights for forecasting future trends.
1. Background
In recent years, stablecoin adoption has grown significantly, with supply reaching $200 billion and monthly raw transfer volumes exceeding $4 trillion. Although blockchain networks offer fully transparent transaction records where all transactions can be analyzed, conducting transaction and user analysis remains challenging due to network anonymity and lack of information about transaction purposes (e.g., domestic payments, cross-border payments, trading, etc.).
Furthermore, the use of smart contracts and automated transactions on networks like Ethereum adds complexity to analysis, as single transactions may involve interactions with multiple smart contracts and tokens. Thus, a critical unresolved issue is how to assess the current proportion of stablecoin usage in payments versus other activities such as trading. While many researchers are working to address this complex problem, this report aims to contribute additional methodologies for evaluating stablecoin usage, particularly for payments.
Overall, there are two primary approaches to assessing stablecoin usage, especially for payments.
The first is the filtering approach, which uses raw blockchain transaction data and applies filtering techniques to reduce noise, thereby providing more accurate estimates of stablecoin payment usage.
The second method involves surveying major stablecoin payment providers and estimating stablecoin activity based on their disclosed payment data.
The Visa Onchain Analytics Dashboard, developed jointly by Visa and Allium Labs, employs the first approach. By applying filtering techniques to reduce noise in raw data, it offers clearer insights into stablecoin activity. Studies show that after filtering raw data, total monthly stablecoin transaction volume drops from around $5 trillion (total volume) to $1 trillion (adjusted volume). If considering only retail transactions (transactions under $250), the volume is merely $6 billion. We adopt a filtering methodology similar to the Visa Onchain Analytics Dashboard but focus more specifically on explicitly labeling transactions as payments.
The second method relies on company survey data and has been applied in the "Fireblocks 2025 State of Stablecoins Report" and the "Stablecoin Payments from Scratch Report." These reports use disclosed information from leading blockchain payment companies to estimate direct stablecoin usage in payments. In particular, the "Stablecoin Payments from Scratch Report" provides overall estimates of stablecoin payment volumes and categorizes these payments into B2B (business-to-business), B2C (business-to-consumer), P2P (peer-to-peer), and others. The report shows that as of February 2025, the annual settlement value was approximately $72.3 billion, with the majority being B2B transactions.
The main contribution of this study lies in applying a data filtering method to estimate stablecoin usage in on-chain payments. The findings reveal patterns in stablecoin usage and offer more accurate estimations. Additionally, we provide guidance for researchers on using data filtering methods to process raw blockchain data, reduce noise, and improve estimation accuracy.
2. Data
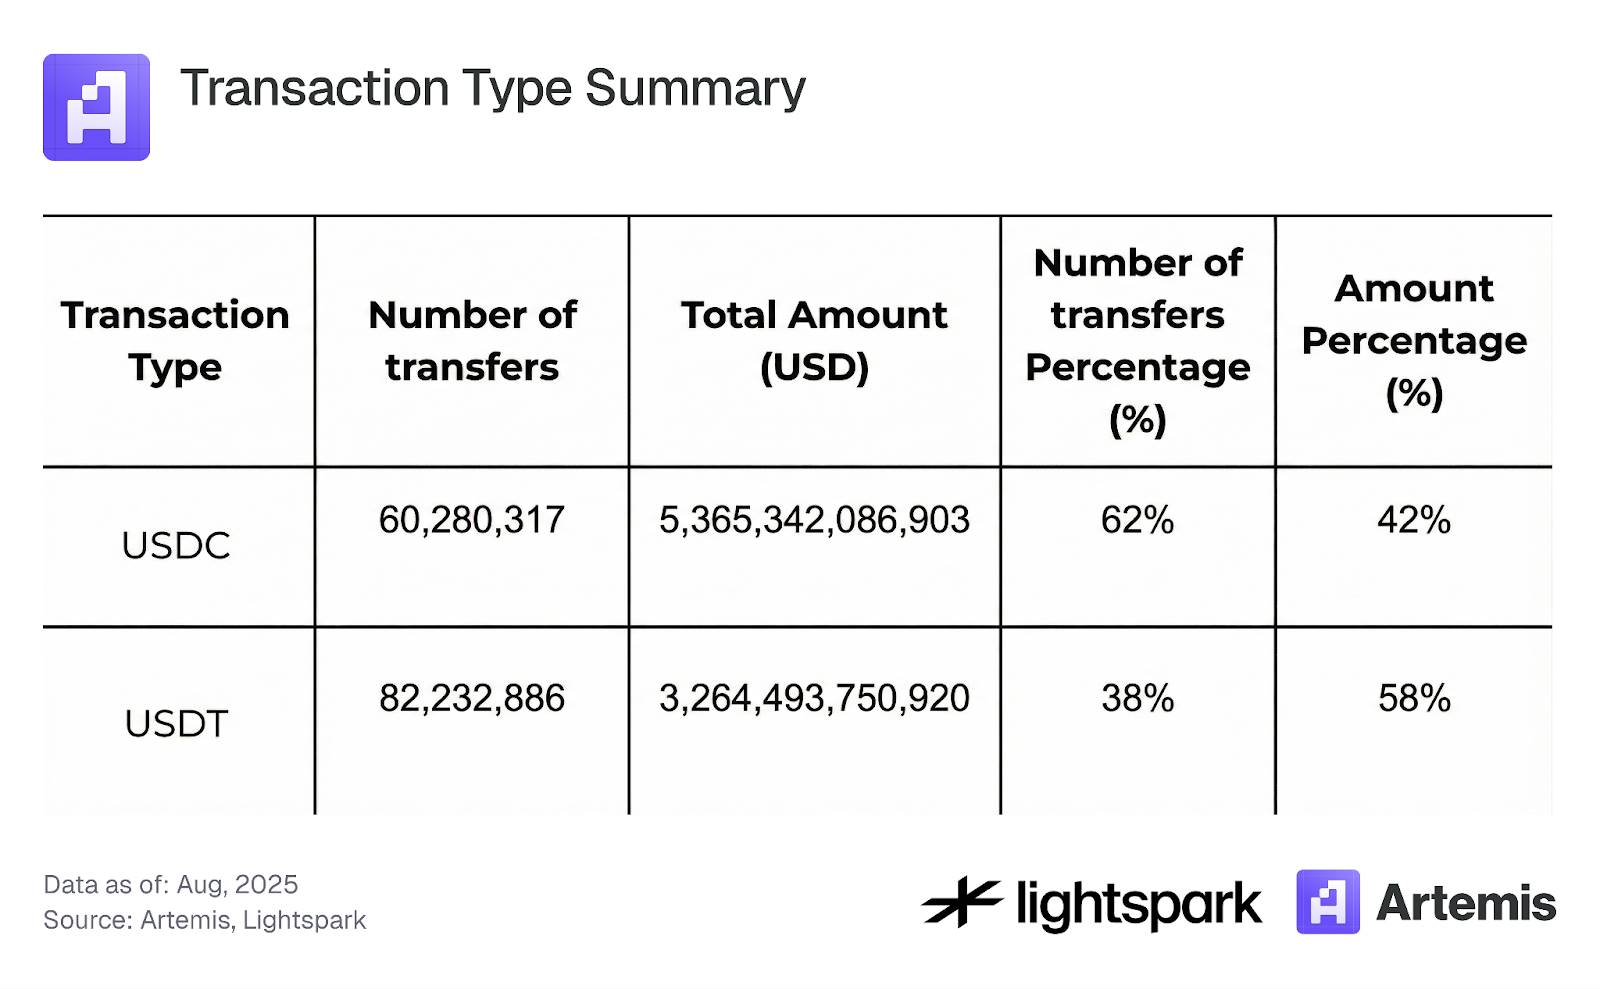
Our dataset covers all stablecoin transactions on the Ethereum blockchain from August 2024 to August 2025. The analysis focuses on transactions involving the two major stablecoins USDC and USDT. These two were selected due to their high market share and strong price stability, reducing noise in the analysis. We focus only on transfer transactions, excluding minting, burning, or bridging transactions. Table 1 summarizes the overall characteristics of our dataset used for analysis.
Table 1: Transaction Type Summary
3. Methodology and Results
In this section, we detail the methodology used to analyze stablecoin usage, focusing on payment transactions. First, we filter the data by distinguishing transactions involving interactions with smart contracts from those representing transfers between EOAs (externally owned accounts), classifying the latter as payment transactions. This process is described in detail in Section 3.1. Then, Section 3.2 explains how EOA account label data provided by Artemis is used to further classify payment transactions into P2P, B2B, B2P, P2B, and internal B categories. Finally, Section 3.3 analyzes the concentration of stablecoin transactions.
3.1 Stablecoin Payments (EOA) vs Smart Contract Transactions
In decentralized finance (DeFi), many transactions involve interactions with smart contracts and combine multiple financial operations within a single transaction, such as swapping one token for another through multiple liquidity pools. This complexity makes analyzing stablecoin usage specifically for payments more difficult.
To simplify analysis and enhance the ability to tag stablecoin blockchain transactions as payments, we define stablecoin payments as any ERC-20 stablecoin transfer from one EOA address to another EOA address (excluding minting and burning transactions). Any transaction not labeled as a payment is categorized as a smart contract transaction, including all transactions involving interaction with smart contracts (primarily DeFi transactions).
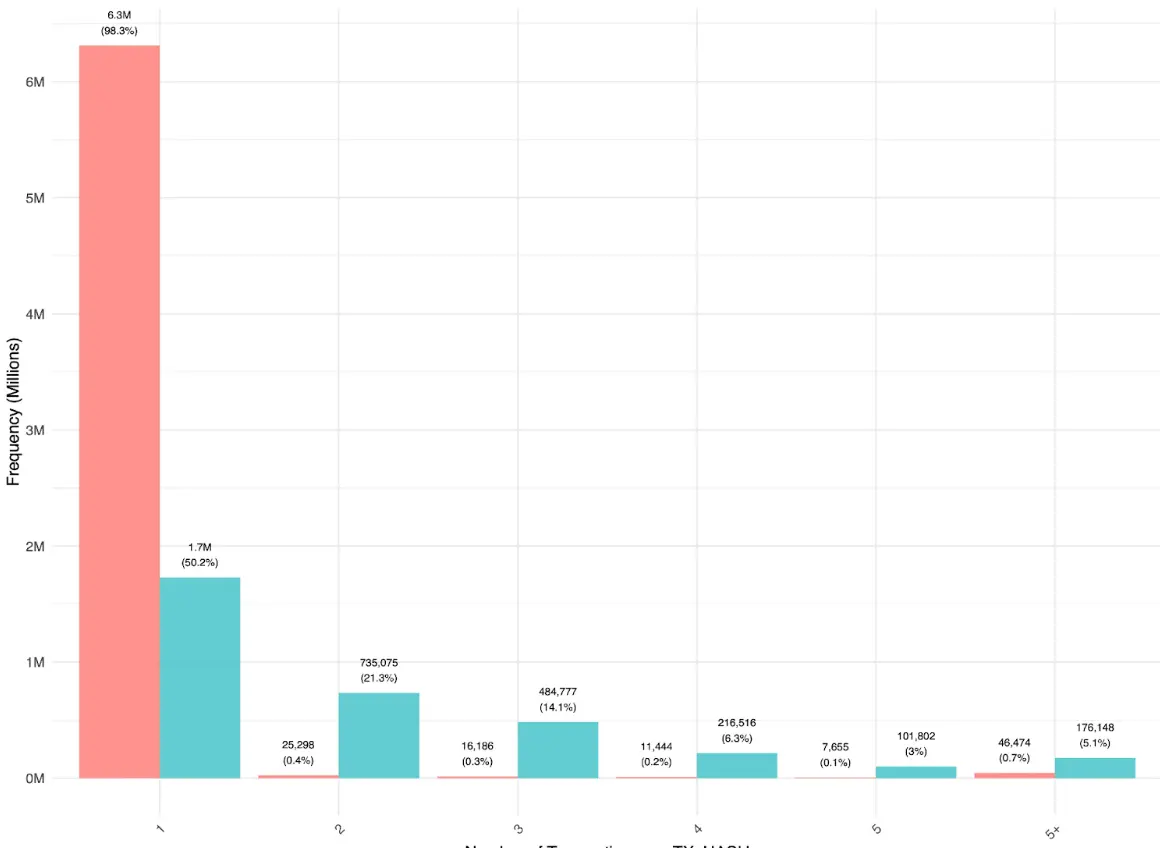
Figure 1 shows that most user-to-user payments (EOA-EOA) are conducted directly, with each transaction hash corresponding to a single transfer. Some multi-EOA-EOA transfers within the same transaction hash are mainly executed via aggregators, indicating that aggregator usage in simple transfers remains limited. In contrast, the distribution of smart contract transactions differs, containing more multi-transfer transactions. This suggests that in DeFi operations, stablecoins often flow across different applications and routers before ultimately returning to an EOA account.
Figure 1:
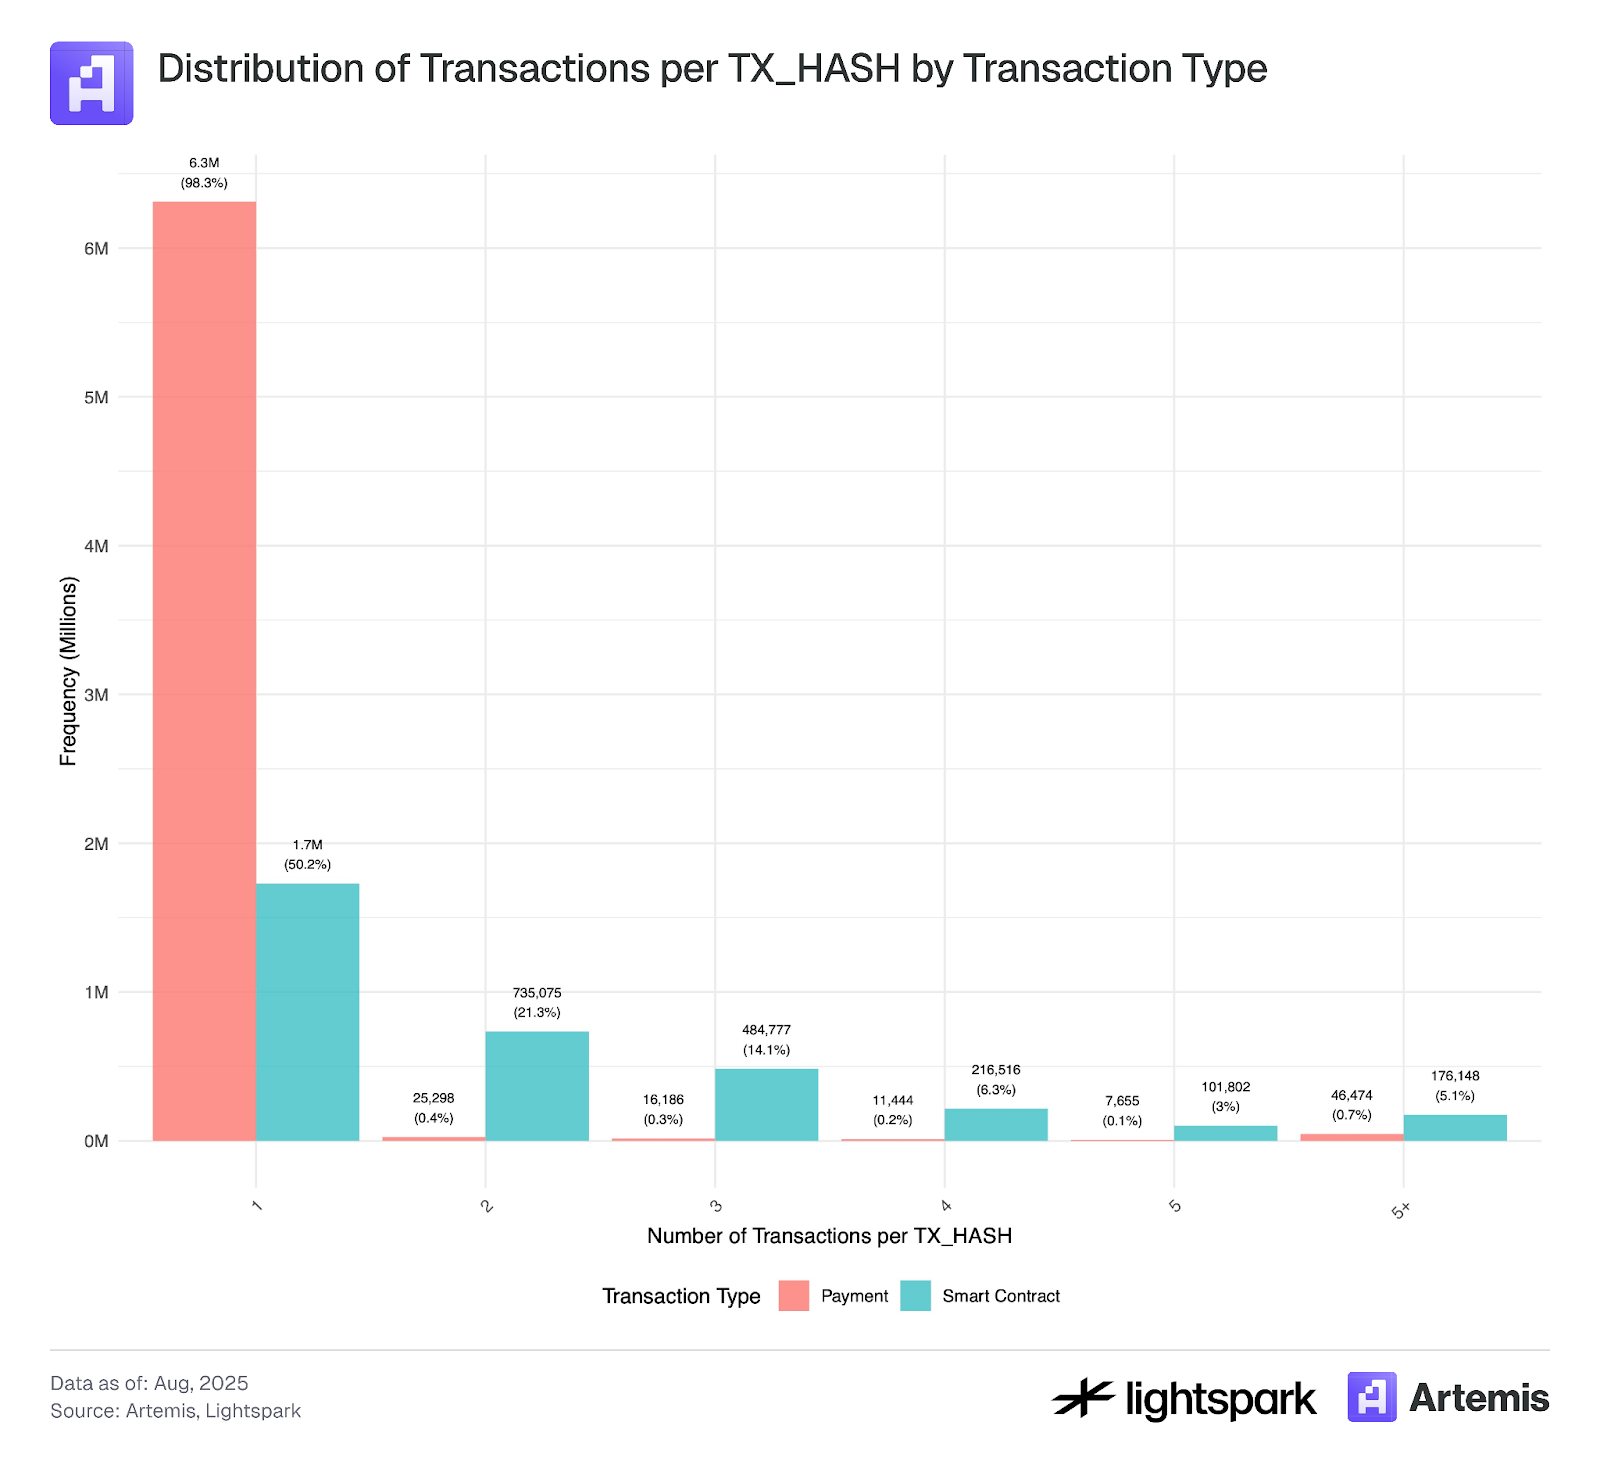
*The sample data for this analysis covers transactions from July 4, 2025 to July 31, 2025.
Table 2 and Figure 2 show that in terms of transaction count, payments (EOA-EOA) and smart contract transactions (DeFi) are roughly split 50:50, while smart contract transactions account for 53.2% of transaction volume. However, Figure 2 shows that transaction volume (total transferred amount) exhibits greater volatility than transaction count, suggesting that large institutional EOA-EOA transfers are primarily responsible for these fluctuations.
Table 2: Transaction Type Summary
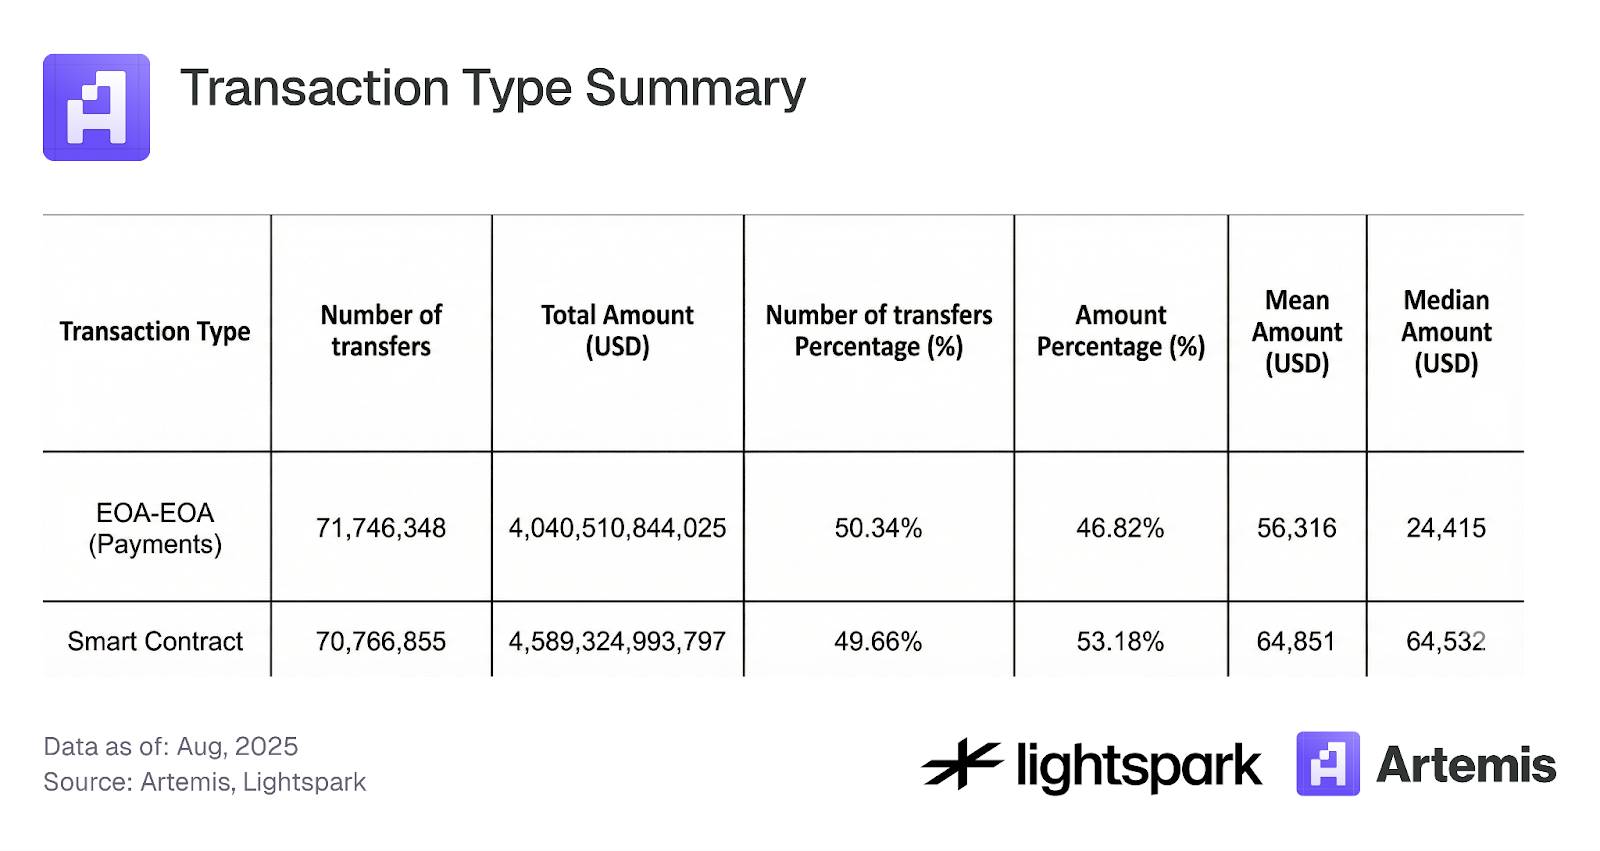
Figure 2:
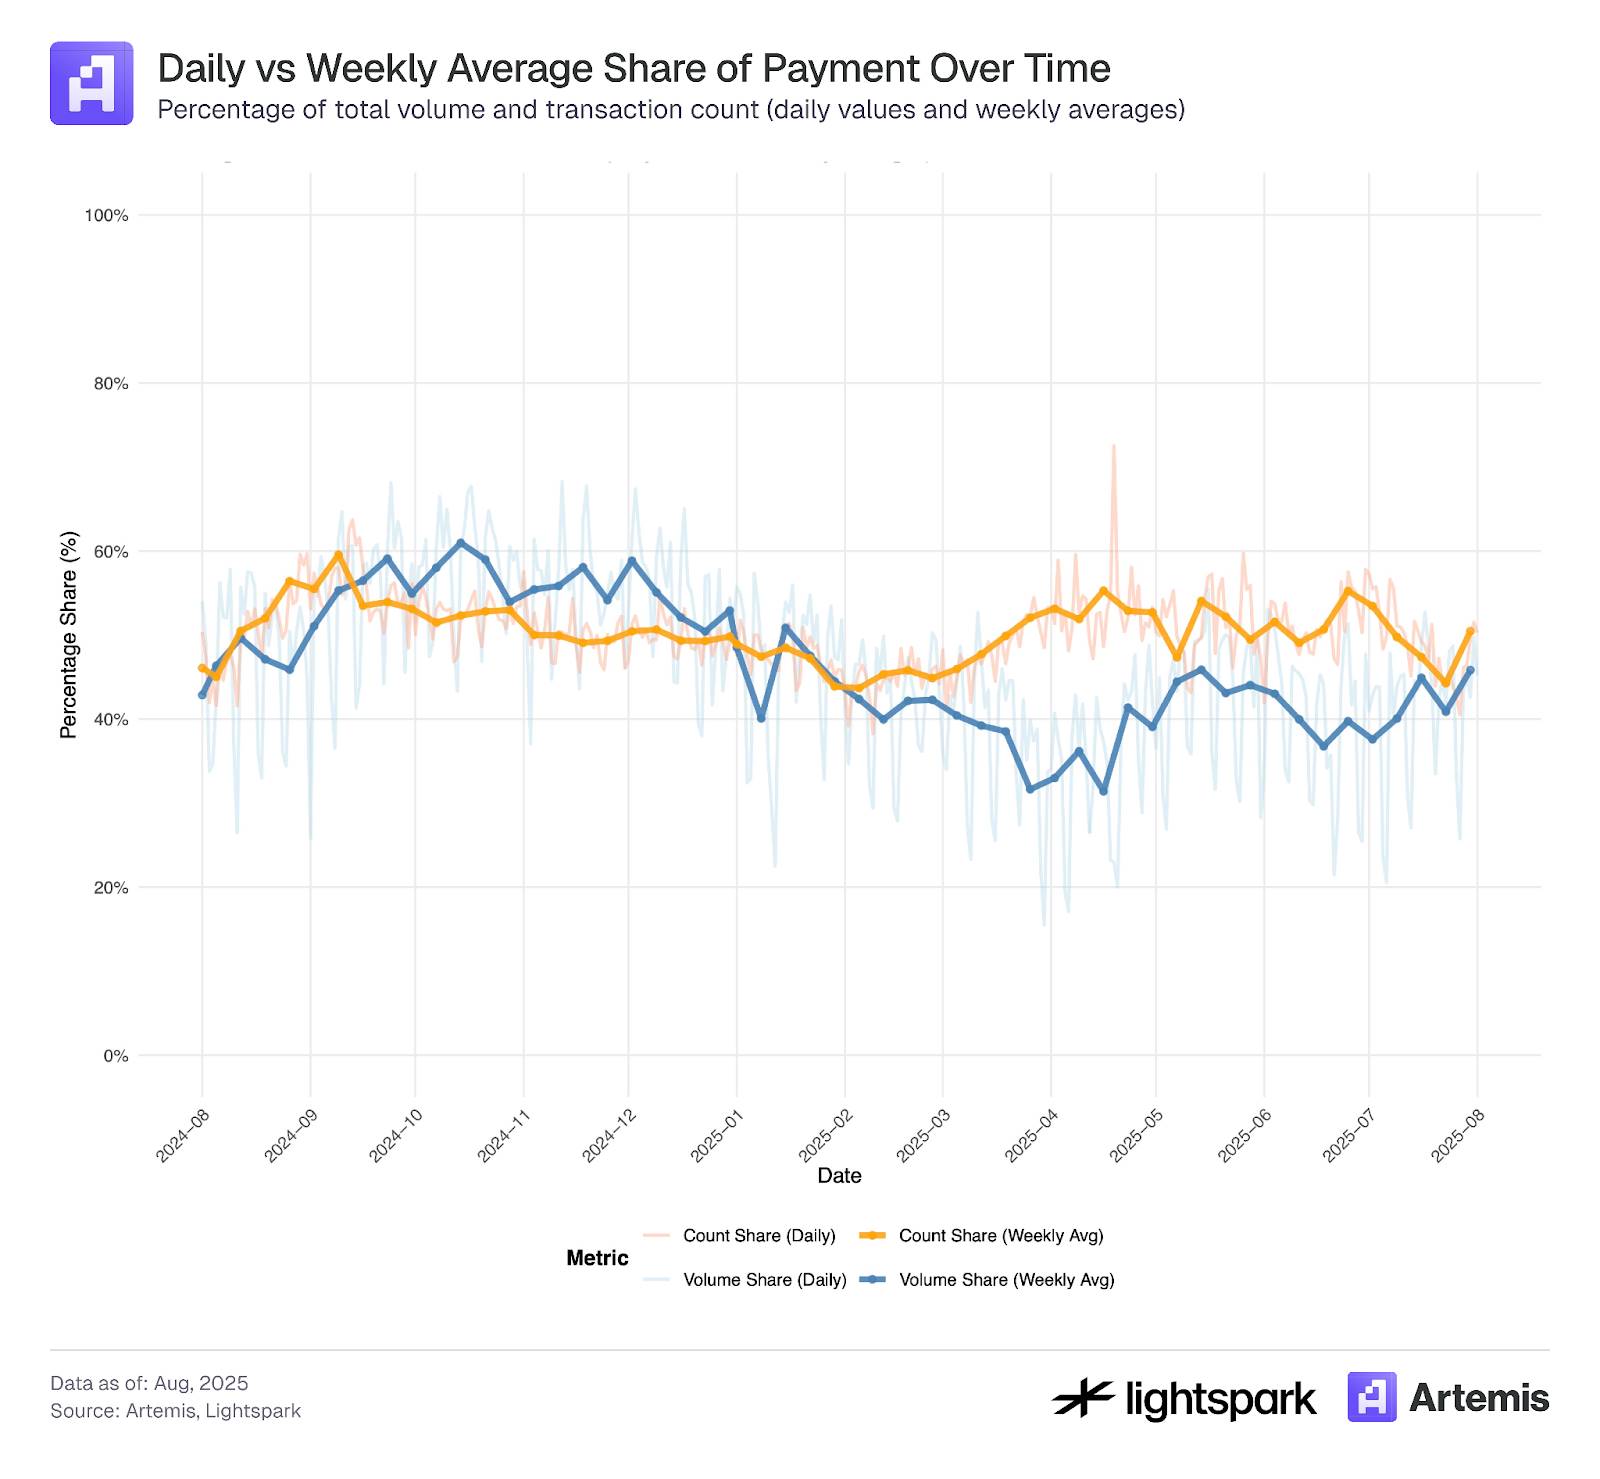
Figure 3 explores the transaction amount distribution between payments (EOA-EOA) and smart contract transactions. Both payment and smart contract transaction amount distributions resemble heavy-tailed normal distributions, with averages ranging from approximately $100 to $1,000.
However, a significant peak appears in transactions below $0.10, which may indicate bot activity or transaction manipulation related to fake and wash trading activities—consistent with descriptions by Halaburda et al. (2025) and Cong et al. (2023).
Given that Ethereum gas fees typically exceed $0.10, transactions below this threshold require careful scrutiny and may need to be excluded from analysis.
Figure 3:
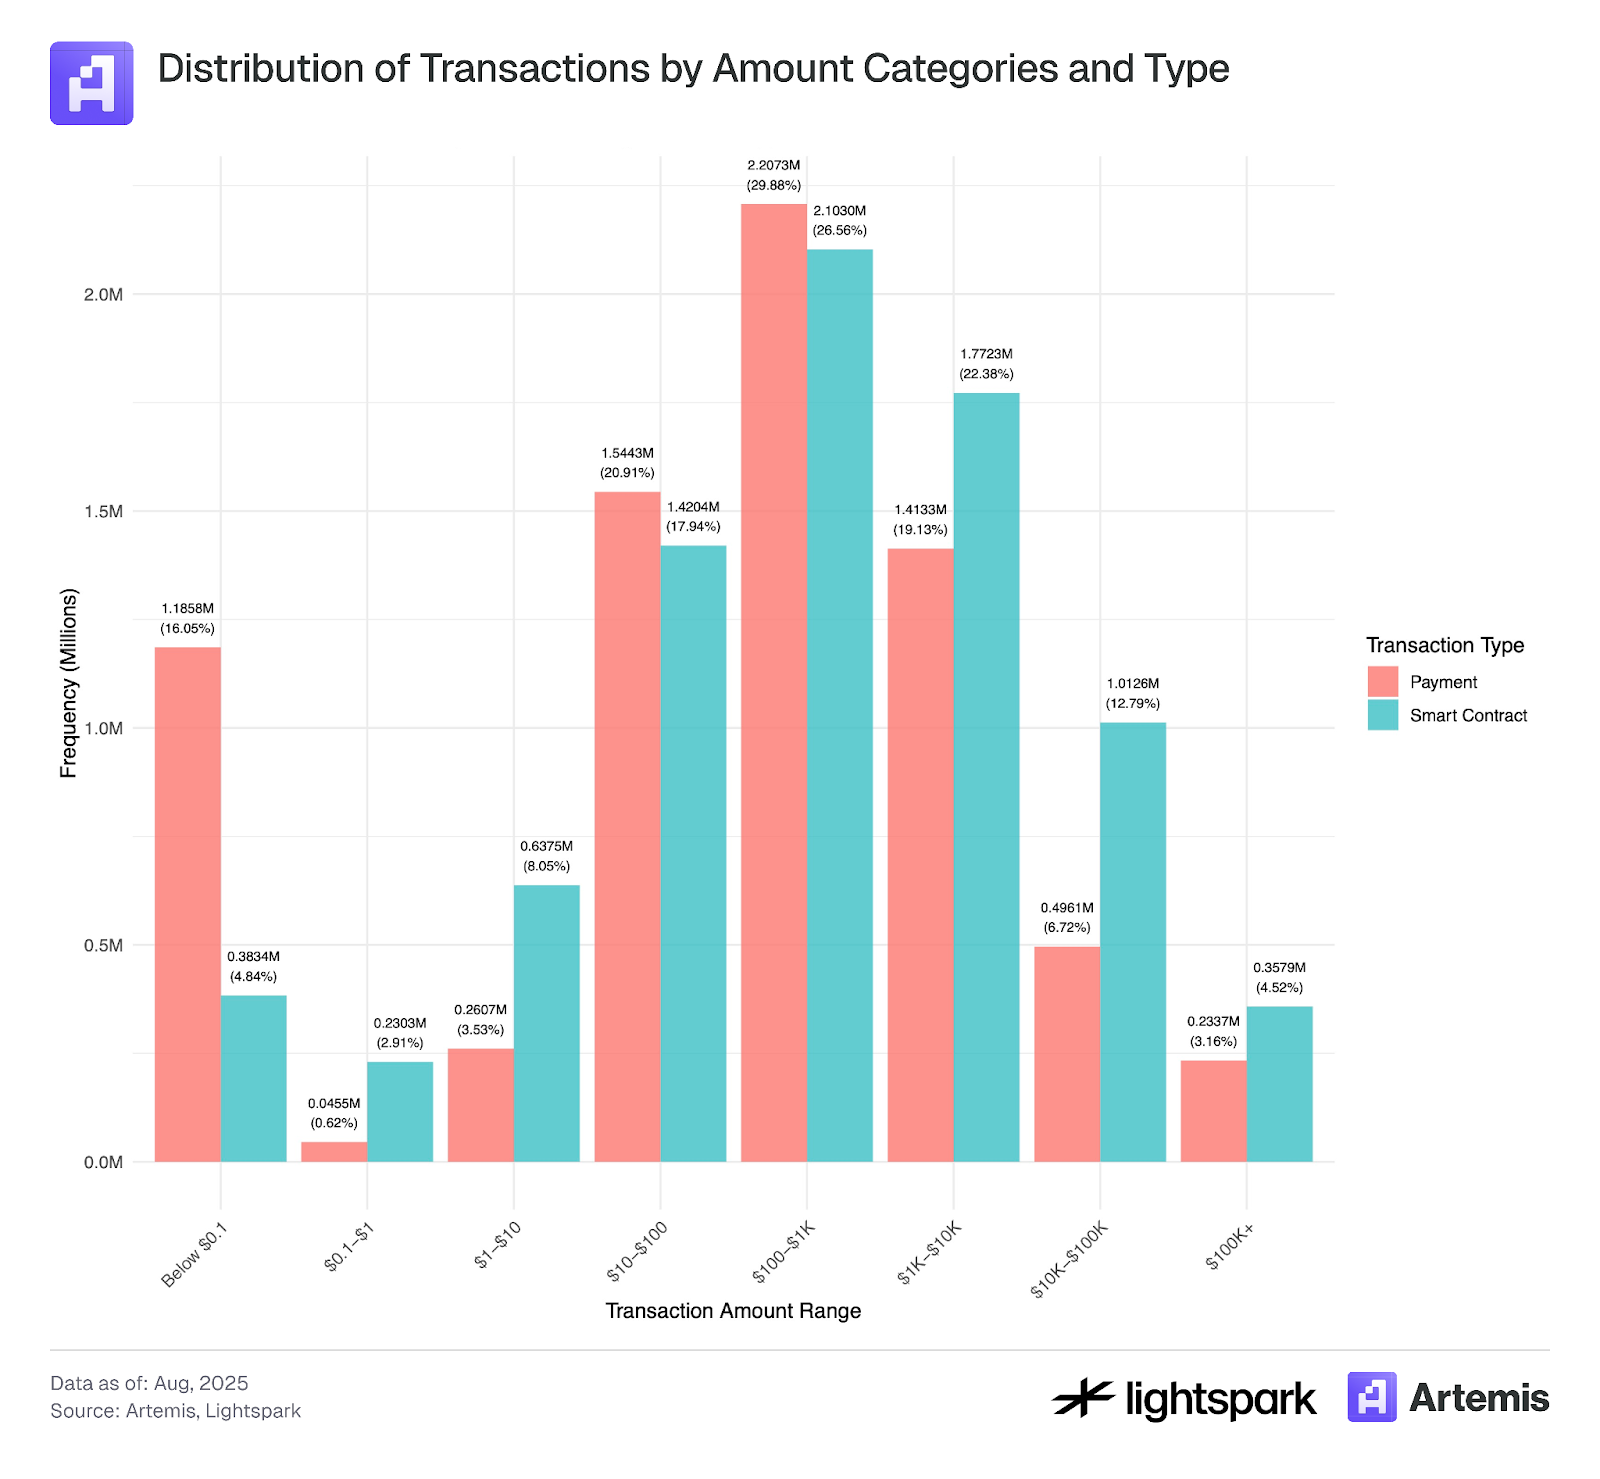
The sample data used in this analysis covers transaction records from July 4, 2025 to July 31, 2025.
3.2 Payment Types
Using label information provided by Artemis, further analysis of payments between two EOAs (externally owned accounts) is possible. Artemis provides labeling for many Ethereum wallet addresses, enabling identification of wallets owned by institutions (e.g., Coinbase). We classify payment transactions into five categories: P2P, B2B, B2P, P2B, and internal B. Below are detailed descriptions of each category.
P2P Payments:
P2P (peer-to-peer) blockchain payments refer to transactions where funds are directly transferred from one user to another via the blockchain network. In account-based blockchains like Ethereum, such P2P transactions are defined as the process of transferring digital assets from one user's wallet (an EOA account) to another user's EOA wallet. All transactions are recorded and verified on the blockchain without requiring intermediary institutions.
Main challenges:
A primary challenge is identifying whether a transaction between two wallets in an account system truly occurs between two independent entities (i.e., individuals rather than companies) and correctly classifying it as a P2P transaction. For example, transfers between a user's own accounts (i.e., Sybil accounts) should not be counted as P2P transactions. However, if we simply define all EOA-to-EOA transactions as P2P, such transfers may be incorrectly classified as P2P.
Another issue arises when an EOA account is owned by a company—for instance, a centralized exchange (CEX) like Coinbase—in which case the EOA wallet is not actually owned by a real individual. In our dataset, we can label many institutional and corporate EOA wallets; however, due to incomplete labeling, some EOA wallets owned by companies but unrecorded in our dataset may be mistakenly labeled as personal wallets.
Finally, this method cannot capture blockchain P2P payments processed through intermediaries—also known as the "stablecoin sandwich" model. In this model, funds are transferred between users via intermediaries that use blockchain for settlement. Specifically, fiat currency is first sent to an intermediary, converted into cryptocurrency, then transferred across the blockchain network, and finally converted back into fiat by the recipient’s intermediary (which could be the same or a different entity). The blockchain transfer forms the "middle layer" of the "sandwich," while the fiat conversions constitute the "outer layers." The main challenge in identifying these transactions is that they are executed by intermediaries who may bundle multiple transactions to reduce gas fees. As a result, key data such as exact transaction amounts and the number of involved users are only available on the intermediary's platform.
B2B Payments:
Business-to-business (B2B) transactions refer to electronic fund transfers from one business to another via the blockchain network. In our dataset, stablecoin payments are defined as transfers between two known institutional EOA wallets, such as from Coinbase to Binance.
Internal B Payments:
Transactions between two EOA wallets belonging to the same institution are labeled as internal B transactions.
P2B (or B2P) Payments:
Peer-to-business (P2B) or business-to-peer (B2P) transactions refer to electronic fund transfers between individuals and businesses, which can occur in either direction.
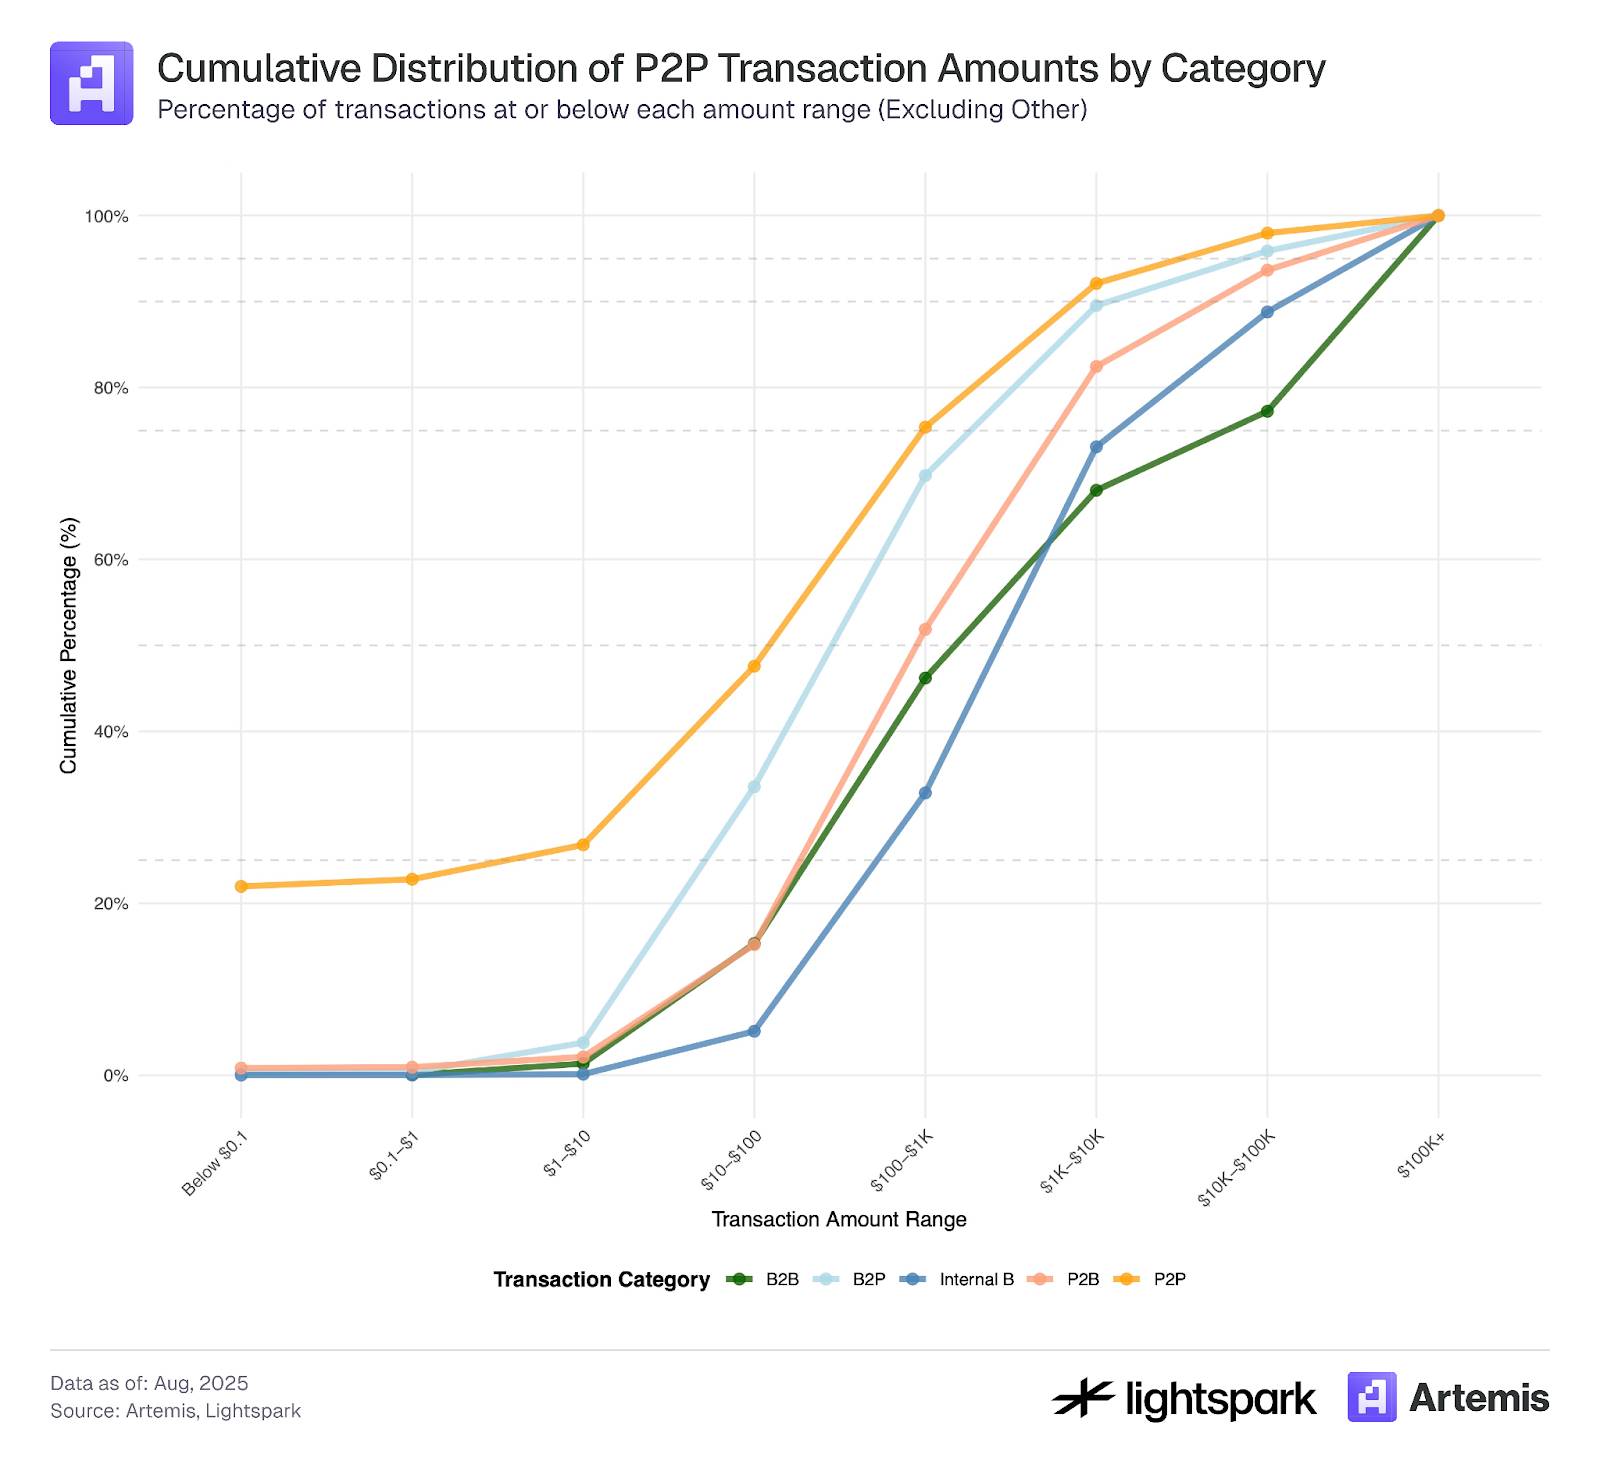
Using this labeling method, we analyzed payment data (limited to EOA-EOA transfers), with main results summarized in Table 3. The data shows that 67% of EOA-EOA transactions fall under the P2P category, yet they account for only 24% of total payment volume. This further indicates that P2P users have lower average transfer amounts compared to institutional users. Moreover, one of the highest-volume payment categories is internal B, meaning intra-organizational transfers constitute a significant portion. Exploring the specific implications of internal B transactions and how to account for them in payment activity analysis remains an interesting area for further research.
Table 3: Transaction Distribution by Payment Category

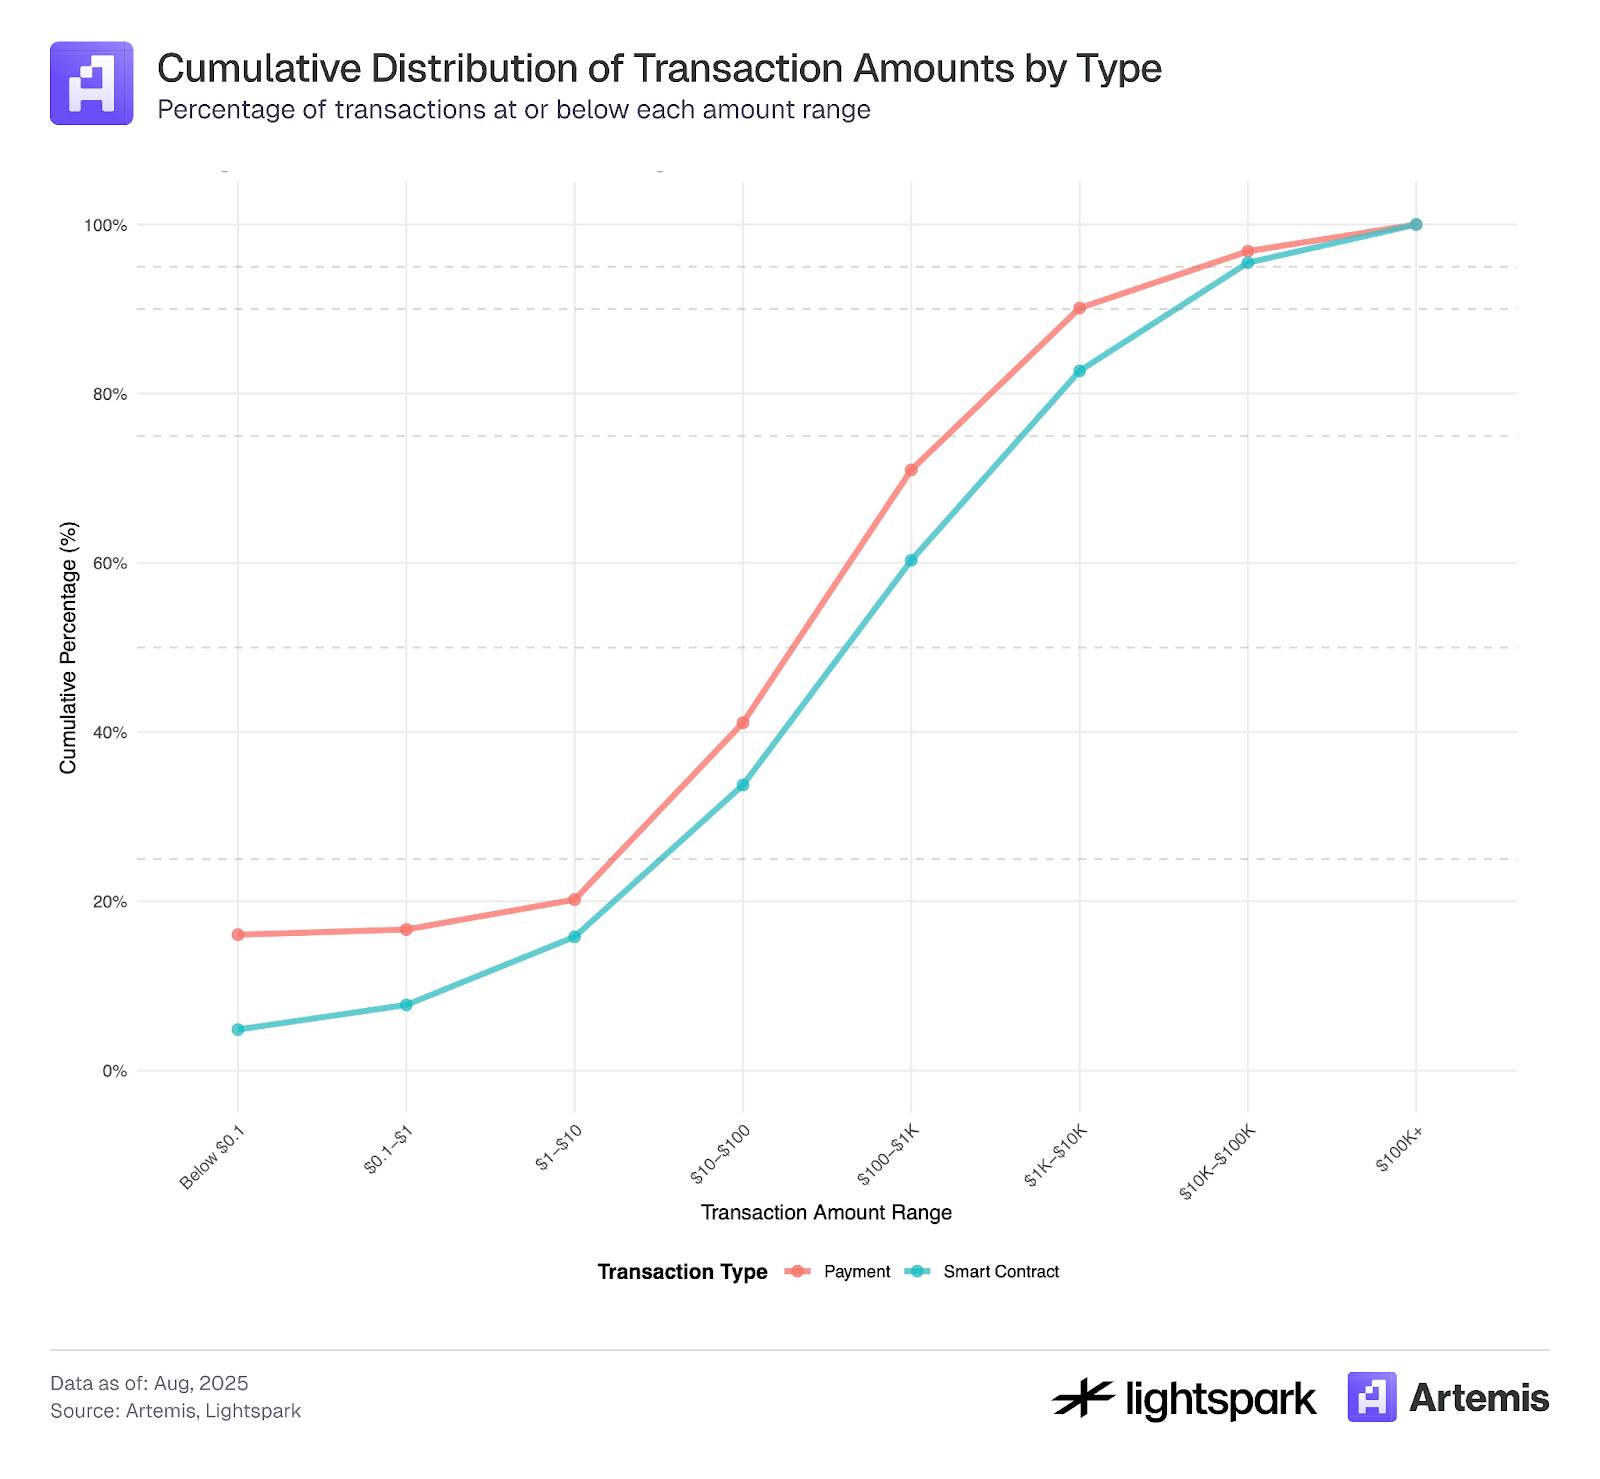
Finally, Figure 4 shows the cumulative distribution function (CDF) of transaction amounts by payment category. The CDF clearly reveals distinct differences in transaction amount distributions across categories. Most sub-$0.10 transactions among EOA-EOA accounts are of the P2P type, further suggesting these transactions are likely driven more by bots and manipulated wallets rather than institutions tagged in our dataset. Additionally, the P2P transaction CDF further supports the view that most transactions involve small amounts, while the CDFs for B2B and internal B transactions show significantly higher transaction values. Lastly, the CDFs for P2B and B2P transactions lie between those of P2P and B2B.
Figure 4:
The sample data for this analysis covers transaction records from July 4, 2025 to July 31, 2025.
Figures 5 and 6 illustrate temporal trends across each payment category.
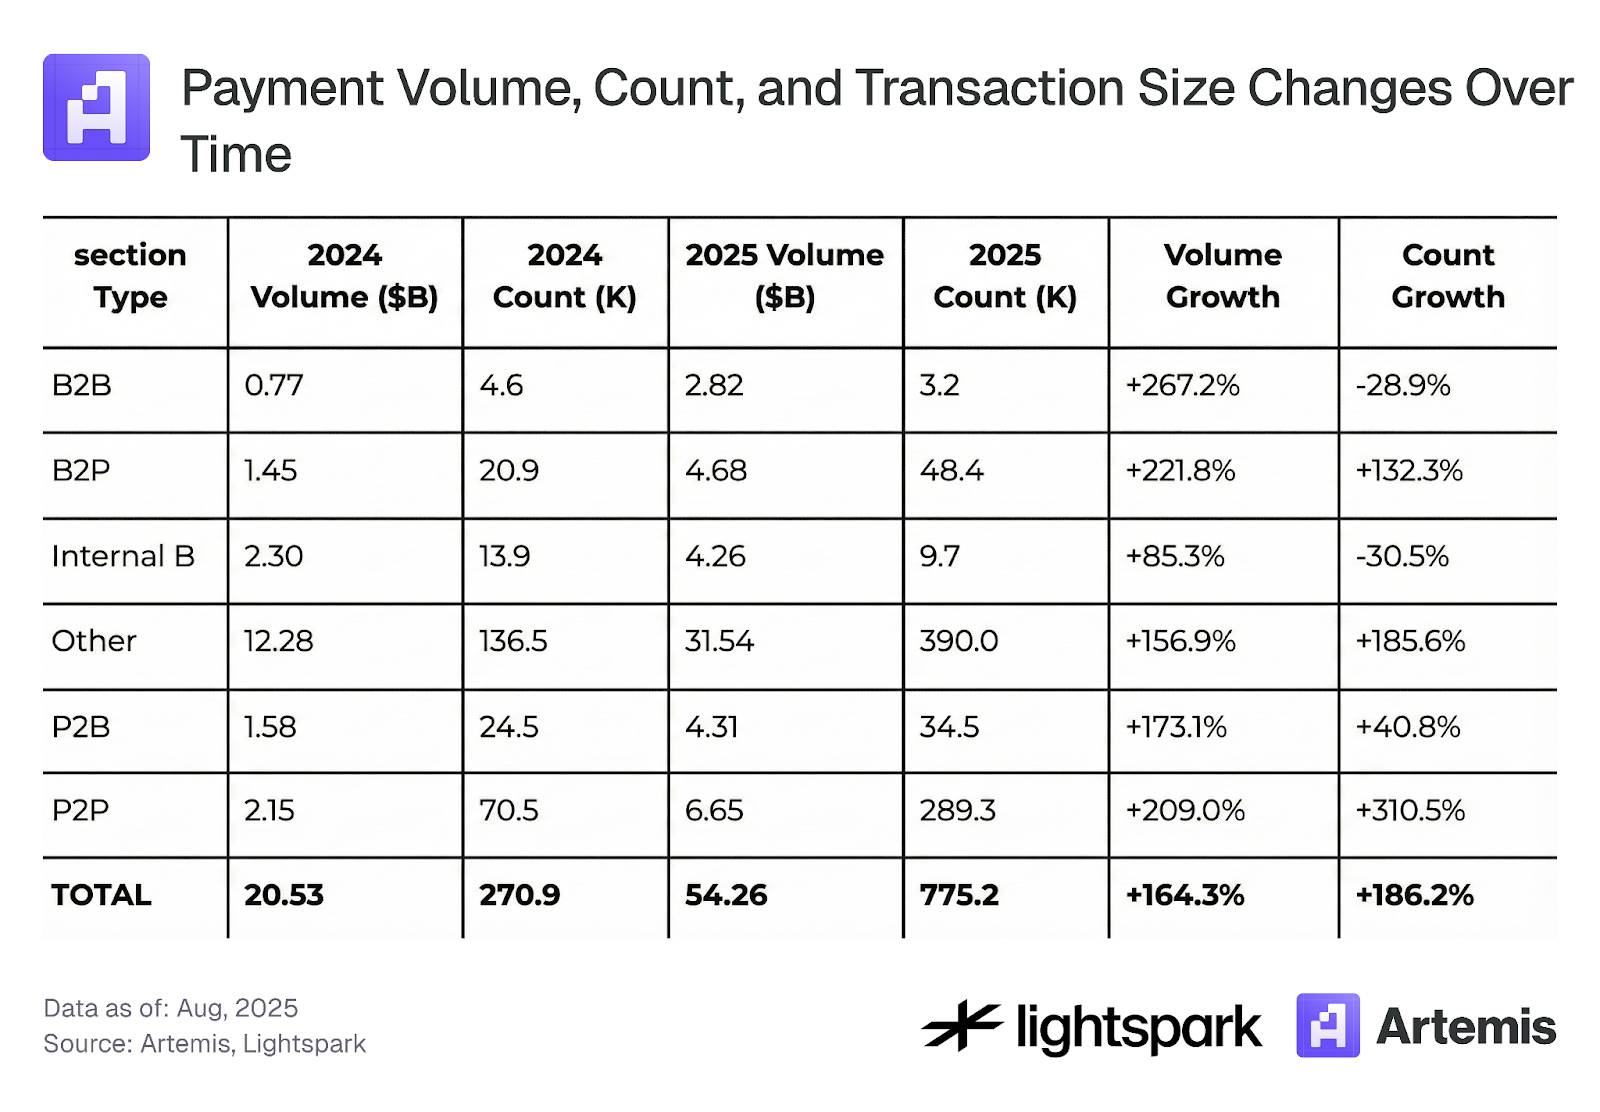
Figure 5 focuses on weekly changes, showing consistent adoption trends and increasing weekly transaction volumes across all categories. Table 4 further summarizes overall changes from August 2024 to August 2025.
In addition, Figure 6 illustrates differences between weekday and weekend payments, clearly showing reduced payment volumes during weekends. Overall, payment usage across all categories shows increasing trends over time, both on weekdays and weekends.
Figure 5:
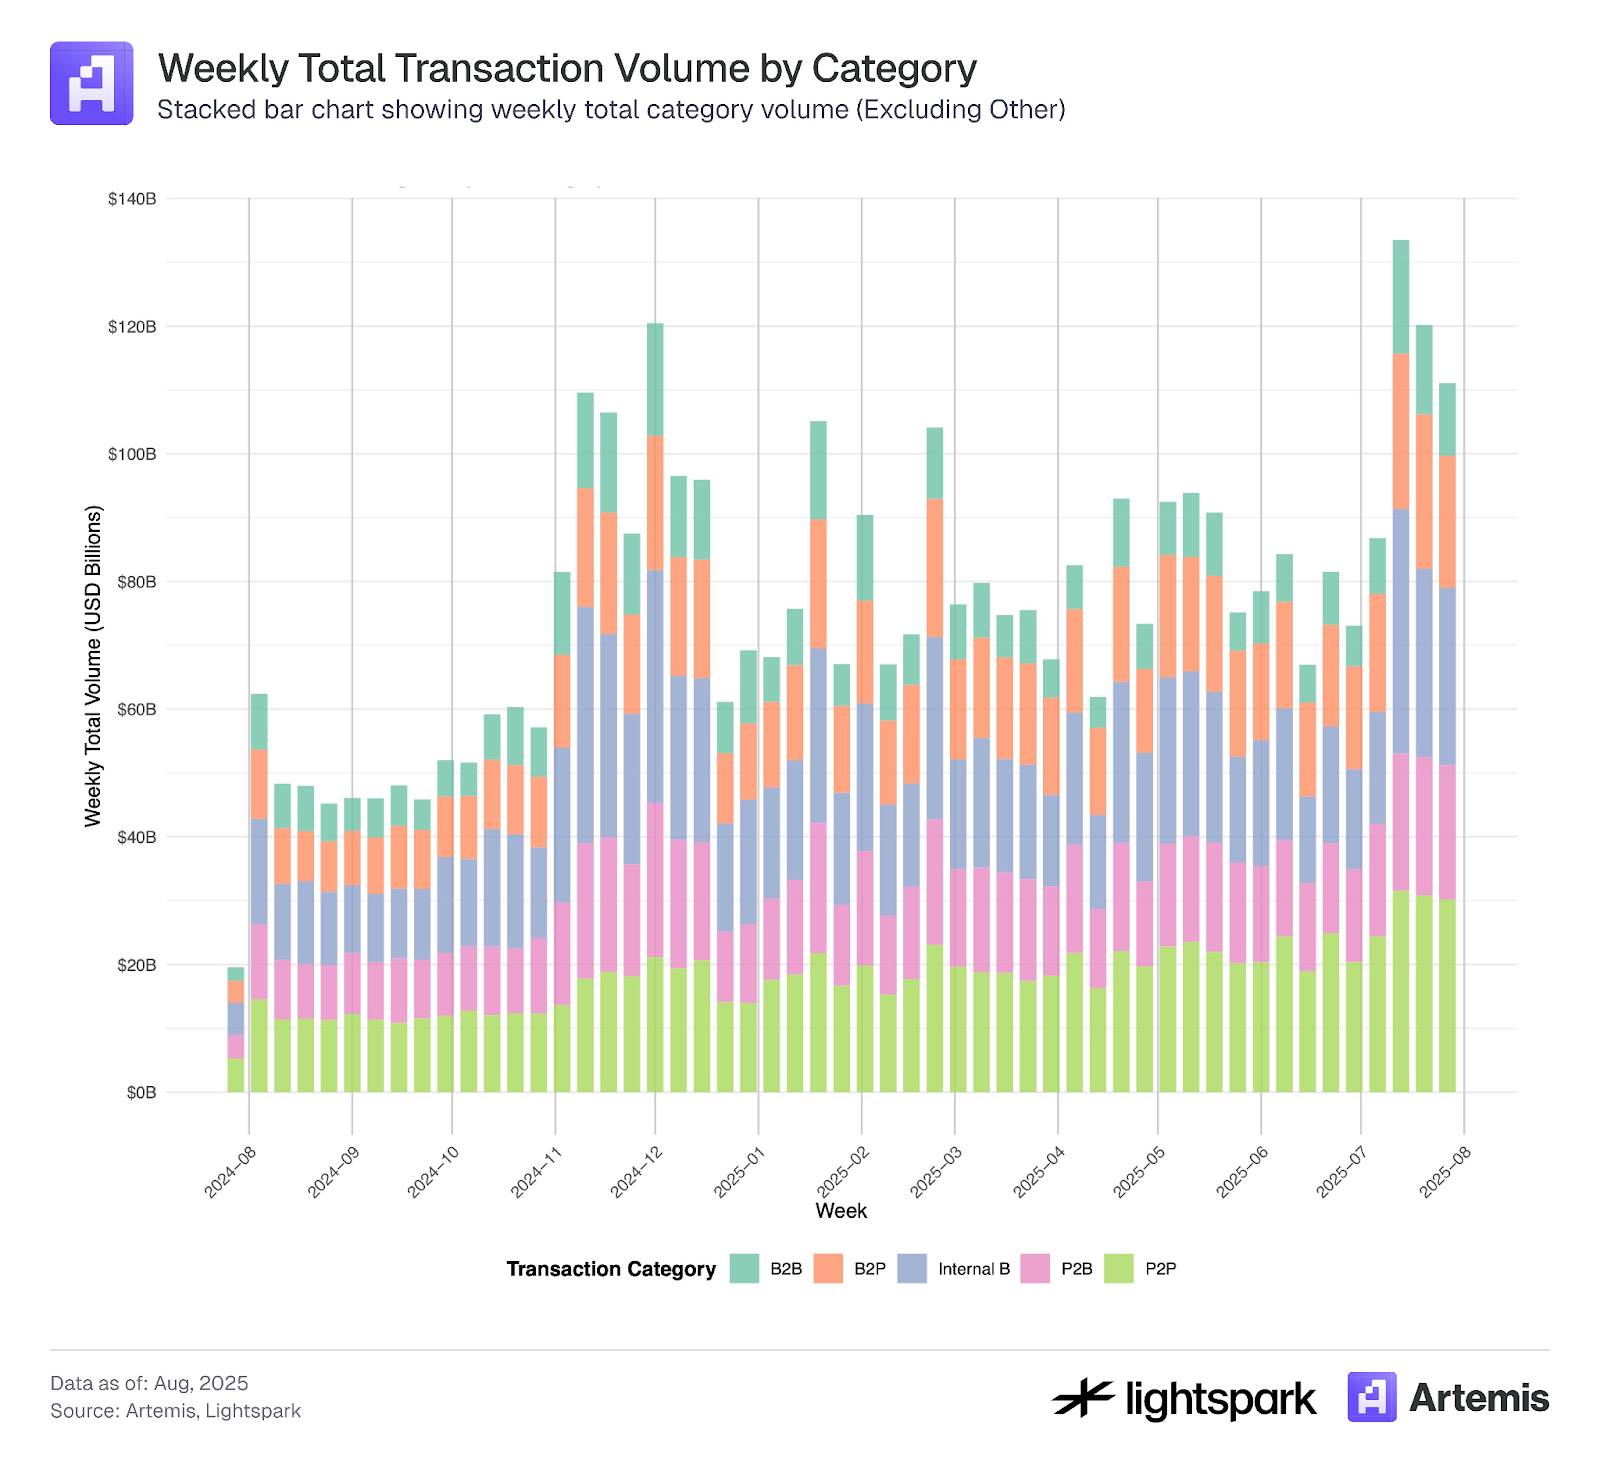
Figure 6:
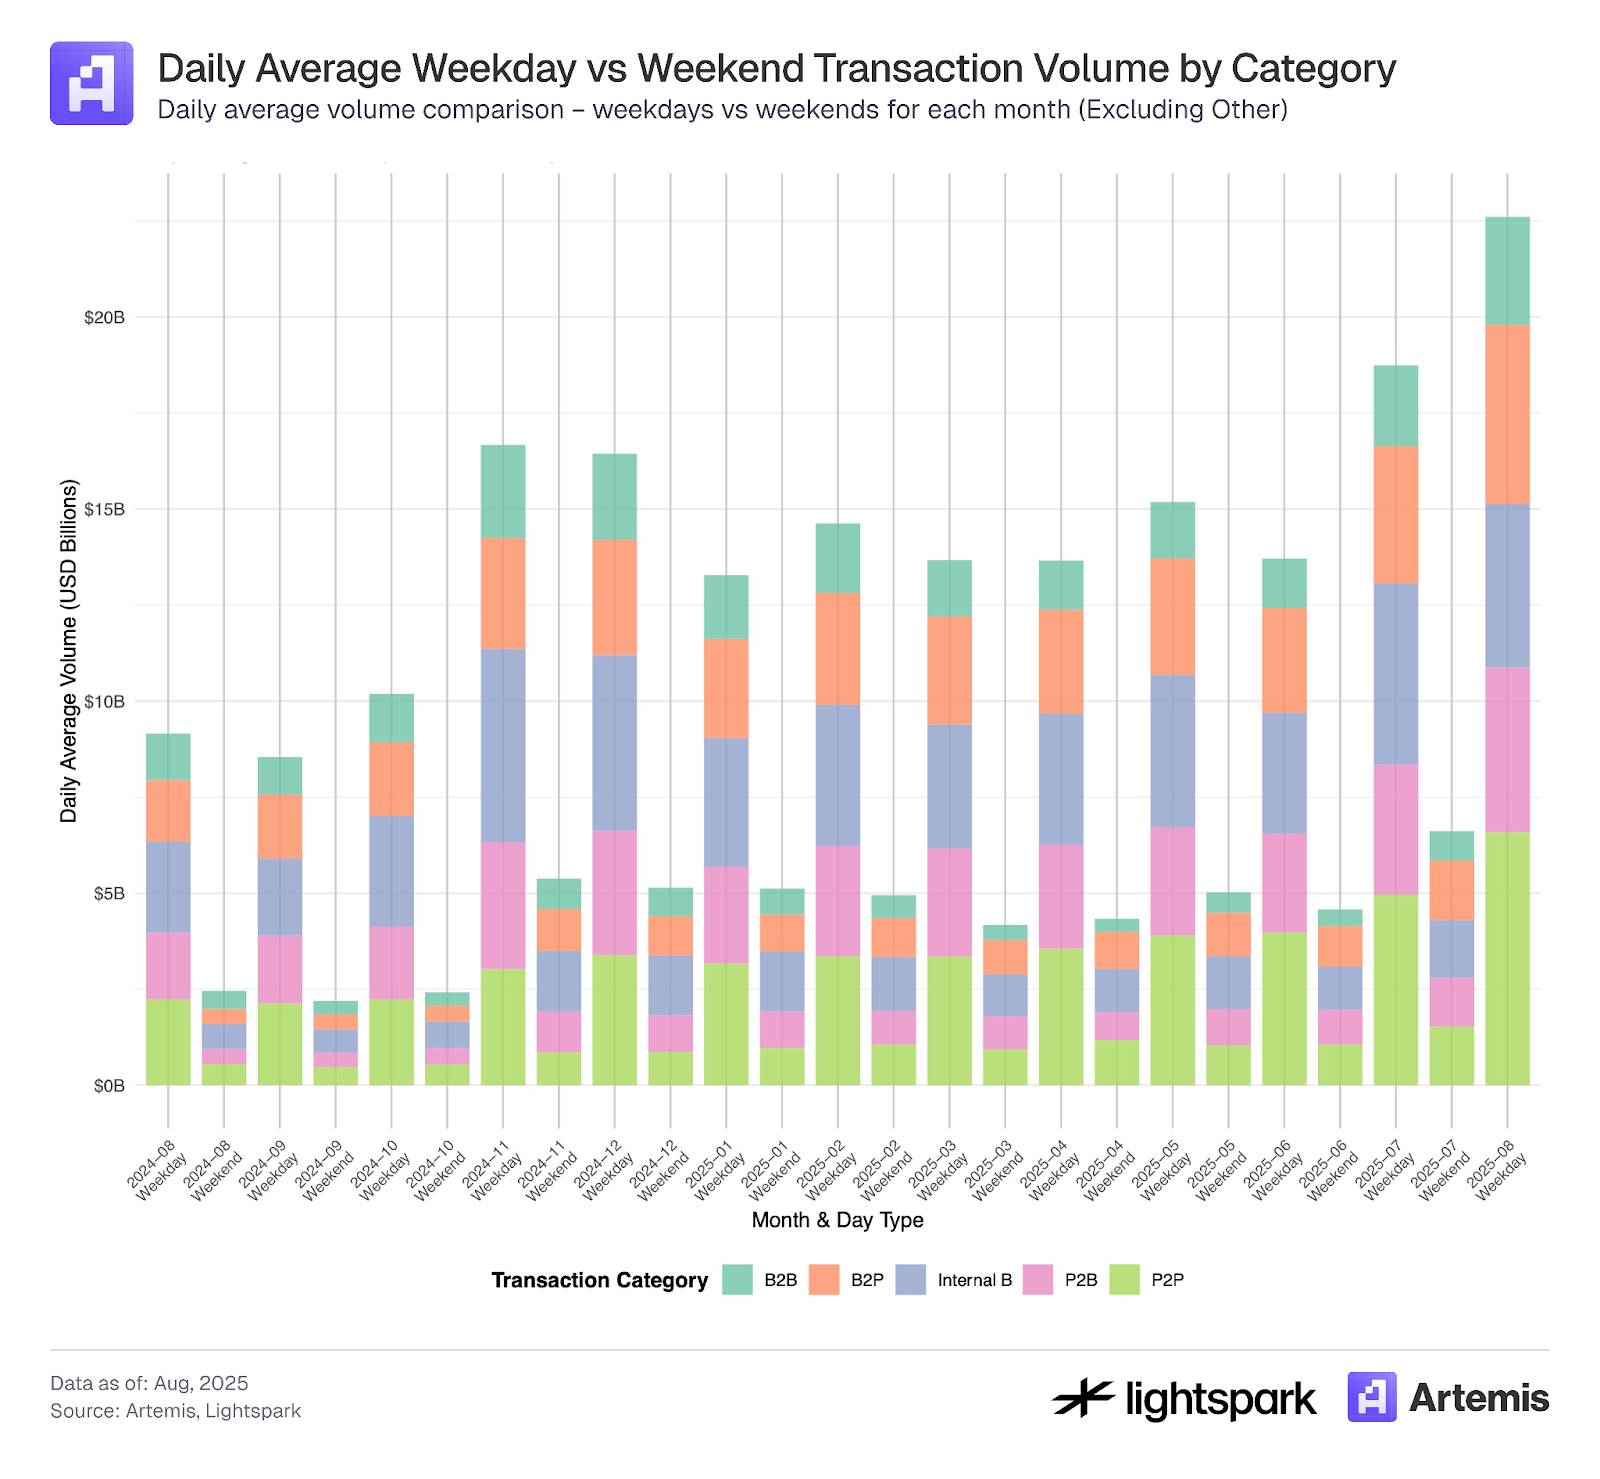
Table 4: Changes in Payment Volume, Transaction Count, and Transaction Amount Over Time
3.3 Concentration of Stablecoin Transactions
In Figure 9, we calculate the concentration of major sending wallets transmitting stablecoins via the Ethereum blockchain. Clearly, the majority of stablecoin transfer volume is concentrated among a small number of wallets. During our sample period, the top 1,000 wallets accounted for approximately 84% of transaction volume.
This indicates that despite DeFi and blockchain aiming to support and promote decentralization, certain aspects still exhibit high levels of centralization.
Figure 9:
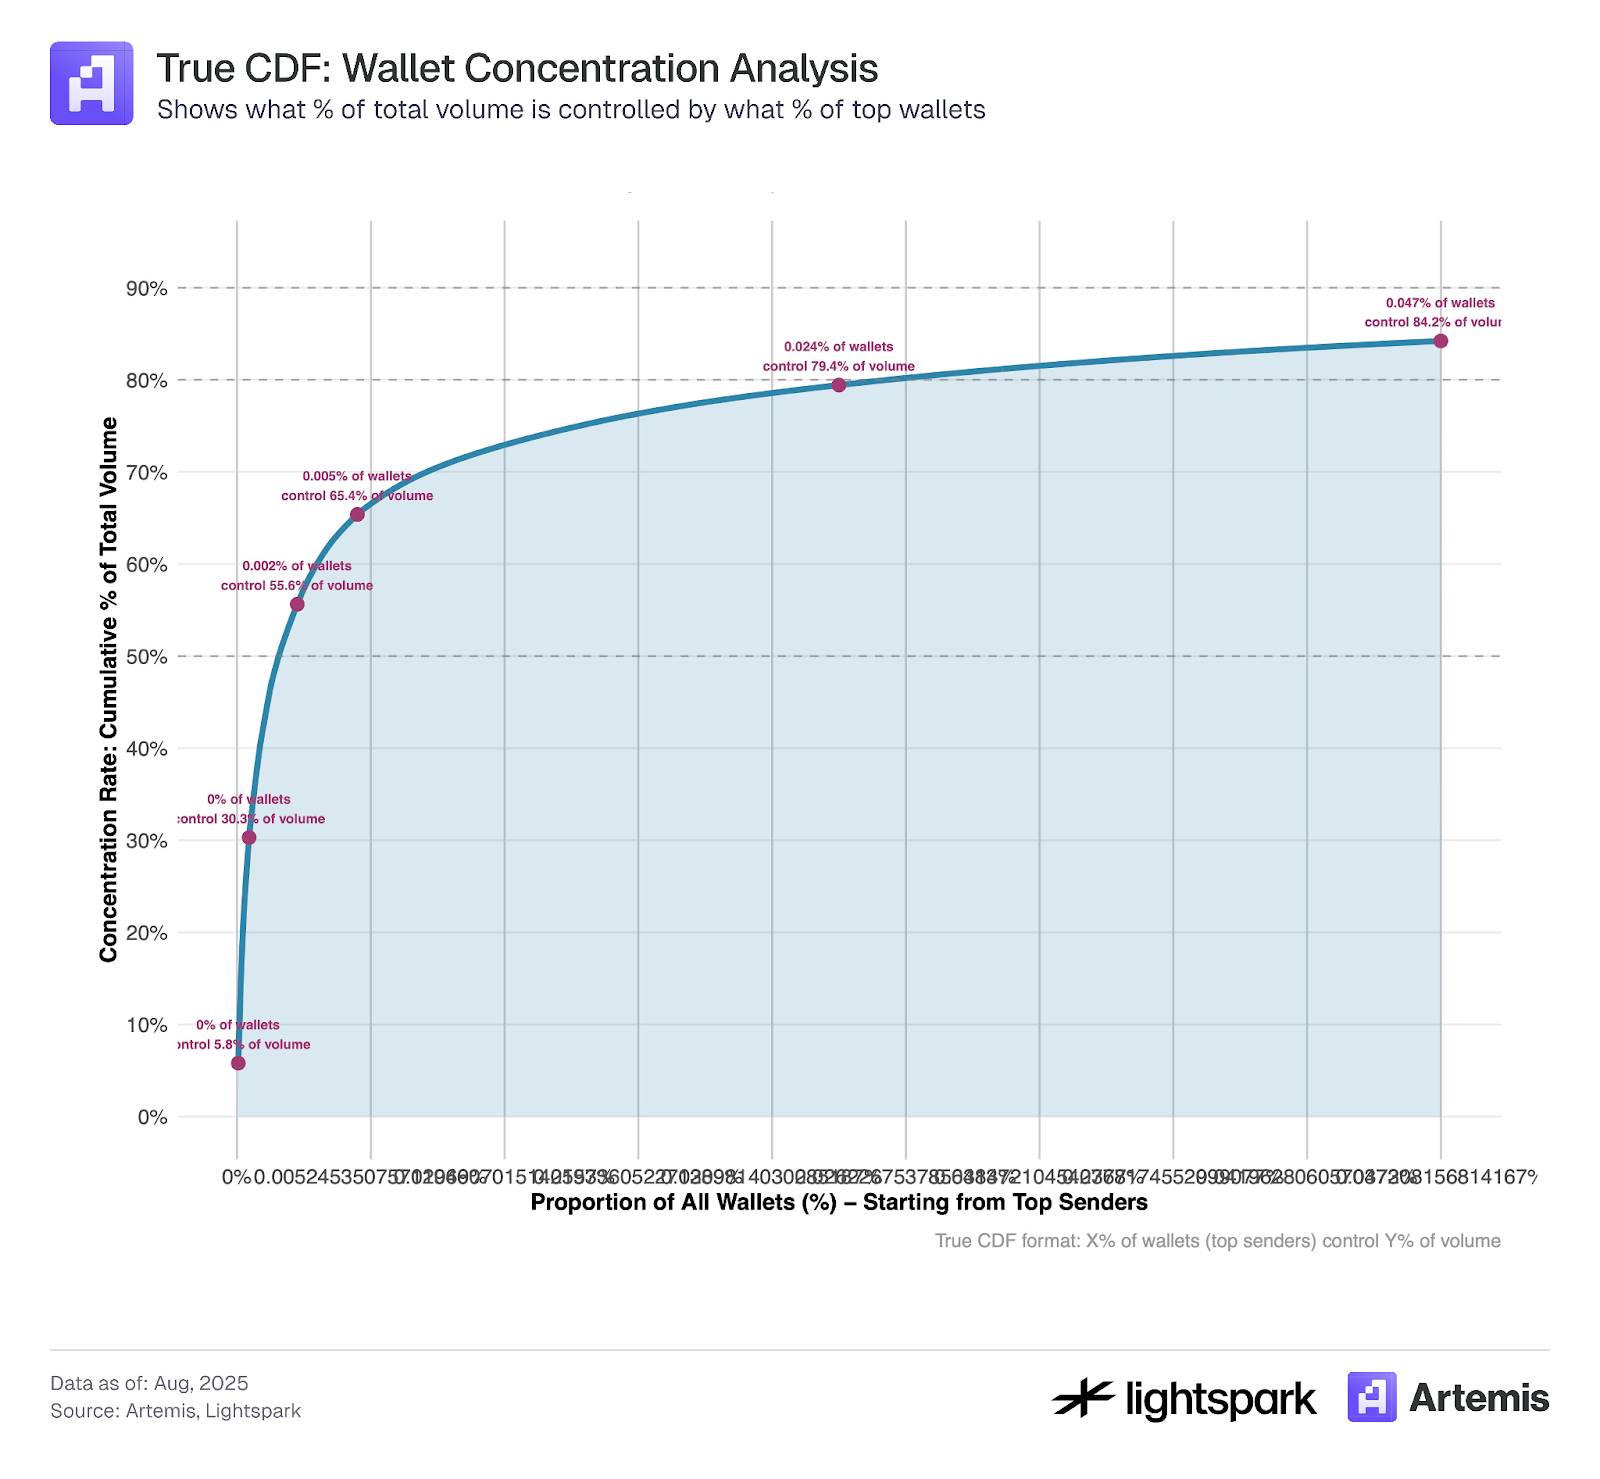
The sample data used in this analysis covers transaction records from July 4, 2025 to July 31, 2025.
4. Discussion
Clearly, stablecoin adoption is steadily increasing over time, with both transaction volume and count more than doubling between August 2024 and August 2025. Estimating stablecoin usage in payments is a challenging task, and an increasing number of tools are being developed to improve these estimates. This study leverages label data provided by Artemis to explore and estimate stablecoin payment usage recorded on the blockchain (Ethereum).
Our estimation results indicate that stablecoin payments account for 47% of total transaction volume (or 35% if internal B transactions are excluded). Since our payment classification criteria are relatively broad (mainly based on EOA-EOA transfers), this estimate can be considered an upper bound. However, researchers can apply additional filtering methods—such as transaction amount thresholds—based on their specific research objectives. For example, imposing a minimum threshold of $0.10 can help exclude low-value transaction manipulations mentioned in Section 3.1.
In Section 3.2, by further classifying payment transactions into P2P, B2B, P2B, B2P, and internal B types using Artemis label data, we found that P2P payments represent only 23.7% of total payment volume (all raw data) or 11.3% (excluding internal B transactions). Previous studies have suggested that P2P payments account for approximately 25% of stablecoin payments, and our results are closely aligned.
Finally, in Section 3.3, we observed that in terms of transaction volume, the majority of stablecoin transactions are concentrated among the top 1,000 wallets. This raises an interesting question: Will stablecoin usage evolve as a payment tool driven by intermediaries and large corporations, or as a peer-to-peer settlement mechanism? Time will tell.
References
-
Yaish, A., Chemaya, N., Cong, L. W., & Malkhi, D. (2025). Inequality in the Age of Pseudonymity. arXiv preprint arXiv:2508.04668.
-
Awrey, D., Jackson, H. E., & Massad, T. G. (2025). Stable Foundations: Towards a Robust and Bipartisan Approach to Stablecoin Legislation. Available at SSRN 5197044.
-
Halaburda, H., Livshits, B., & Yaish, A. (2025). Platform building with fake consumers: On double dippers and airdrop farmers. NYU Stern School of Business Research Paper Forthcoming.
-
Cong, L. W., Li, X., Tang, K., & Yang, Y. (2023). Crypto wash trading. Management Science, 69(11), 6427-6454.
For more information visit:
Join TechFlow official community to stay tuned
Telegram:https://t.me/TechFlowDaily
X (Twitter):https://x.com/TechFlowPost
X (Twitter) EN:https://x.com/BlockFlow_News


