

OKX Research | Uncovering the 10-Year Performance of Major Assets: The Truth Behind Bitcoin, Gold, U.S. Stocks, U.S. Bonds, and More
TechFlow Selected TechFlow Selected
OKX Research | Uncovering the 10-Year Performance of Major Assets: The Truth Behind Bitcoin, Gold, U.S. Stocks, U.S. Bonds, and More
The "holy grail" of asset allocation is not finding a single best asset, but deeply understanding and skillfully combining the unique characteristics of different assets.

Between 2015 and 2025, global financial markets experienced a dramatic cycle. From post-financial crisis quantitative easing to historic zero interest rate environments, followed by a sharp tightening cycle triggered by high inflation, macroeconomic waves continuously impacted various asset classes. Against this backdrop, crypto assets represented by BTC and ETH far outperformed equities, gold, and U.S. Treasuries, completing an astonishing leap from niche experiments within tech communities to inclusion on Wall Street institutional balance sheets. However, these outsized returns came with extreme risks—crypto assets once suffered drawdowns exceeding 75%, with recovery periods often lasting years, while traditional assets demonstrated greater resilience.
TechFlow Research Institute takes "10-Year Performance of Five Major Assets" as its core focus, aiming to answer one key question: Over a decade-long timeframe, how do BTC and ETH compare against mainstream assets like gold, the S&P 500, and U.S. Treasuries in terms of their true risk-return profiles? Have we paid a commensurate or even excessive risk premium for the remarkable returns offered by crypto assets? To address this, we go beyond simple return comparisons to present a comprehensive, objective, and cycle-spanning asset performance map. (Data截至 August 31, 2025)
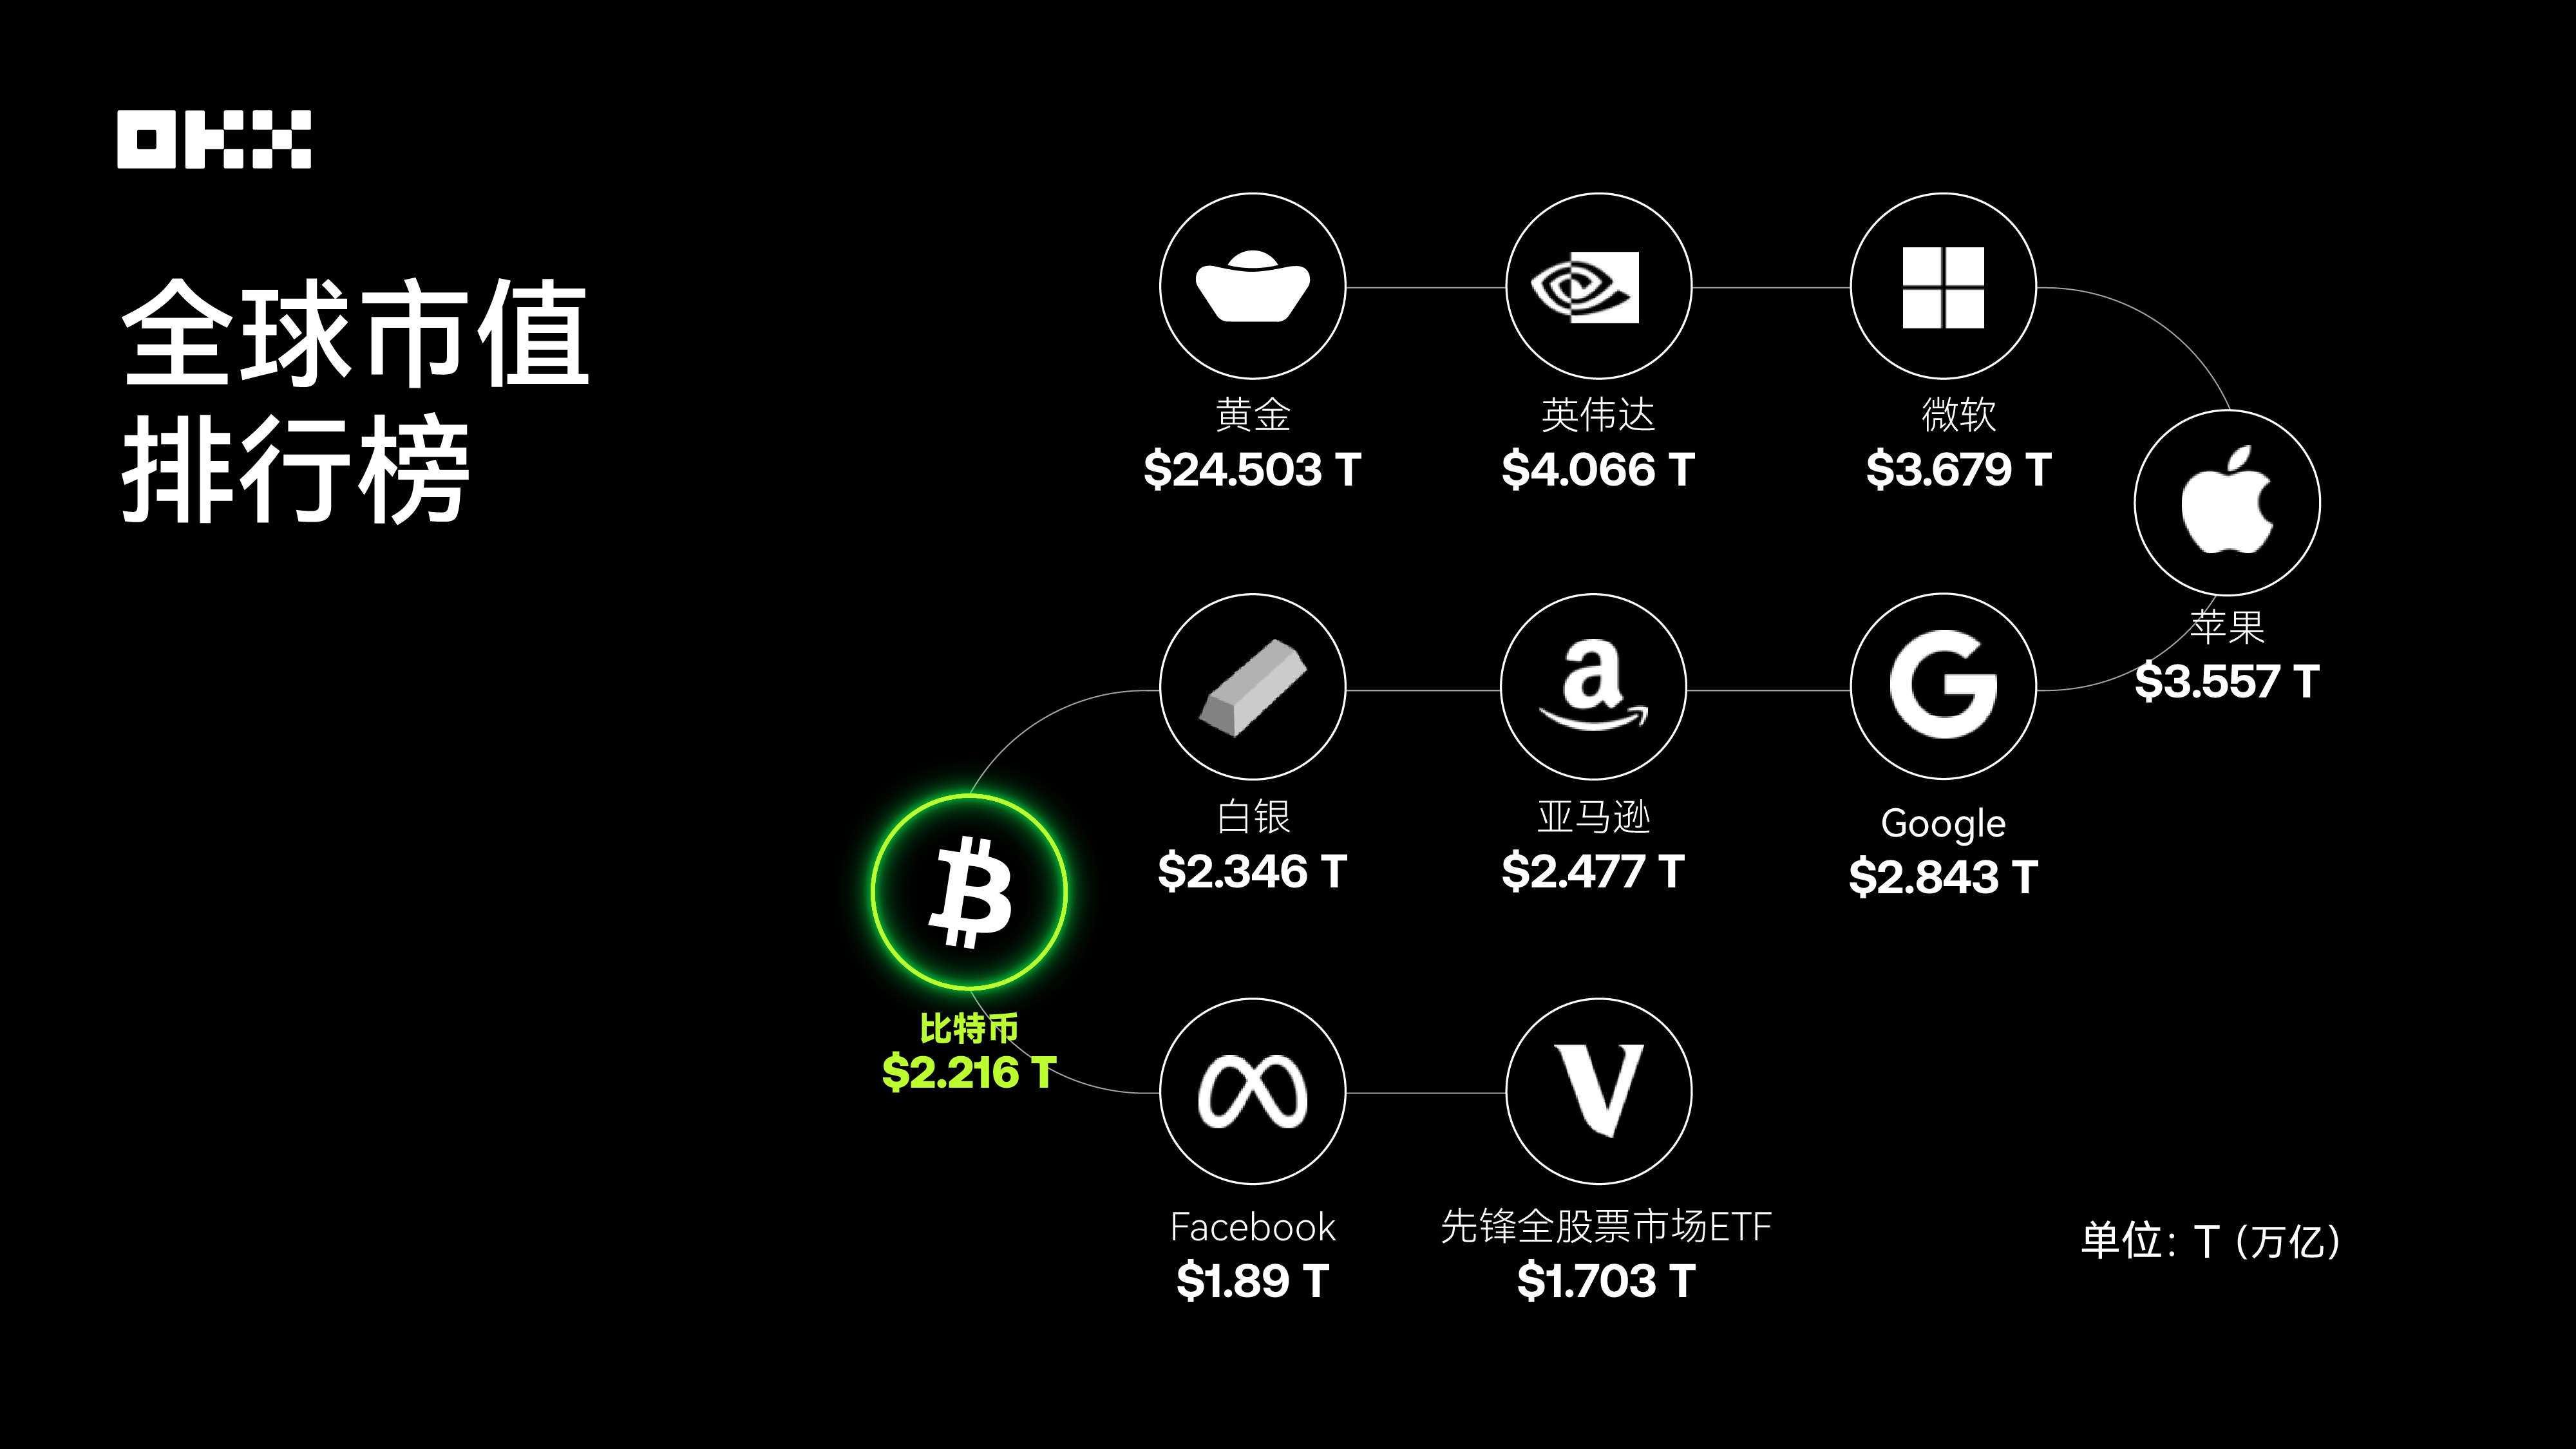
Source: 8MarketCap; Global market capitalization rankings of major assets as of end-August 2025, with Bitcoin ranking among the top
Return Comparison: Who Is the Asset King?
The most intuitive way to evaluate an asset is by observing its long-term value growth trajectory. We assume a $10,000 investment made on August 1, 2015, into each of these five assets, tracking their cumulative value changes through August 1, 2025. This comparison clearly reveals significant differences in wealth creation capabilities across asset classes.
(1) Annual Price Snapshot: Value Benchmark at Key Points (2015–2025, August 1 each year)
The table below records the closing prices of five core assets on or shortly after August 1 each year from 2015 to 2025.
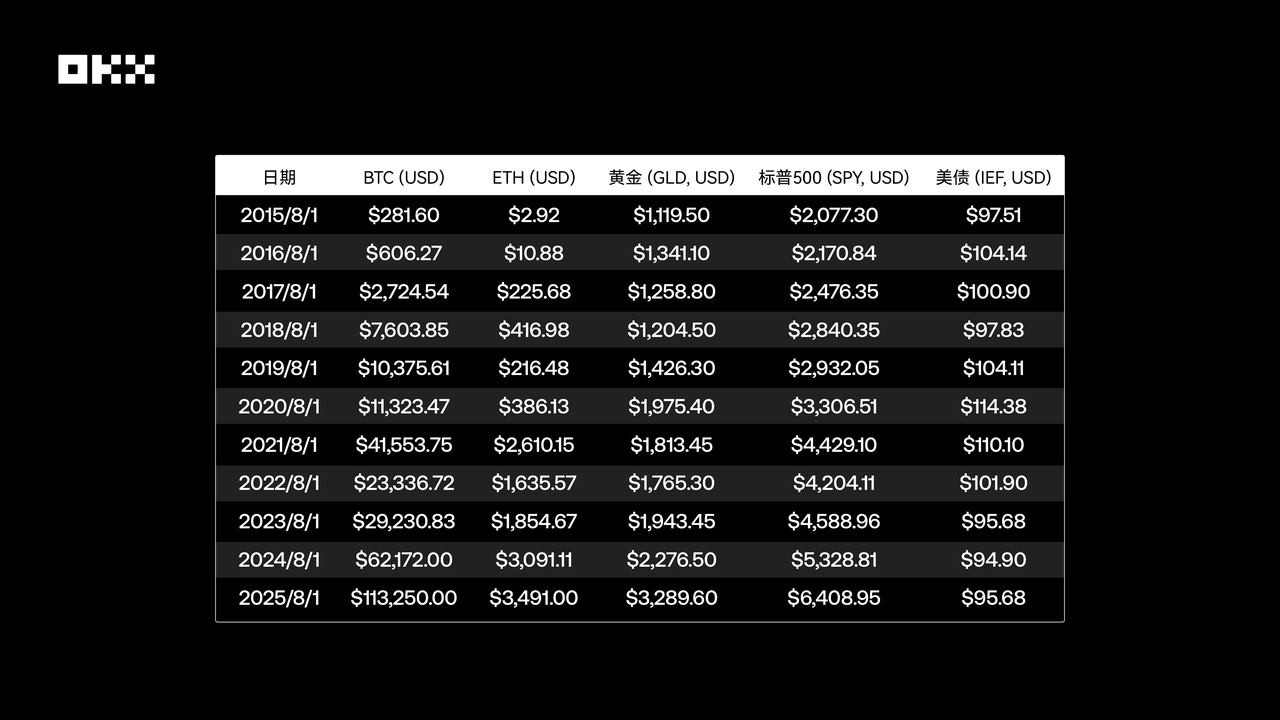
Source: Based on Yahoo Finance and CoinGecko, closing price on the day or first subsequent trading day; ETF prices are adjusted closing prices
The price snapshots clearly show that Bitcoin and Ethereum experienced exponential growth, with their price magnitudes fundamentally changing over the decade. In contrast, the S&P 500 showed a steady bullish trend, gold exhibited fluctuations tied to macroeconomic cycles, and U.S. Treasury prices clearly reflected shifts in interest rate environments, particularly under pressure during the 2022–2023 rate-hiking cycle.
(2) Annual Peak Performance: Capturing the High Point of Each Cycle
Observing only fixed-date price snapshots is insufficient to capture the full picture. Intra-year price movements, especially peak highs, reveal an asset’s explosive potential and the "fear of missing out" (FOMO) traders may face. The table below shows the highest price reached by each asset during each annual cycle (from August 1 of one year to July 31 of the next).
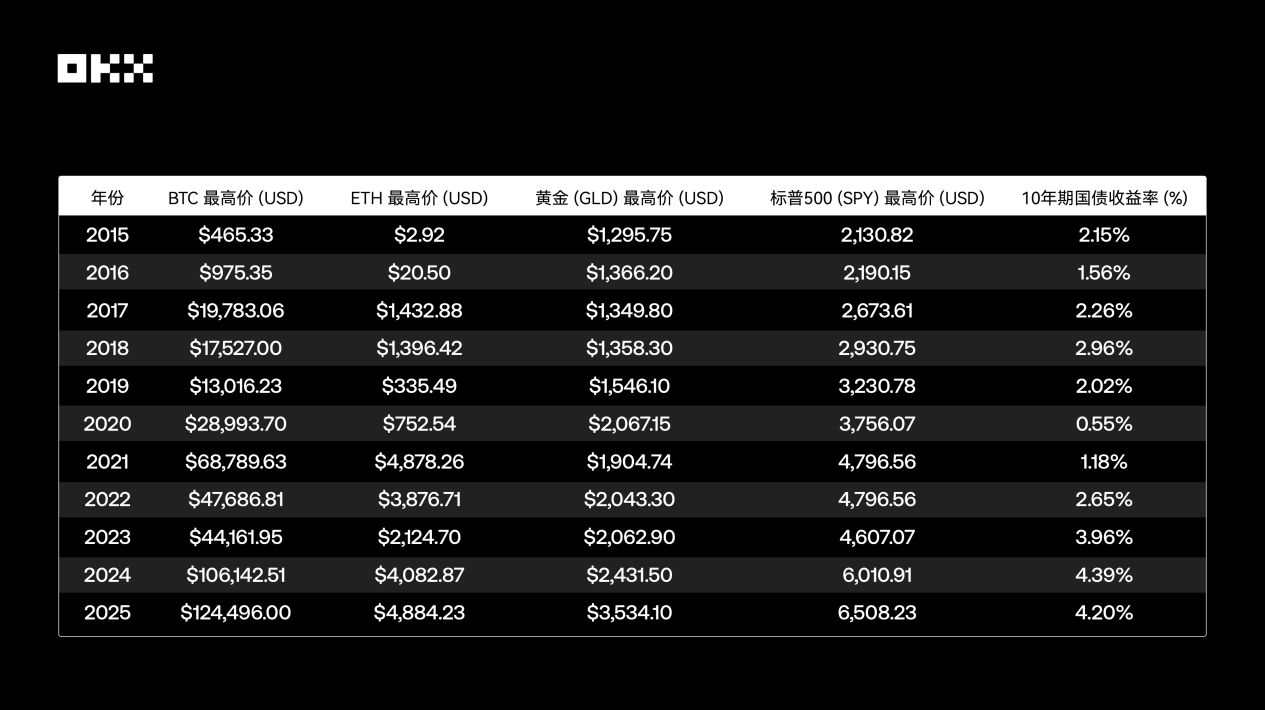
Source: Ethereum launched on July 30, 2015; early data has low liquidity and may contain some inaccuracies; other data calculated based on Yahoo Finance daily historical data
By examining annual price peaks, we can clearly see the magnitude differences in asset growth. Bitcoin and Ethereum exhibit staggering jumps during bull markets, whereas the S&P 500 and gold show much smaller gaps between annual highs and snapshot prices, reflecting more mature and stable market characteristics.
(3) Wealth Growth Simulation: A 10-Year Journey of $10,000
To better illustrate the wealth-creation capacity of different assets, we simulate a simple experiment: investing $10,000 in each of the five assets on August 1, 2015, and holding until August 1, 2025. The chart below uses a logarithmic scale to display the cumulative value of this investment, which better handles large magnitude differences and prevents steep curves of high-growth assets from obscuring details of others.
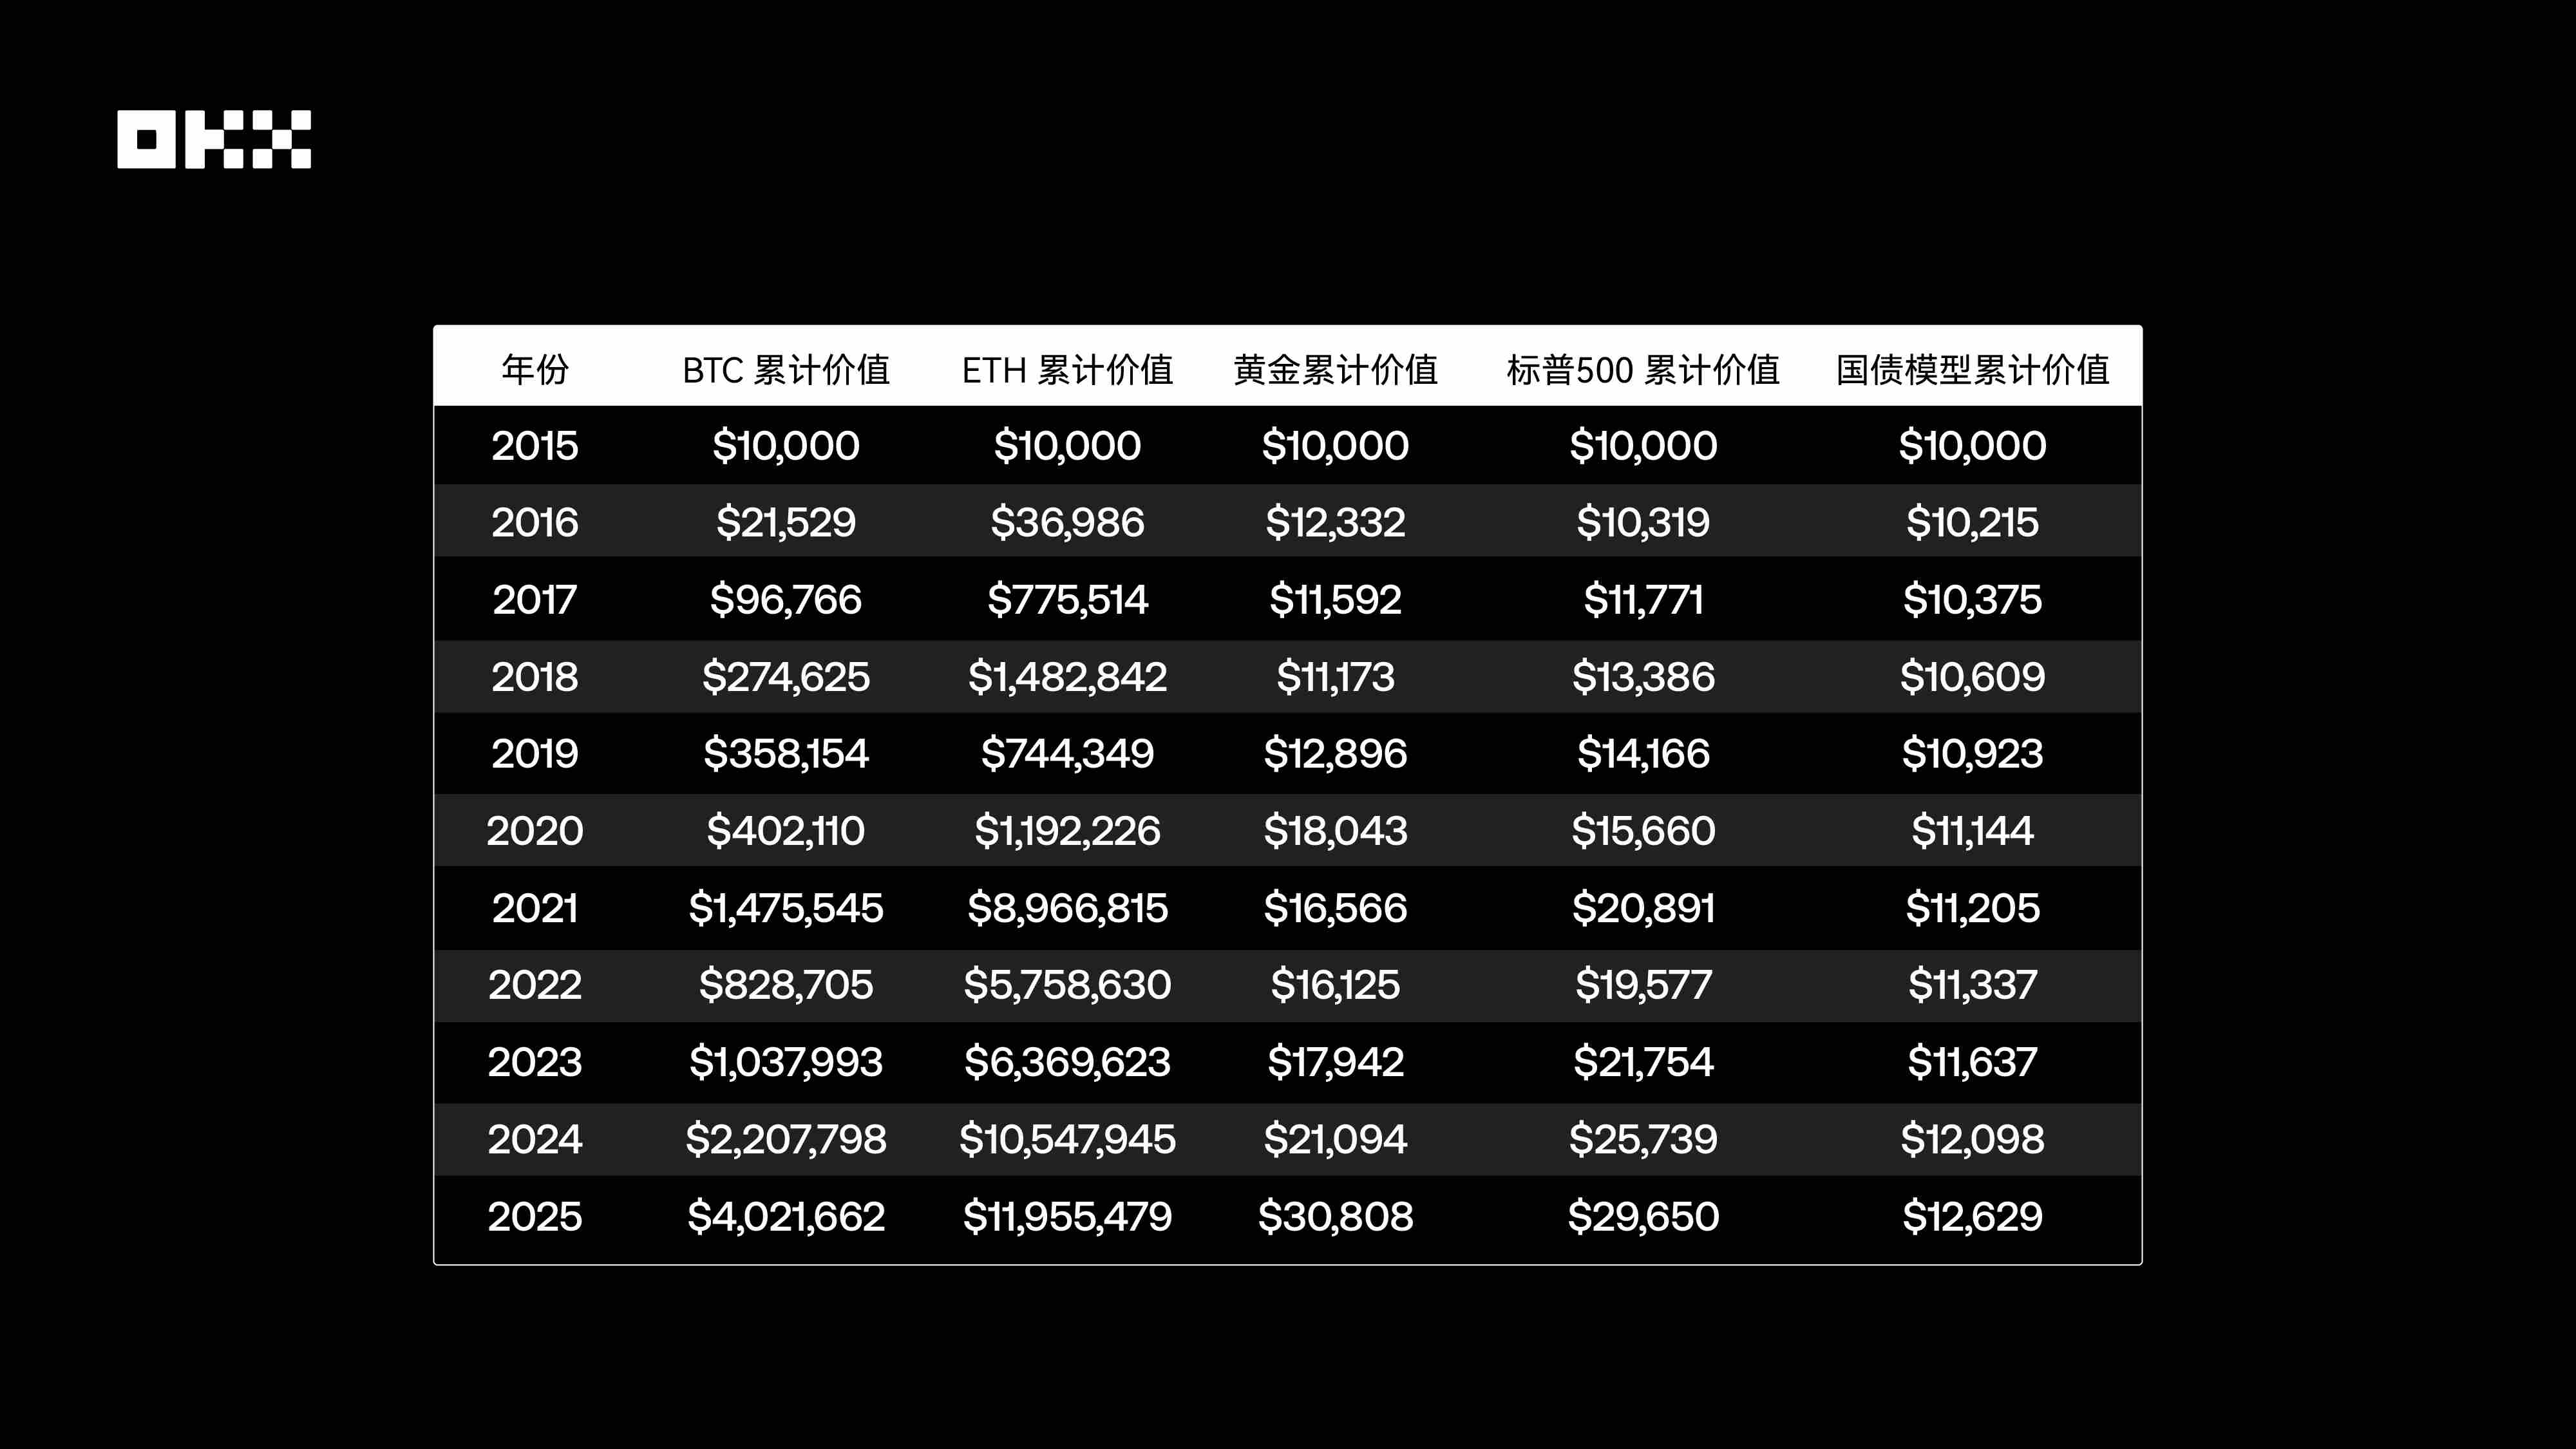
Source: Yahoo Finance, FRED, Macrotrends, etc.
The table shows that over the 2015–2025 decade, the growth multiples for different assets were: BTC 402.17x (cumulative return ~$4.02 million), ETH 1195.55x (cumulative return ~$11.95 million), gold 3.08x (~$30,800), S&P 500 2.97x (~$29,600), and U.S. Treasuries 1.26x (~$12,600).
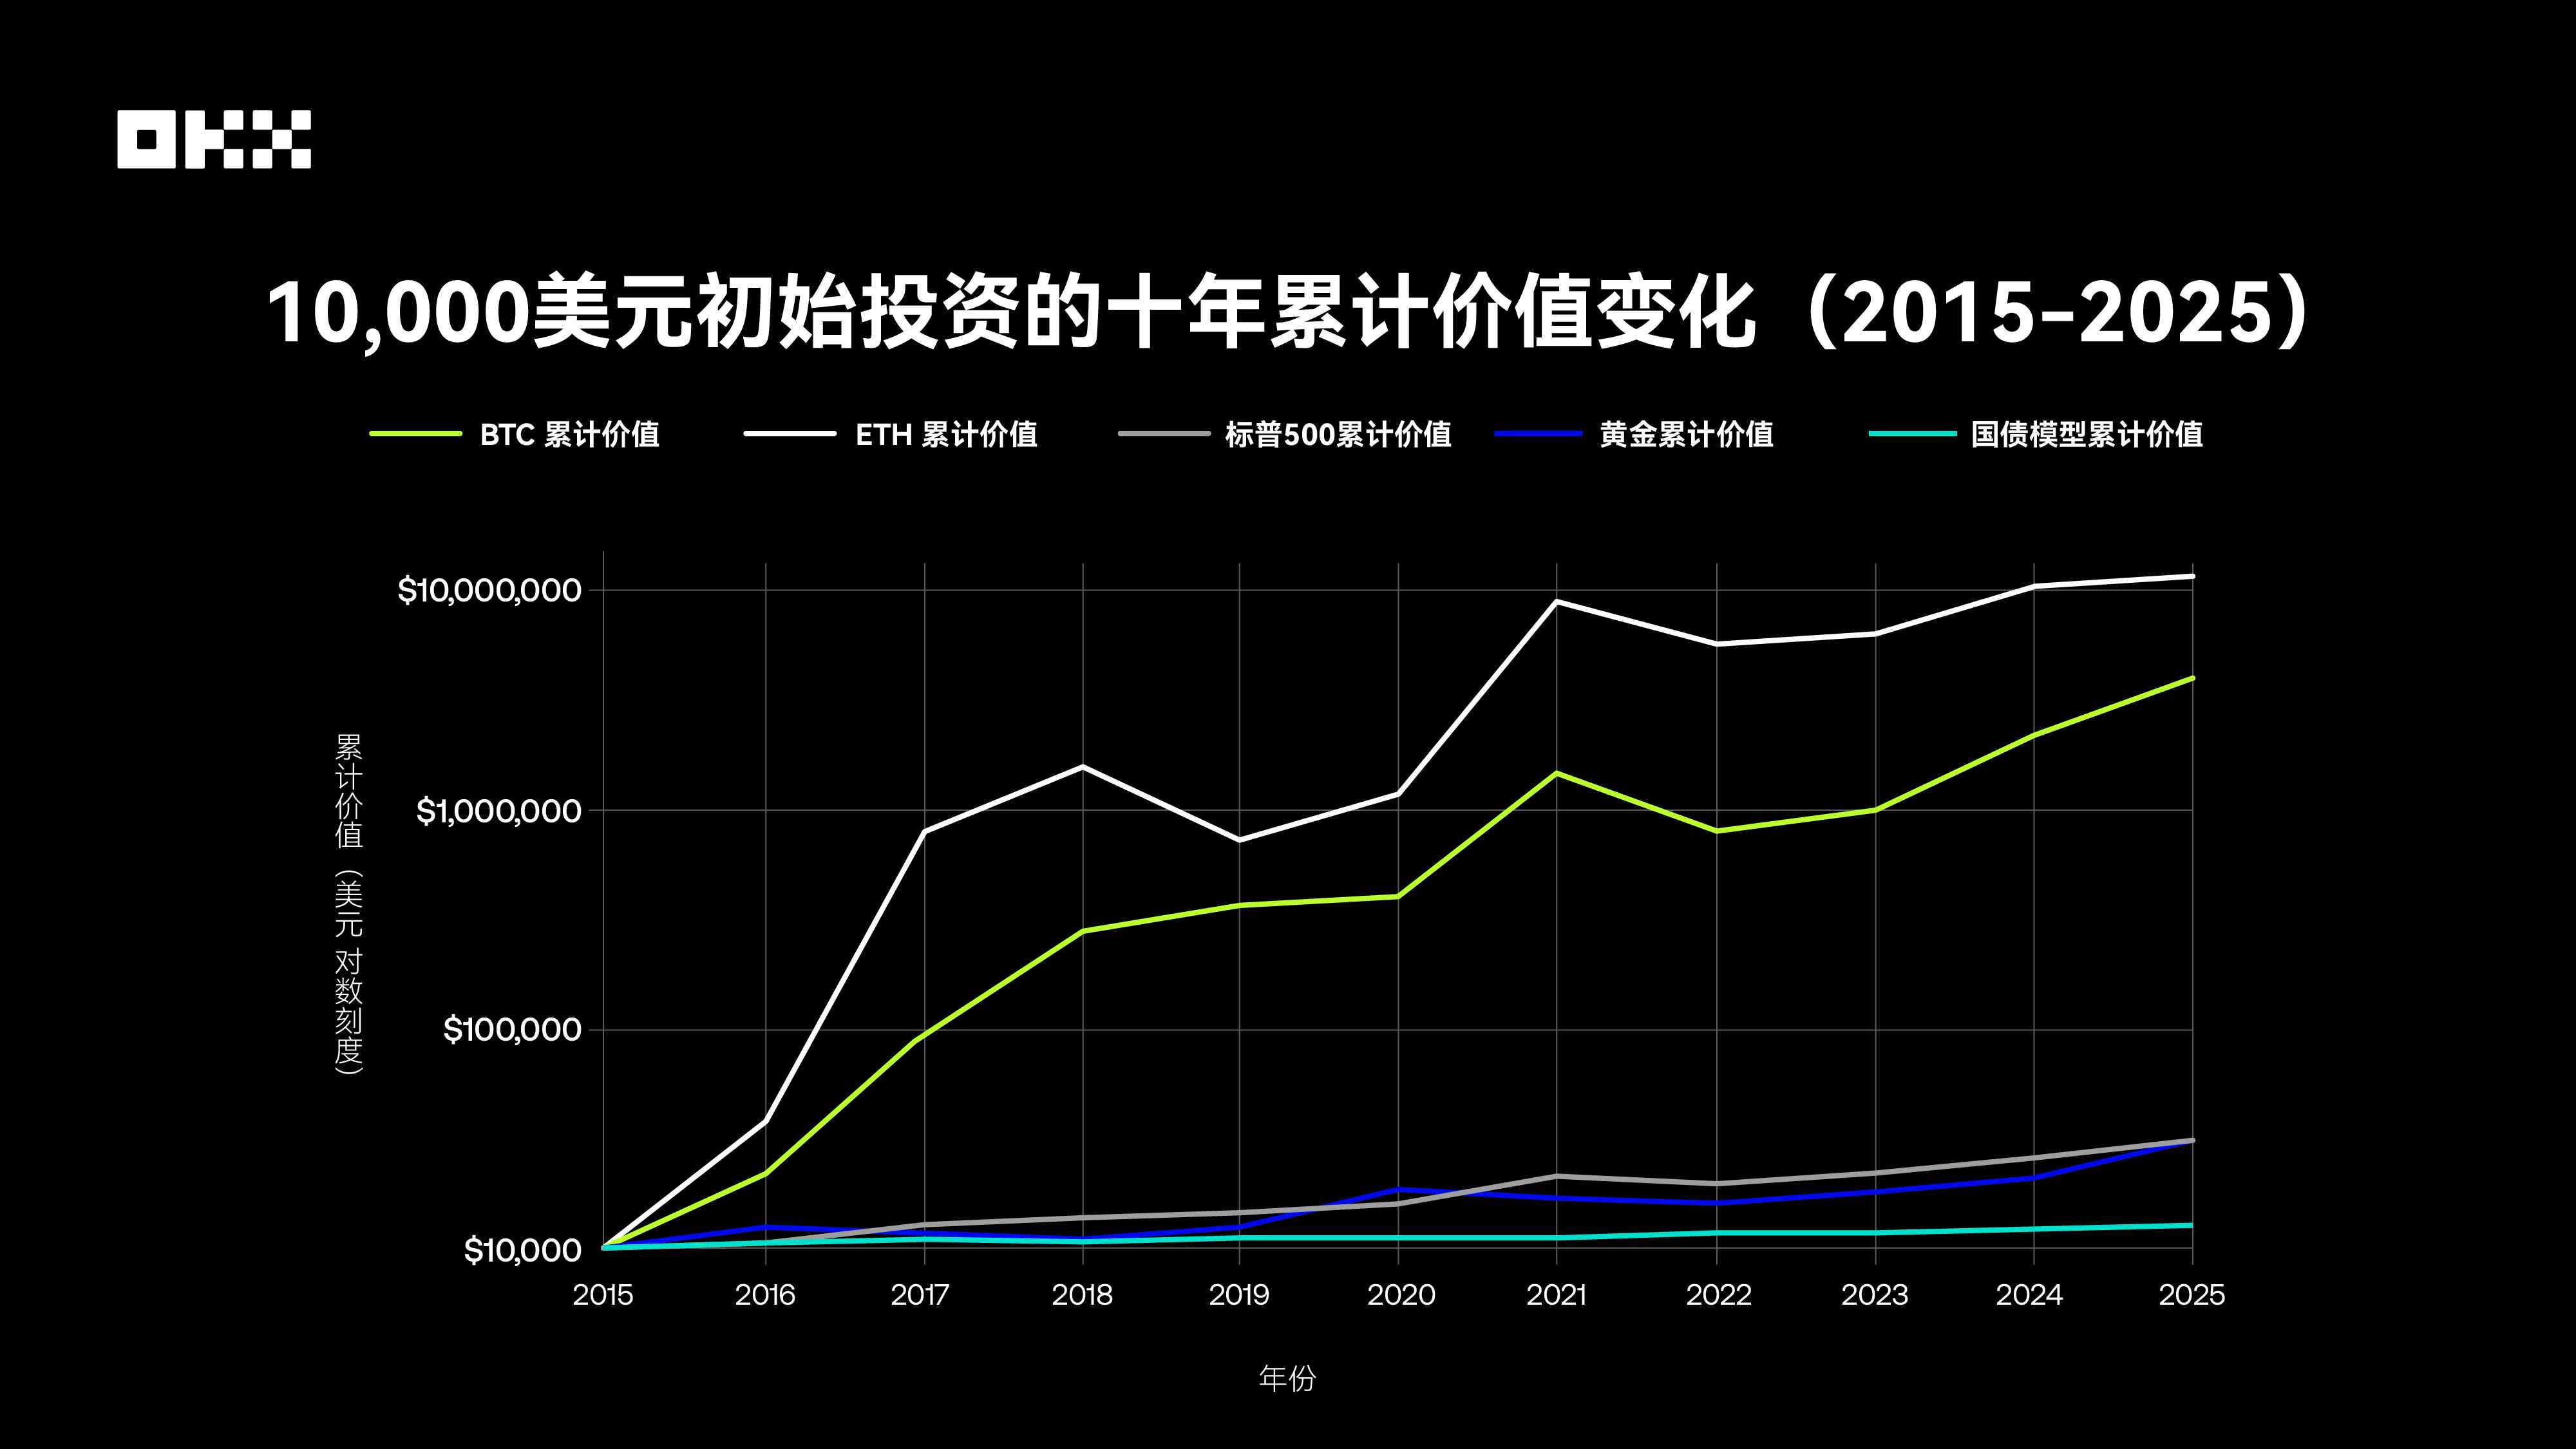
Bitcoin and Ethereum demonstrated astonishing wealth growth effects, with returns far surpassing traditional assets by orders of hundreds or even thousands, highlighting the asymmetric return potential of emerging technology assets under high risk—an unimaginable phenomenon in traditional finance. In contrast, the S&P 500 tripled investments through steady compounding, gold mainly served as a store of value, and U.S. Treasuries nearly stagnated over 10 years after experiencing both low- and high-interest rate cycles, underscoring the constraints of interest rate risk on long-term bond performance.
Maximum Drawdown: How High Is the Risk Behind the Returns?
No asset can lead forever—returns are just the beginning of the story. A sophisticated investor cares more about the quality of returns—i.e., what level of risk was taken to achieve them. Therefore, understanding risk characteristics is as important as assessing return potential. Using three core metrics—volatility, maximum drawdown, and Sharpe ratio—we can more comprehensively evaluate the real "cost-effectiveness" of each asset. Volatility, typically measured by standard deviation, reflects the degree of price fluctuation. Maximum drawdown measures the largest percentage decline from a historical peak to a subsequent trough, serving as a direct indicator of downside risk, closely linked to investor psychological limits and portfolio survival.
Source: Bloomberg, S&P Global, Yahoo Finance, etc.
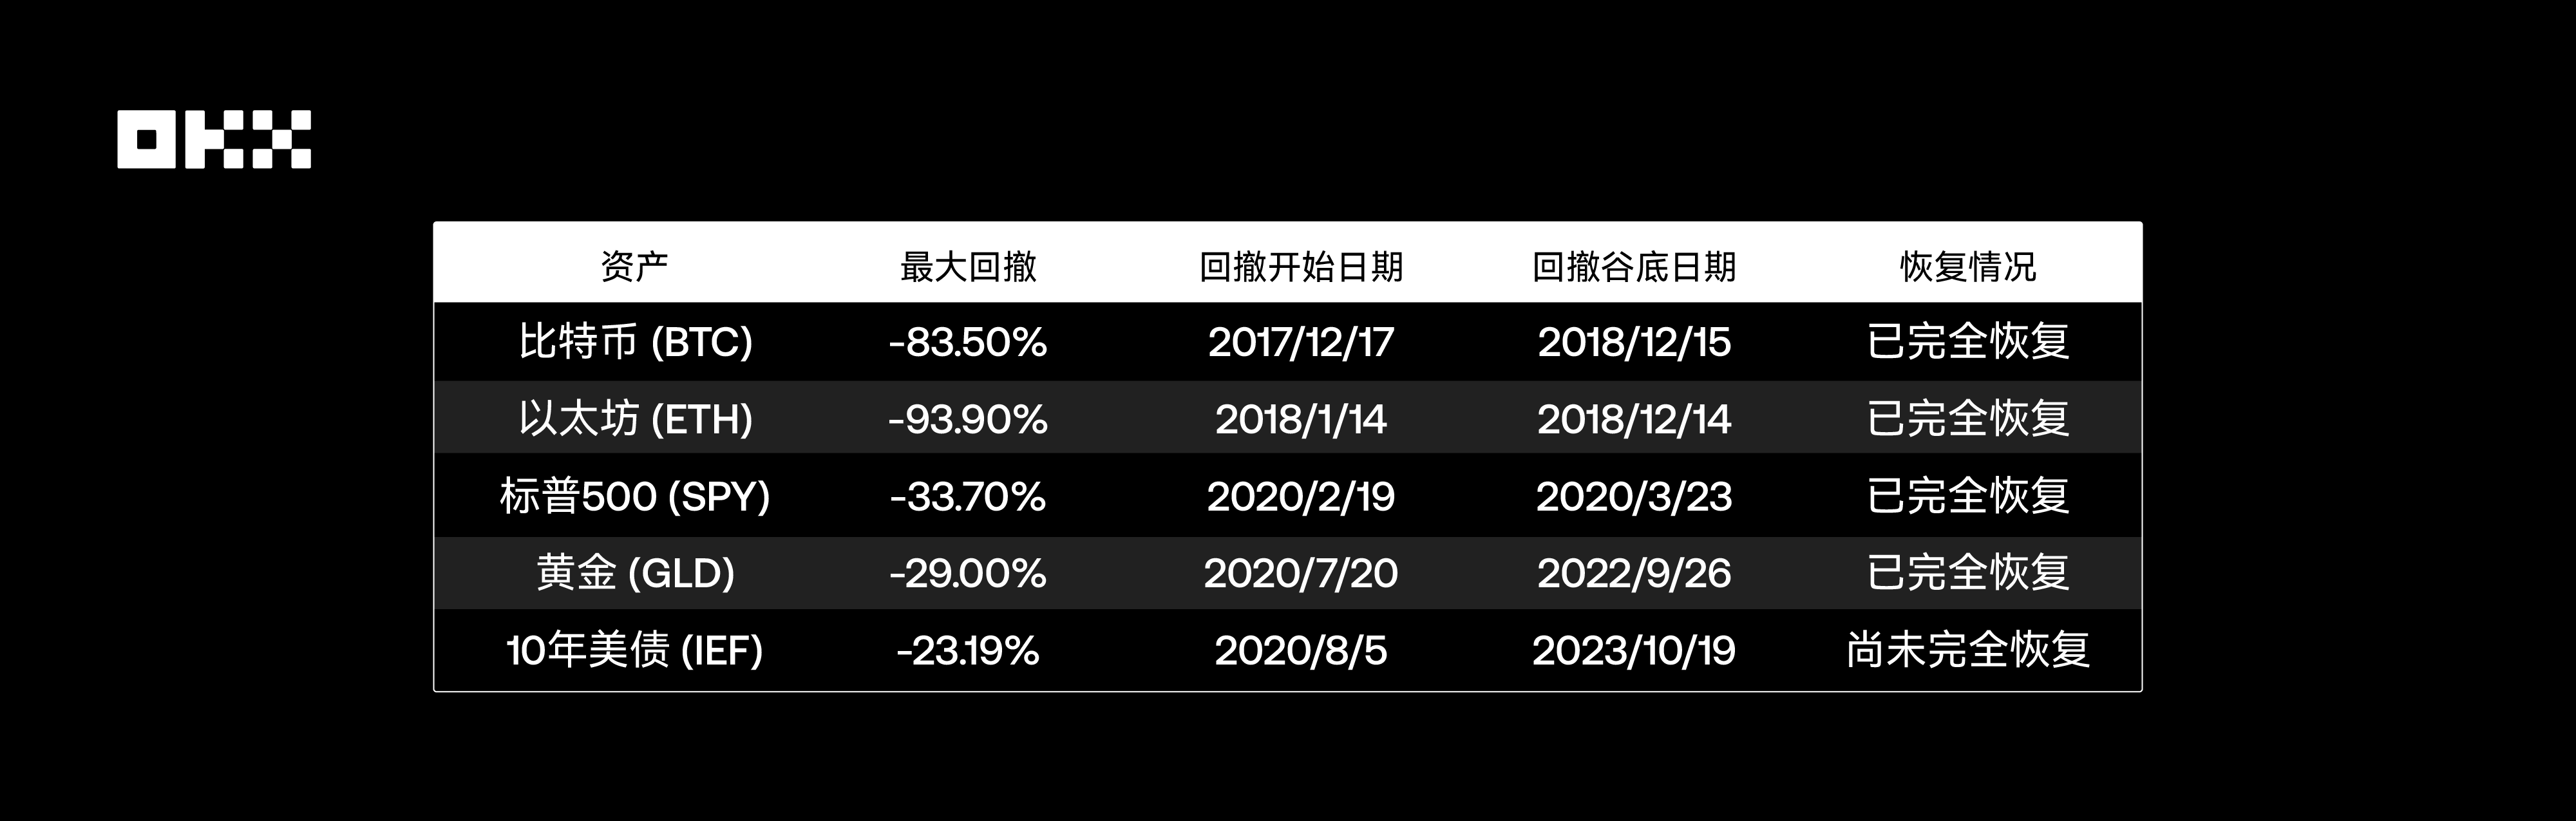
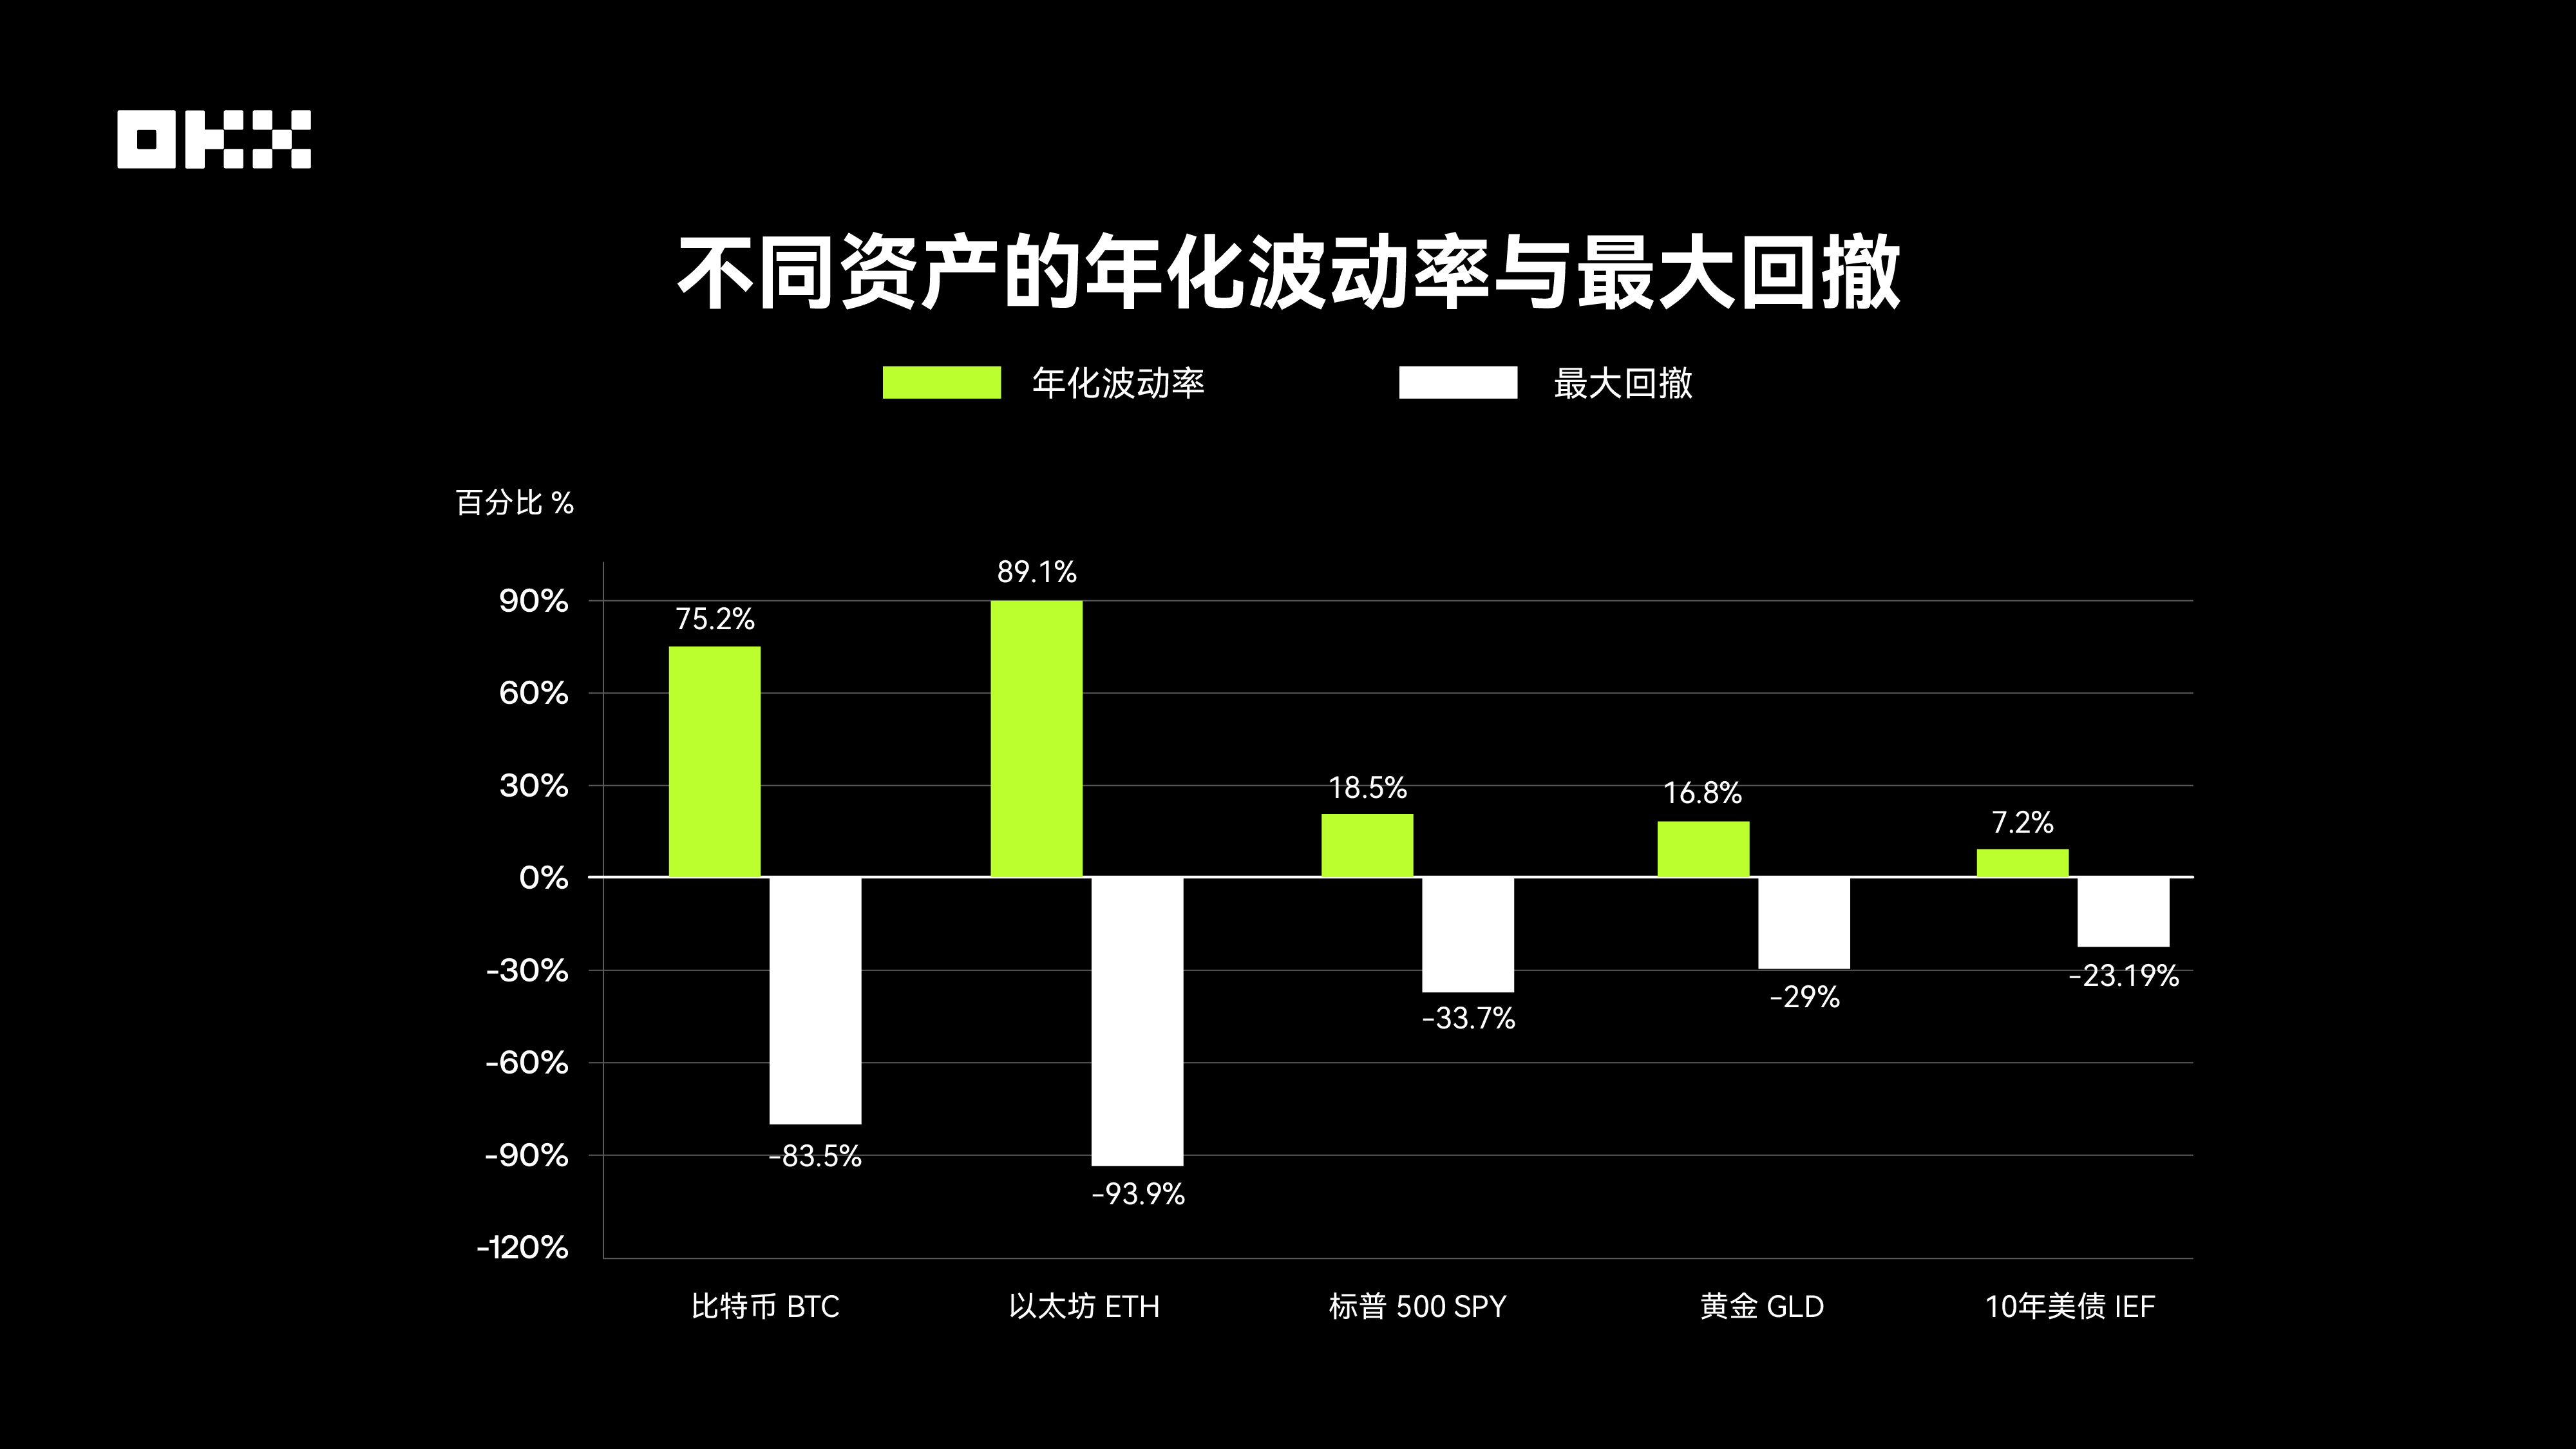
Crypto assets are significantly more volatile than traditional assets. According to Digital One Agency, Bitcoin’s annualized standard deviation is around 70%–90%, compared to just 15%–20% for the S&P 500. This extreme volatility leads directly to massive drawdowns: over the past decade, Bitcoin and Ethereum have suffered multiple drawdowns exceeding 70%. For example, during the 2018 bear market, BTC fell from nearly $20,000 to around $3,000—a drawdown exceeding 80%. The S&P 500’s largest drawdown occurred in early 2020 during the COVID-19 pandemic, at approximately -34%. During the 2008 financial crisis, it exceeded -50%. Gold has been relatively stable, with a maximum drawdown of about -29% over the past 15 years. As a safe-haven asset, U.S. Treasuries had the smallest drawdowns but still experienced a maximum decline of around -23% during the post-2020 rate hikes, shattering the myth of being “risk-free.”
This data is sobering. Users of Bitcoin and Ethereum must be prepared to endure asset value losses exceeding 80% or even 90%, and wait two to three years or more to recover.
Additionally, to holistically assess risk-adjusted returns, we introduce the Sharpe Ratio and Calmar Ratio. The Sharpe Ratio, developed by Nobel laureate William Sharpe, is the most classic international metric for risk-adjusted returns. It measures how much excess return an investor earns per unit of total risk (measured by volatility) above the risk-free rate. A higher Sharpe Ratio indicates better return performance for the same level of risk, meaning higher investment efficiency.
The Calmar Ratio is another important risk-adjusted return metric, focusing more on downside risk. It is calculated as the annualized return divided by the historical maximum drawdown. A higher Calmar Ratio means stronger recovery capability or better cost-effectiveness after enduring the worst historical drawdown. This metric is particularly favored by risk-conscious investors.
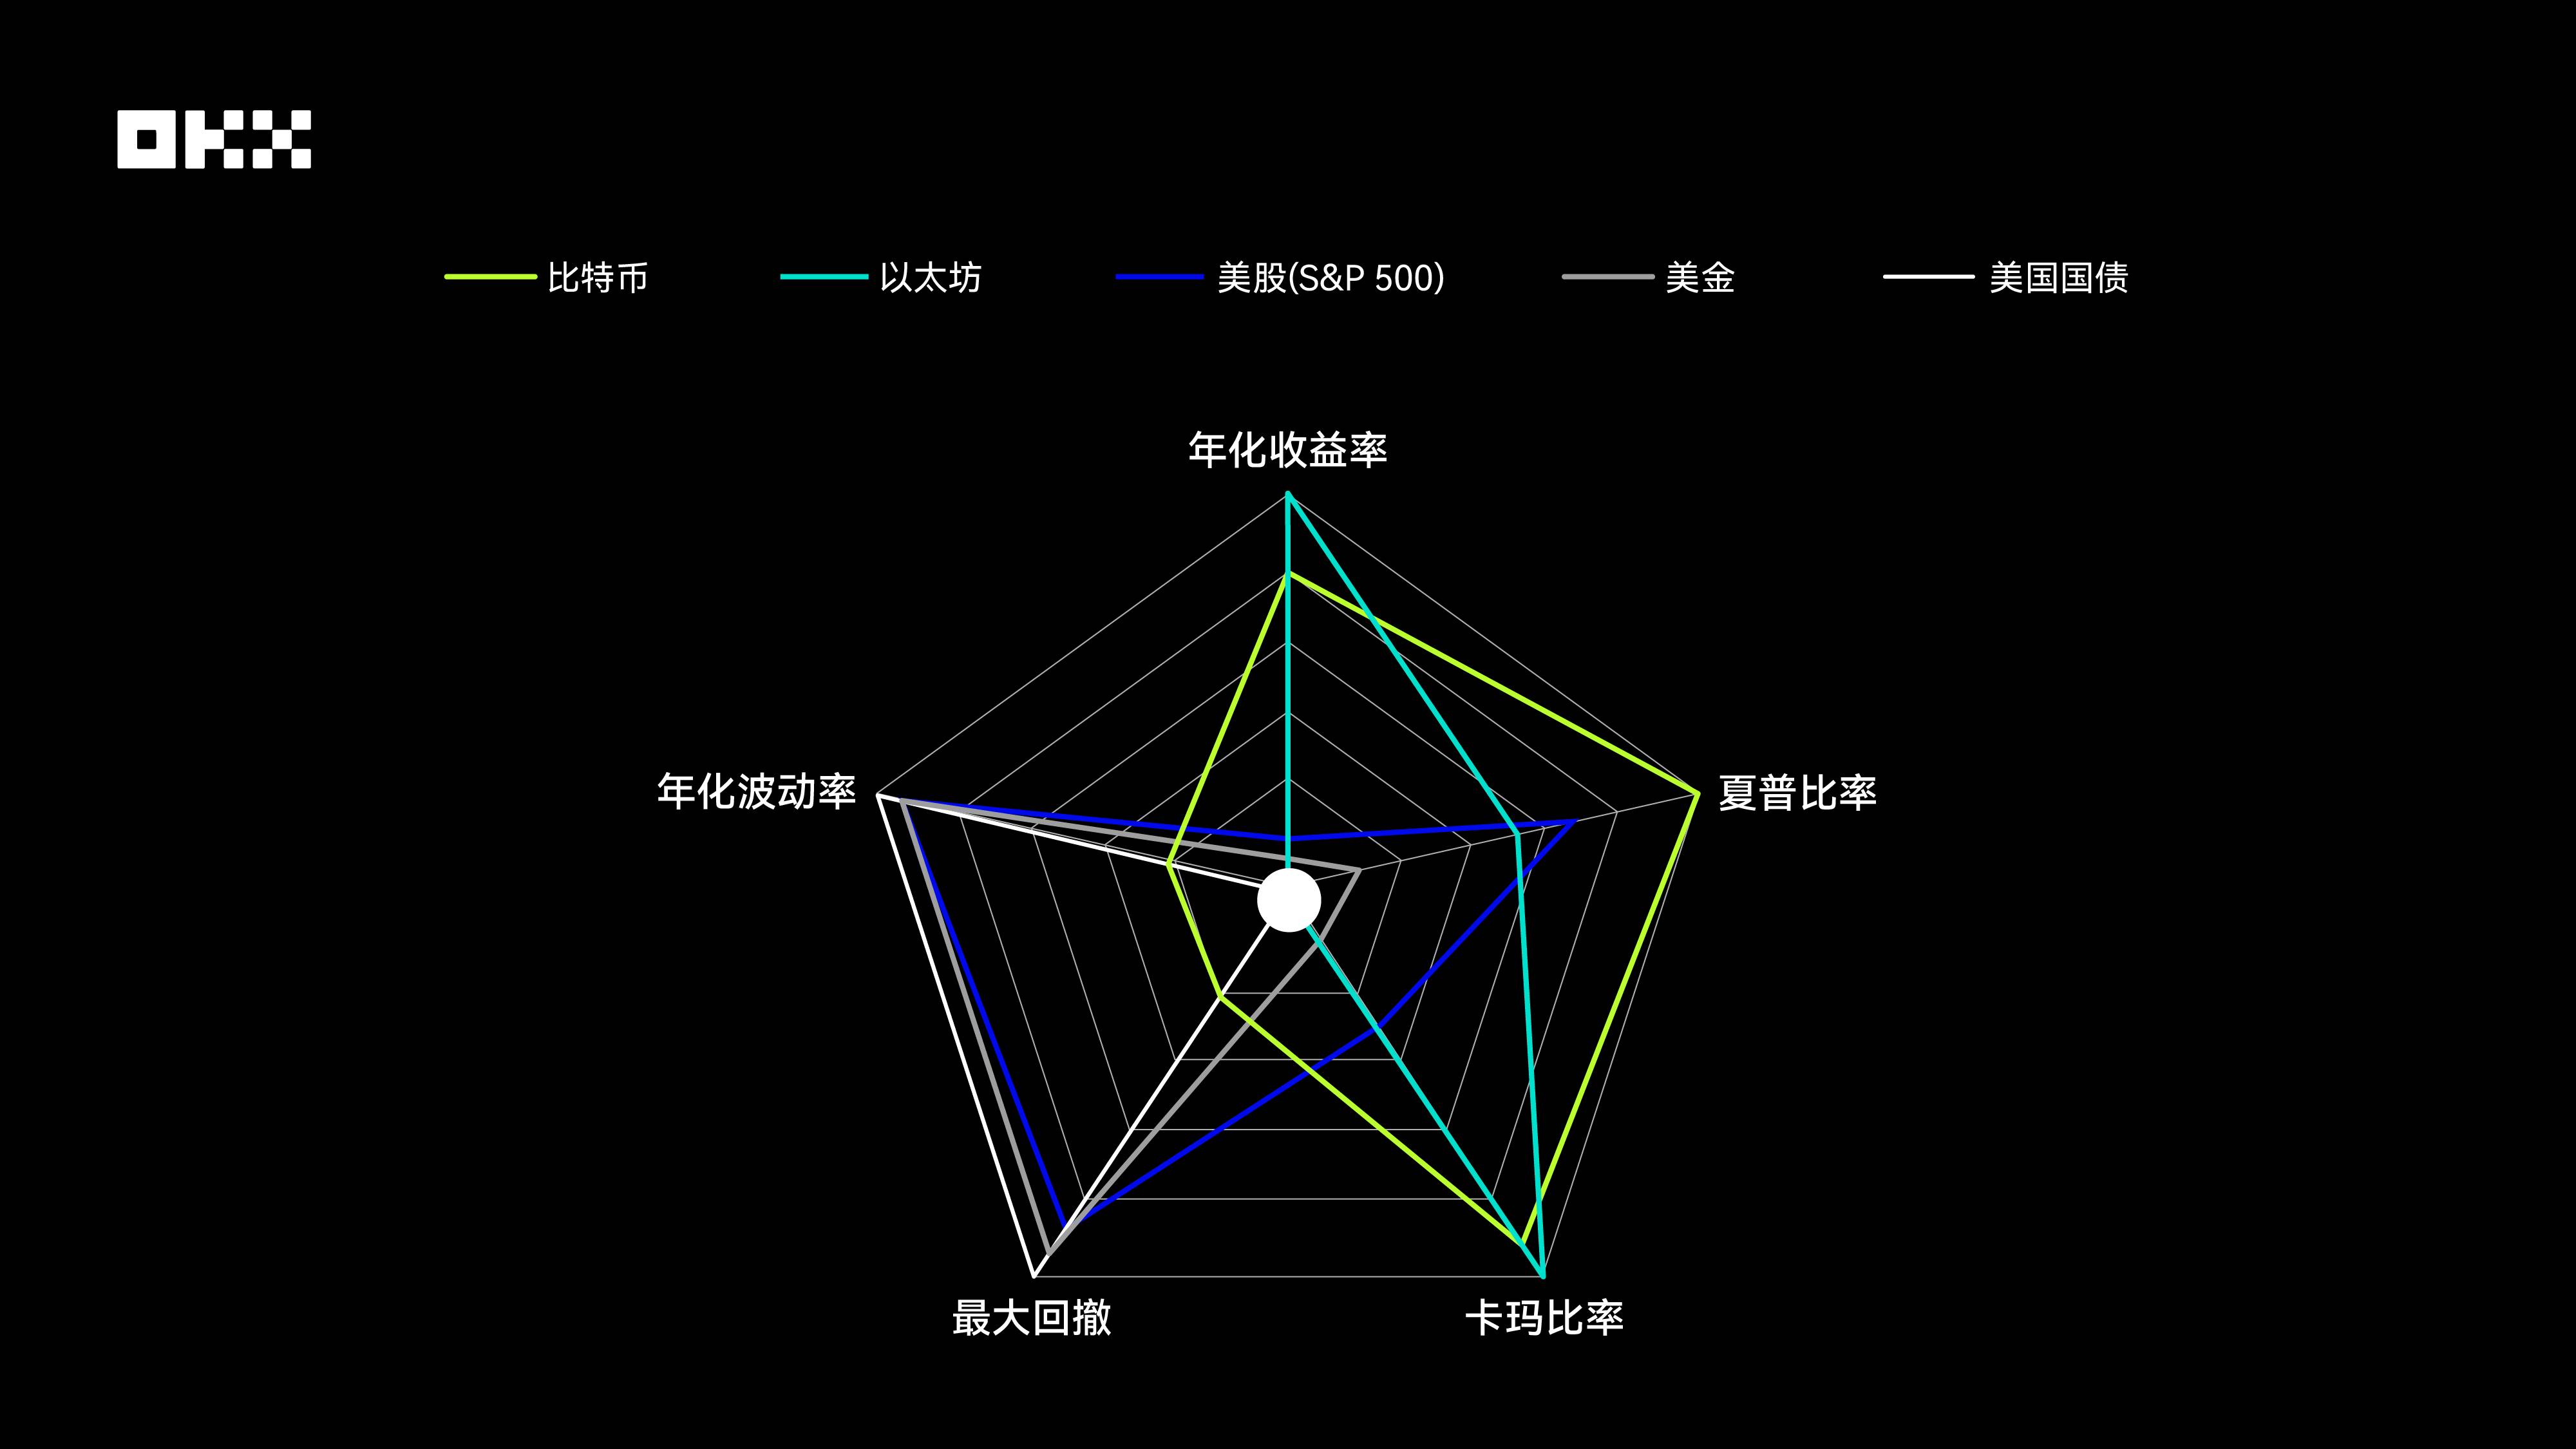
The radar chart for Bitcoin and Ethereum appears the most "aggressive." They show unparalleled advantages in annualized returns and Calmar Ratio, forming outward spikes, reflecting their extraordinary wealth creation and strong recovery after drawdowns over the past decade. However, such high returns come at a cost. In maximum drawdown and annualized volatility, they score the lowest among all assets, causing severe inward contraction in those dimensions—clear "weak spots." This reveals the inherently high-risk, high-volatility nature of crypto assets. Notably, Bitcoin's Sharpe Ratio outperforms Ethereum, indicating slightly better risk-adjusted investment efficiency.
The U.S. equity (S&P 500) radar chart forms a relatively balanced pentagon with considerable coverage area. It has no glaring weaknesses nor extreme strengths across the five dimensions. Its Sharpe Ratio stands out, second only to Bitcoin, showing excellent risk-adjusted returns. Meanwhile, its annualized return is steady, with well-controlled volatility and drawdowns—far superior to crypto assets. This paints the typical image of a "core pillar": delivering solid long-term returns while keeping risk within reasonable bounds, making it a foundational component of any portfolio.
Gold’s radar chart leans toward risk control. It scores high in annualized volatility and maximum drawdown, indicating relative price stability and strong downside resistance. However, it performs modestly in the three return-related metrics: annualized return, Sharpe Ratio, and Calmar Ratio. This aligns perfectly with gold’s role as a traditional safe-haven asset—it is not designed for high growth but for preserving value and hedging risk during market turmoil. Its small chart area also reflects its lower overall return efficiency.
U.S. Treasuries have the smallest radar chart area of all assets, tightly clustered near the center. They score highest in annualized volatility and maximum drawdown, demonstrating exceptional stability. Yet, they rank last in all return-related metrics. This clearly shows that, under the past decade’s declining interest rate environment, U.S. Treasuries primarily served capital preservation and liquidity provision—the "ballast" of a portfolio rather than an "engine" for returns. Their extremely low risk and equally low return stand in stark contrast.
Asset Correlations: How to Optimize Your Portfolio?
The core of portfolio diversification lies in including assets with low correlations. When one asset falls, another may rise or remain stable, smoothing overall portfolio volatility. At inception, Bitcoin had almost no correlation with traditional financial markets and was seen as a perfect "diversification tool." However, this characteristic has changed significantly over the past decade, especially as institutional adoption accelerated.
Correlation coefficients measure the degree to which two asset prices move together, ranging from -1 (perfect negative correlation) to +1 (perfect positive correlation). An effective diversified portfolio typically consists of low- or negatively correlated assets. The table below synthesizes data from multiple research institutions, showing approximate inter-asset correlations over the past decade.
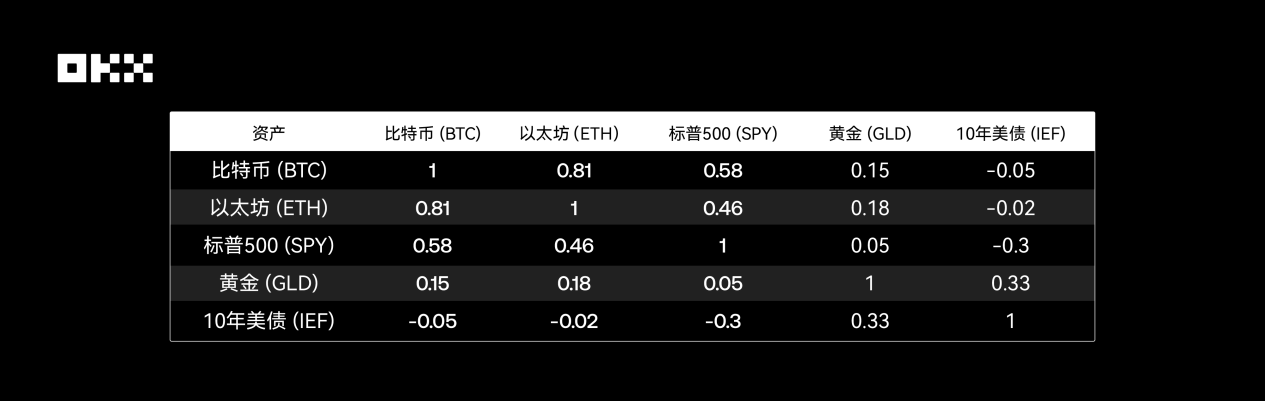
Source: Crypto Research Report, LSEG, Newhedge
Bitcoin vs S&P 500: From independence to synchronization—this is one of the most significant changes over the decade. Pre-2020: Cryptocurrencies showed generally low and unstable correlations with traditional assets, often fluctuating between positive and negative, indicating strong independence. 2020–2021: During the pandemic and monetary easing period, as central banks injected massive liquidity, the "rising tide lifts all boats" effect became pronounced. During this time, Bitcoin’s correlation with the S&P 500 (especially tech stocks) surged, briefly exceeding 0.6, showing a strong "coupling" phenomenon. This suggests that in macro-driven liquidity markets, Bitcoin behaves more like a high-beta risk asset than a safe haven.
2022–2023: Rate hikes and tightening cycles. As the Fed initiated aggressive rate hikes, risk assets broadly declined. Bitcoin’s correlation with the S&P 500 remained high, falling together. However, its negative correlation with the U.S. Dollar Index (DXY) strengthened significantly—Bitcoin often weakened when the dollar strengthened. 2024–2025: The ETF era. The approval of U.S. spot Bitcoin ETFs marked a structural turning point. On one hand, it deepened the link between crypto and traditional finance; on the other, sustained capital inflows from ETFs may act as a pricing factor independent of macro sentiment, leading to renewed shifts in correlation. Data shows that after ETF approval, Bitcoin’s correlation with the S&P 500 decreased, showing signs of "decoupling."
Bitcoin vs Gold: Challenging the "Digital Gold" narrative. Despite Bitcoin being dubbed "digital gold" due to its fixed supply, data shows its relationship with physical gold’s safe-haven properties is unstable. Research by the European Securities and Markets Authority (ESMA) finds no clear, stable relationship between the two. Especially during market panic, Bitcoin tends to fall alongside risk assets instead of providing shelter like gold.
Internal Relationships Among Traditional Assets: The classic negative or low correlations among gold, U.S. Treasuries, and the S&P 500 remain the cornerstone of traditional asset allocation, providing crucial stability to portfolios.
Impact of Major Events: How Did the Five Assets Perform?
Averages over long cycles may mask extreme behaviors during critical moments. By conducting "slice" analyses of several major events, we gain deeper insight into the true "stress responses" of various assets.
(1) March 2020: The COVID-19 Black Swan – Unselective Global Sell-Off
In March 2020, the outbreak of the COVID-19 pandemic triggered panic across global financial markets, known as "Black March." During this extreme liquidity crisis, nearly all assets faced indiscriminate selling. The S&P 500 entered a bear market within just 16 trading days—the fastest on record—with a maximum drawdown of -34%. Bitcoin was not spared either, plunging nearly 50% in a single day on March 12, from around $8,000 to below $4,000. Even gold (GLD) was not immune, briefly falling as investors sold assets to obtain U.S. dollar liquidity. Only U.S. Treasuries, as the ultimate safe haven, held firm. This event profoundly revealed that during extreme "de-risking" phases, correlations converge toward 1—Bitcoin’s "digital safe-haven" narrative proved fragile in the face of liquidity drought.
(2) May & November 2022: Native Crypto Crises – The Collapse of LUNA & FTX Delivered Devastating Blows
2022 was a "disaster year" for the crypto industry. In May, the collapse of algorithmic stablecoin TerraUSD (UST) and its sister token LUNA erased nearly $50 billion in market cap within days. Later in November, the sudden bankruptcy of FTX, then the world’s second-largest crypto exchange, further intensified market panic. These were classic "endogenous" crises within crypto. Studies show that after the FTX collapse, both Bitcoin and Ethereum dropped over 20%, with assets closely tied to the FTX ecosystem suffering even steeper declines. However, traditional financial markets—gold, equities, and Treasuries—were barely affected, clearly demonstrating risk isolation between crypto and traditional finance. This indicates that crypto assets face not only macroeconomic risks but also unique, potentially more destructive internal risks related to protocols, platforms, and trust.
(3) 2020–2025: Macro Policy Shift Cycles – The Tides of Liquidity
The Federal Reserve’s monetary policy acts as the "master valve" for global liquidity. During the massive quantitative easing and zero-interest-rate policies of 2020–2021, abundant liquidity flowed into risk assets, fueling bull markets for both Bitcoin and the S&P 500. However, starting in March 2022, as the Fed launched an aggressive rate-hiking cycle to combat inflation, global liquidity tightened and risk asset prices fell accordingly. Academic studies indicate that Bitcoin’s sensitivity to Fed rate decisions and monetary policy uncertainty (MPU) significantly increased after 2020. This reaffirms that Bitcoin is now deeply integrated into the macro-financial framework, with its price movements closely tied to expectations of Fed policy.
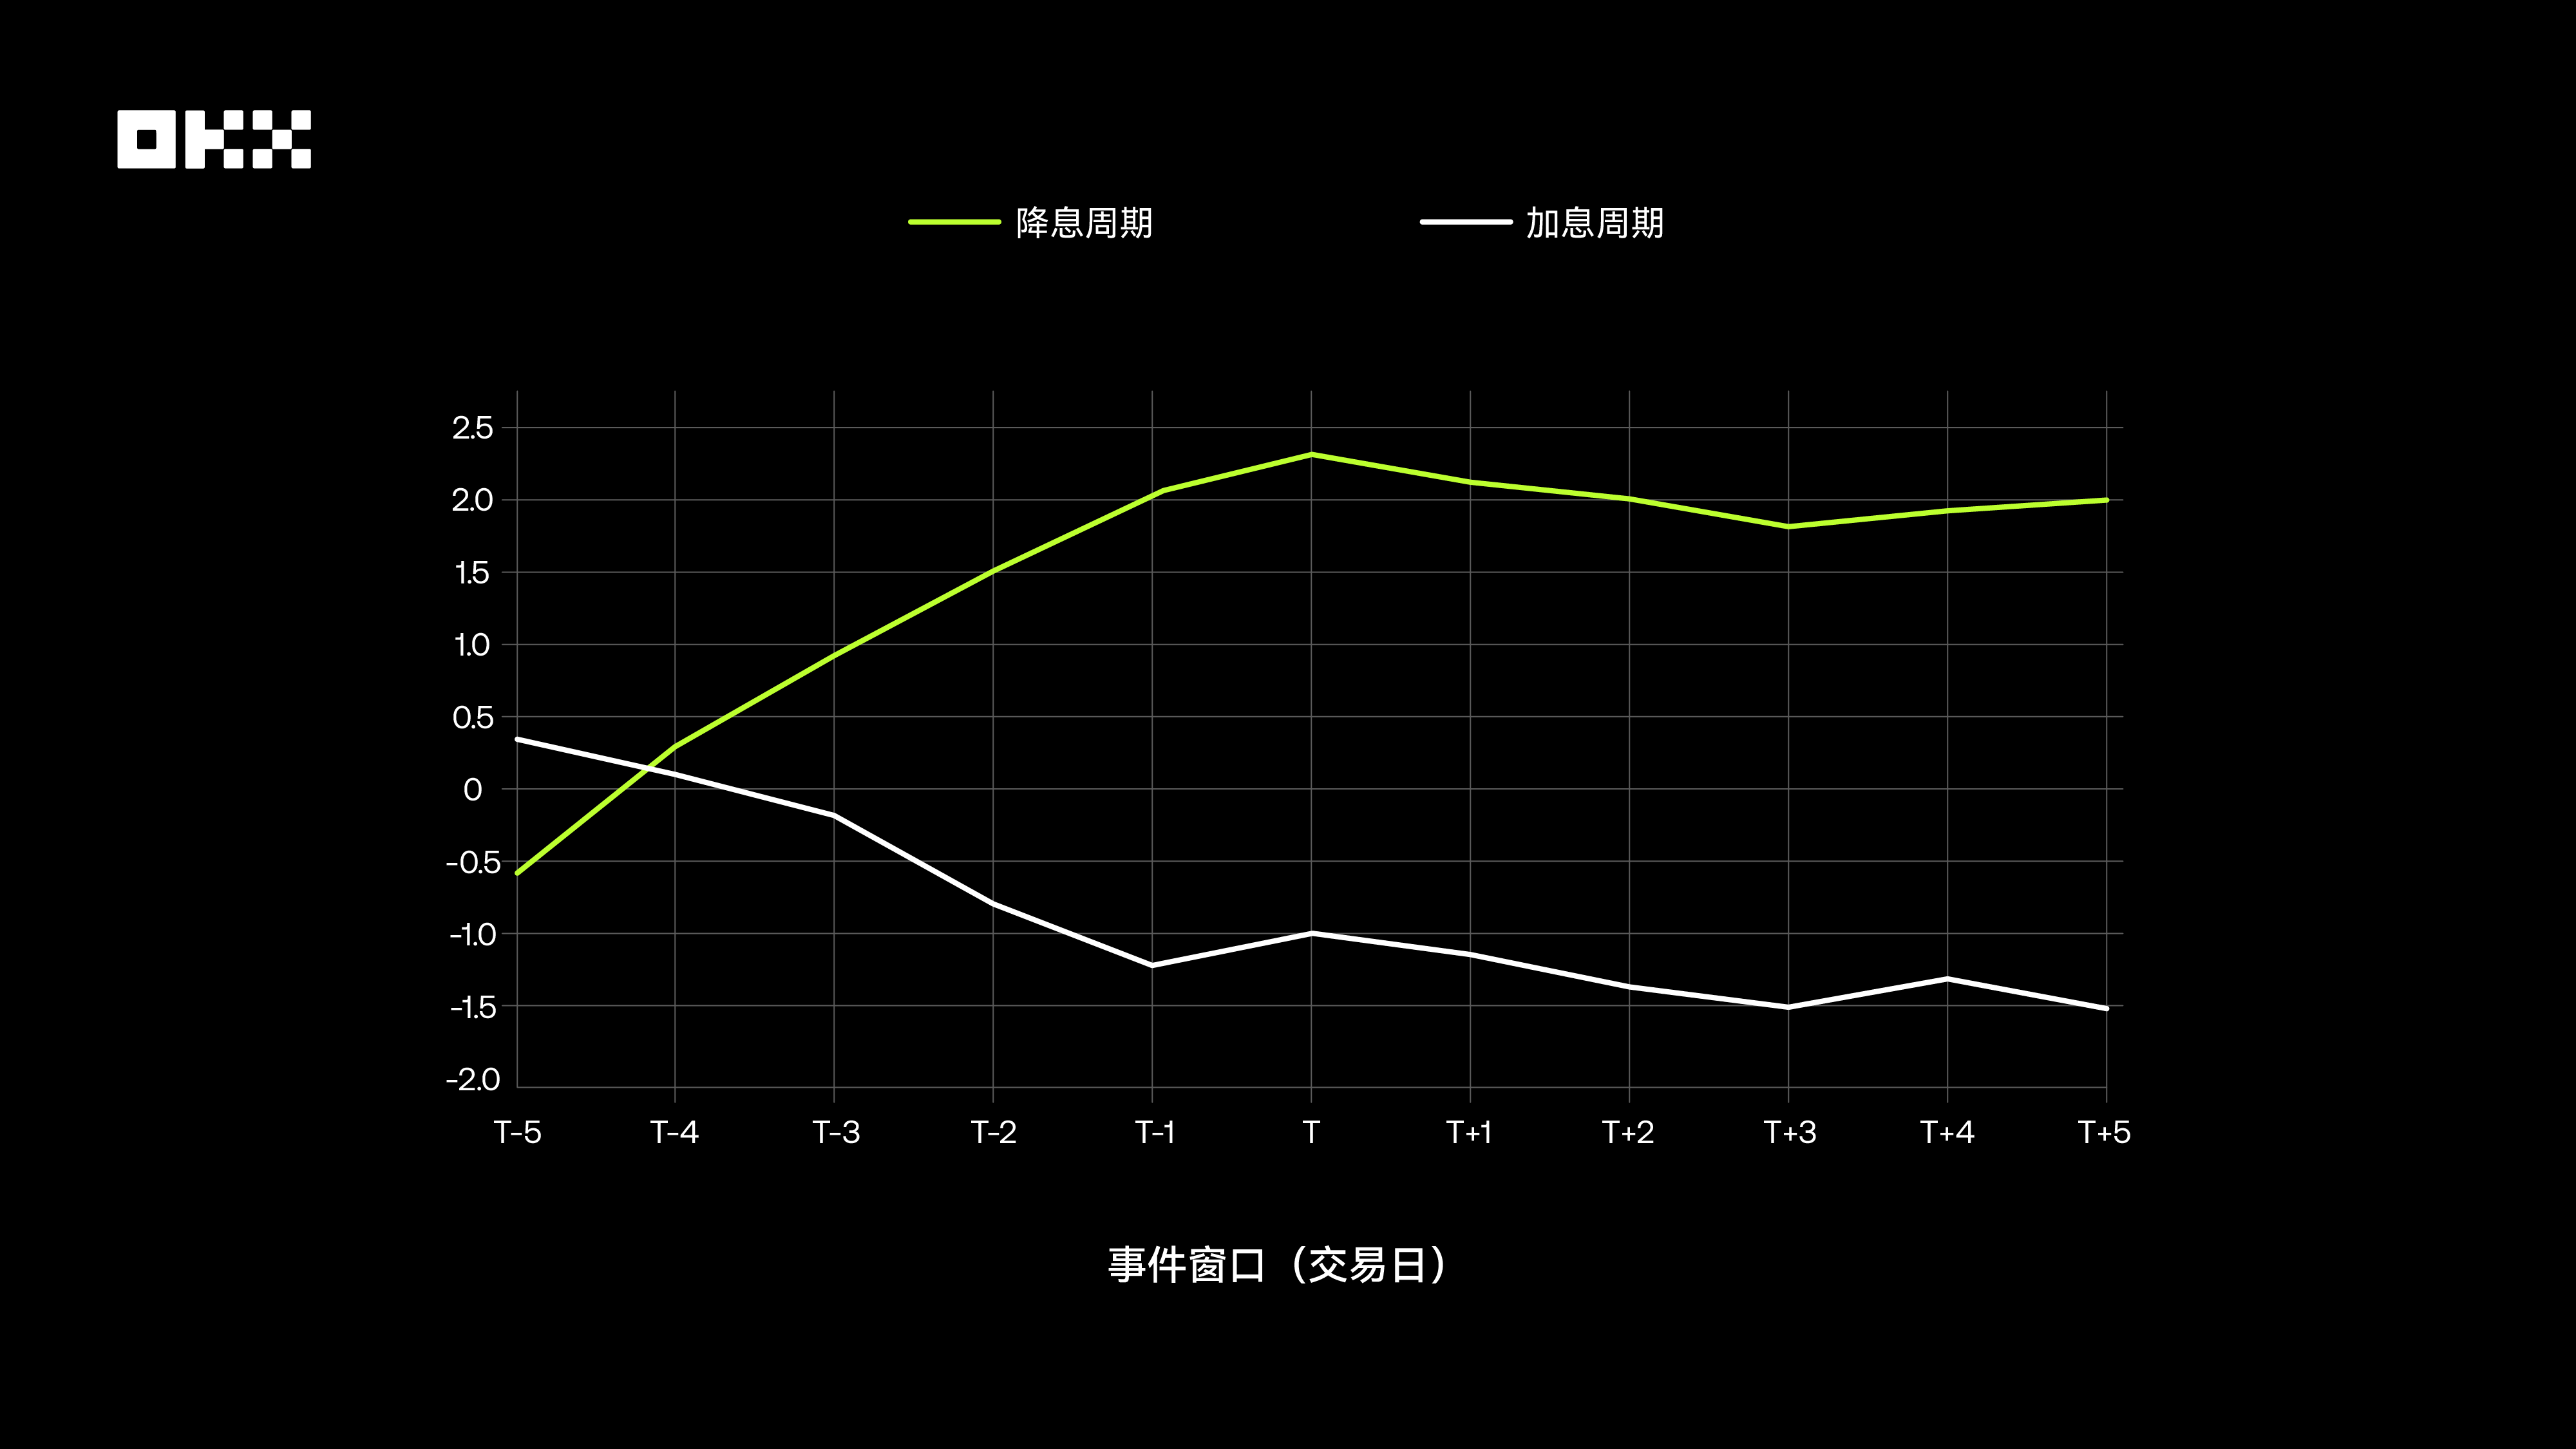
Moreover, research finds that the Bitcoin market exhibits a distinct "anticipatory trading" pattern. Ahead of rate hike announcements, markets often already price in the expectation, causing Bitcoin to weaken prematurely. Conversely, when rate cut expectations are strong, prices tend to rise in advance. On announcement day, if outcomes align with expectations, market reactions are usually muted. True volatility arises from "rate surprises"—when FOMC decisions deviate from market expectations priced via instruments like interest rate futures.
The chart below shows Bitcoin’s average cumulative abnormal return (CAR) relative to the S&P 500 during rate hike and cut windows (T-5 to T+5 days). It shows that during rate-cut cycles, Bitcoin achieves significant positive abnormal returns before the announcement, while during rate hikes, the effect is less clear or even negative. This suggests the market reacts more positively and earlier to anticipated rate cuts.
(4) January 2024: Approval of Spot Bitcoin ETFs – A Milestone Toward Mainstream Adoption
On January 10, 2024, the U.S. Securities and Exchange Commission (SEC) officially approved the first spot Bitcoin ETFs, marking a milestone in the legitimization and mainstreaming of crypto assets. The launch of ETFs drastically lowered the barrier for traditional investors to access Bitcoin. Data shows that after approval, Bitcoin trading volume surged and capital inflows strengthened. Chainalysis data indicates that ETF trading volume approached $10 billion daily in March, with cumulative inflow speed far exceeding that of the first gold ETF launched in 2005. This event not only pushed Bitcoin to new highs but, more importantly, is structurally transforming its investor base and market dynamics, forging an unprecedented tight link with the traditional financial system.
No Perfect Asset: Building a Cycle-Proof Portfolio
BTC/ETH were the undisputed "growth kings" of the past decade, delivering ultra-high returns unmatched by any traditional asset. However, this came at the cost of extreme volatility and deep drawdowns. Their rising correlation with traditional markets is weakening their value as pure diversification tools. They suit only investors with very high risk tolerance and a strong belief in long-term holding.
The S&P 500 serves as the "ballast" of long-term portfolios. It delivers excellent, sustainable compound growth and demonstrates the best balance in risk-adjusted metrics—both Sharpe and Calmar Ratios—making it the absolute core of any portfolio. While it experiences periodic corrections, its strong recovery ability and underlying support from the real economy make it indispensable.
Gold, as an ancient store of value, offers limited absolute returns but remains an essential "insurance policy" during macroeconomic uncertainty, geopolitical risks, or when confidence in fiat systems wavers. Its value in a portfolio lies not in offense but in defense.
The traditional "safe-haven" status of U.S. Treasuries faced severe challenges during an unprecedented rate-hiking cycle, reminding investors that "risk-free" is a relative concept. Nevertheless, they remain among the most liquid and highest-credit-rated assets globally, continuing to provide a foundational role in portfolio stability and liquidity that is unlikely to be replaced in the short term.
So, the classic question now has an answer: Should you choose dollar-cost averaging (DCA) or lump-sum investing?
Over the long term, for high-volatility assets (BTC/ETH), DCA shows significant advantages. By buying more shares at lower prices, DCA effectively smooths out costs, reduces timing risk, and ultimately generates substantial returns, with far less psychological stress than lump-sum investing.
For steadily growing assets (SPY), because equities trend upward over time, lump-sum investing historically outperforms DCA in most periods, as it allows capital to benefit earlier and more fully from market compounding.
For low-growth assets (GLD/IEF), the final outcomes of both strategies differ little, neither delivering explosive returns. The conclusion is that DCA is an effective strategy for managing highly volatile assets like Bitcoin, while for long-term, steadily growing equity markets, early lump-sum investment is usually optimal. Whether you prefer basic DCA, smart arbitrage, grid strategies for short-term trading, or advanced signal or iceberg strategies, OKX Strategy Trading meets all your needs in one place.
The "holy grail" of asset allocation isn’t finding a single best asset, but deeply understanding and skillfully combining the unique traits of different assets. A robust portfolio should use the sharpness of crypto to capture excess returns, rely on the depth of equities to drive long-term growth, and allocate the stability of gold and bonds to guard against unknown risks. Ten years of data tell us: markets constantly evolve, and there are no eternal winners. The true "king of assets" may not reside in any single asset, but in a rational, disciplined investment framework capable of understanding and mastering the diverse characteristics of different assets.
Disclaimer:
This article is for informational purposes only. The views expressed are those of the author and do not necessarily reflect the positions of OKX. This article does not constitute (i) investment advice or recommendations; (ii) an offer or solicitation to buy, sell, or hold digital assets; or (iii) financial, accounting, legal, or tax advice. We do not guarantee the accuracy, completeness, or usefulness of the information provided. Holding digital assets (including stablecoins and NFTs) involves high risk and may experience significant volatility. Past performance is not indicative of future results. You should carefully consider whether trading or holding digital assets is suitable for your financial situation. For specific advice, please consult your legal/tax/investment professionals. You are solely responsible for understanding and complying with applicable local laws and regulations.
Join TechFlow official community to stay tuned
Telegram:https://t.me/TechFlowDaily
X (Twitter):https://x.com/TechFlowPost
X (Twitter) EN:https://x.com/BlockFlow_News


