Decoding the Bottom Signal: The Script of Crash and Rebound in the Crypto Market
TechFlow Selected TechFlow Selected
Decoding the Bottom Signal: The Script of Crash and Rebound in the Crypto Market
It is necessary to understand the psychological mechanisms behind risks and leverage this insight to identify potential market bottoms.
Author: Doc
Translation: Tim, PANews
The purpose of this article is to help you understand how I identify key signals in the market. We need to grasp the psychological mechanisms behind risk, and use that understanding to spot potential market bottoms.
1. The Lower the Consensus, the Sooner It Crashes
When uncertainty hits, sellers offload the assets they believe in least. For example, low-consensus coins will crash first and bleed earlier.
Think logically: if you urgently needed cash, you wouldn’t sell your most valuable possessions—you’d sell what you don’t use or value much.
Similarly, when traders are uncertain about market direction or want to reduce exposure, they often liquidate the assets they’re emotionally least attached to.
This isn't coincidental—it happens every Bitcoin cycle. Altcoins don’t rally after Bitcoin tops; they rise alongside Bitcoin’s peak. But they show signs of weakness earlier, topping out weeks before Bitcoin does.
This is an early warning signal. Smart traders reduce risk before others even realize something is happening.
2. Risk vs. Blue-Chips
Returning to the previous logic: people hold onto their most valued, high-quality assets as long as possible, only selling them as a last resort.
The most sought-after cryptocurrencies tend to defend their gains until the very end. That's why Bitcoin always appears strong—right up until it isn’t—and why social media fills with tweets like “Why panic? Bitcoin is still holding steady” just before every major crash.
Selling order typically follows this sequence:
a) First, the junk coins
b) Then, the blue-chip coins
c) Finally, everything gets sold
3. Reflexivity Kicks In
Weakness breeds more weakness.
When large holders (whales) begin dumping into weakening demand, it triggers market fragility. This is classic distribution-phase behavior: weak buying, drying-up demand, and momentum shifting.
A shift in risk asset behavior causes experienced traders and core decision-makers to reevaluate their strategies.
"I didn’t sell at the top, but the nature of the market has changed. Time to reduce exposure or exit."
"If this kind of drop already feels like a nuclear meltdown, what other landmines are hiding in my portfolio?"
Suddenly: position adjustments trigger further selling. This is reflexivity—a positive feedback loop of declining risk appetite.
4. Volatility: The Final Dance
Before a major Bitcoin downturn, markets often fall eerily quiet: volatility drops sharply, price moves sideways, and complacency peaks.
Then—bang—the crash comes.
Now, let’s focus on the essence of balance and imbalance in markets.
Balance occurs when market participants gradually agree on what’s expensive and what’s cheap. It’s a coordinated dance. This is equilibrium.
Equilibrium means calm. Known information is priced in, speculation fades, and volatility contracts.
This dance continues until one side grows tired, bored, or decides to head to the bar for another drink—that is, buyers or sellers become exhausted, or supply and demand shift.
Equilibrium breaks. Once disrupted, imbalance emerges.
Price sharply deviates from its prior range. Value becomes unclear; volatility explodes. The market craves balance and actively seeks it.
Prices often revert toward areas where recent balance formed—high-volume nodes, order blocks, or fair value gaps.
It’s precisely in these zones that you’ll see the strongest rebounds.
"First test, best test." Subsequent retests tend to produce weaker reactions. Structure forms. Price stabilizes at new levels. Volatility contracts. Balance returns.
5. Selling Phases and Bottom Identification
Surrender selling isn’t the beginning of the end—it’s the end of the middle stage.
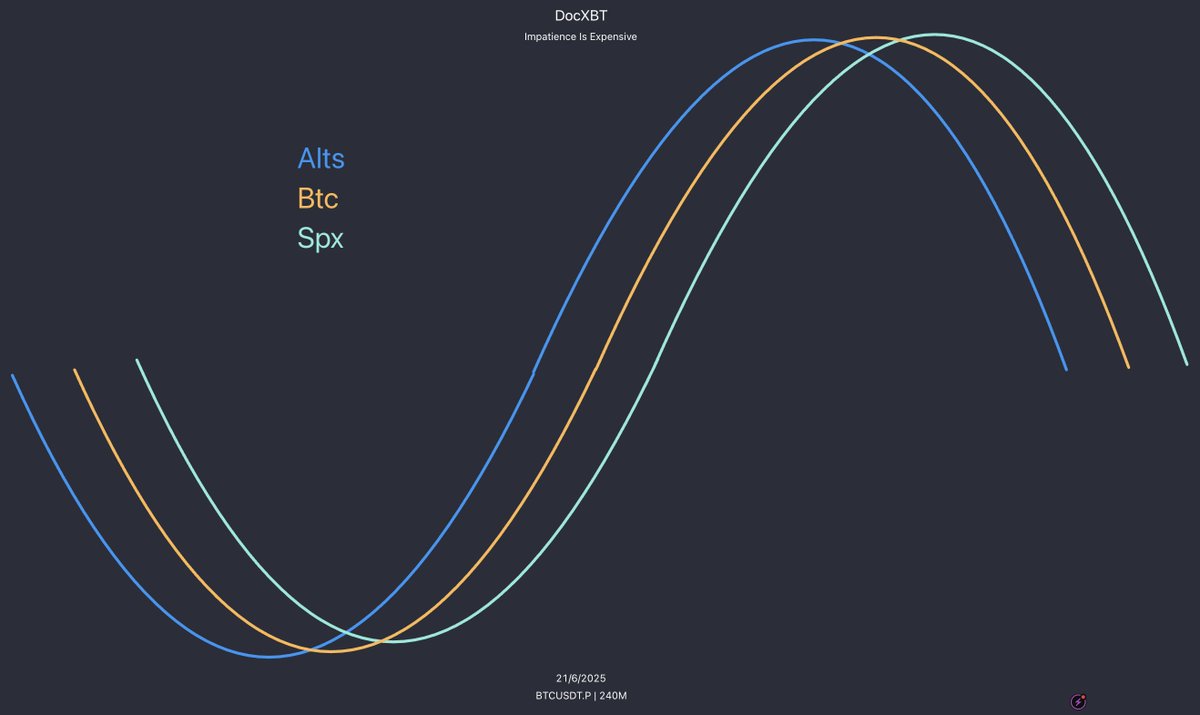
a) Alts vs. Bitcoin
In this cycle, altcoins typically complete their main selling phase before Bitcoin begins to crack.
Recent example: Fartcoin had already dropped 88% from its peak by late February—weeks before Bitcoin’s breakdown. Since this pattern holds, we can use it as a trading signal when looking for exhaustion (bottoming signs).
While Bitcoin is still volatile and seeking a new equilibrium, the strongest altcoins will start showing signs of relative strength and exhaustion.
In short, when Bitcoin enters the late stages of imbalance, look for quality altcoins to build balanced positions.
As participants, our goal is to capture these divergences.
"Has market momentum shifted?"
"Is volatility contracting?"
"Is the pace of selling slowing down?"
"Can it hold steady even when Bitcoin makes new lows?"
Q2 bottoming signals:
-
Momentum fading (e.g., Fartcoin)
-
SFP, deviation (e.g., Hype, Sui chain)
-
Higher lows while Bitcoin makes lower lows (e.g., Pepe)
Altcoins usually lead the downside. After Bitcoin bottoms, their declines slow.
This is exactly where the skill of identifying quality alts comes into play.
The weak keep falling.
The strong quietly position themselves ahead of the next move.
b) Bitcoin vs. S&P 500
Here’s a small exercise for you.
Integrate all the concepts discussed, and the following patterns may make sense:
-
Summer 2023: Bitcoin topped and bottomed before the S&P 500
-
Summer 2024: Bitcoin topped earlier than the S&P 500 and absorbed its macro-driven plunge at lower ranges
-
So far in 2025: Bitcoin topped ahead of the S&P 500 and endured a 20% S&P drop while consolidating near its range lows
Core Conclusion
Market bottoms are a process, not a single moment: alts lead → Bitcoin follows → S&P trails
Key takeaway: Focus on evolving market structure, not just sentiment swings
Join TechFlow official community to stay tuned
Telegram:https://t.me/TechFlowDaily
X (Twitter):https://x.com/TechFlowPost
X (Twitter) EN:https://x.com/BlockFlow_News