Altcoin April Recovery Checkup: Over 70% Gained, Small-Cap Tokens Dominate Gain Charts
TechFlow Selected TechFlow Selected
Altcoin April Recovery Checkup: Over 70% Gained, Small-Cap Tokens Dominate Gain Charts
New tokens show greater gains, while older projects perform the worst.
 Navigating Web3 tides with focused insights
Author: Frank, PANews
After a period of sharp market adjustments, the cryptocurrency market saw a slight warming trend in April. While mainstream assets like Bitcoin continued to trade sideways, seeking direction, signs of recovery emerged in the altcoin sector, with market sentiment improving compared to earlier periods. How did various tokens perform during this month-long rebound (from April 1 to April 28, 2025)? Which sectors and ecosystems showed greater resilience? PANews analyzed data from Binance's USDT spot trading pairs to uncover the true picture of recent market dynamics.
Data Notes: This study is based on USDT spot trading pairs from the Binance exchange, combined with fundamental information such as token categories and market capitalizations provided by CoinGecko. A total of 397 valid tokens were included in the analysis. The time frame covers April 1 to April 28, 2025. Price changes are calculated using opening prices on April 1 and closing prices on April 28.
Over 70% of Tokens Rose, but Gains Were Generally Moderate
Overall, the market did show broad-based gains in April. Among the 397 tokens analyzed:
The average increase was 13.11%, with a median gain of 7.73%. This indicates that while upward movement was dominant, the strength of the rally was modest—most tokens experienced limited appreciation.
As many as 74.1% of tokens posted gains, nearly three-quarters seeing positive rebounds in April. Only 25.7% declined.
However, looking at the distribution of gains, only a small number of tokens surged significantly. Most price increases were concentrated below 50%. Just 3.0% of tokens—12 in total—rose over 100%; notably, six of these launched on Binance in April, so their returns appear inflated due to being measured from initial listing prices. Another 3.3% gained between 50% and 100%. The largest group, 67.8%, rose between 0% and 50%.
These figures suggest that although market sentiment has improved, it remains far from the euphoric "altseason" seen in previous cycles. Most token gains have been restrained, indicating structural opportunities rather than widespread bullish momentum.
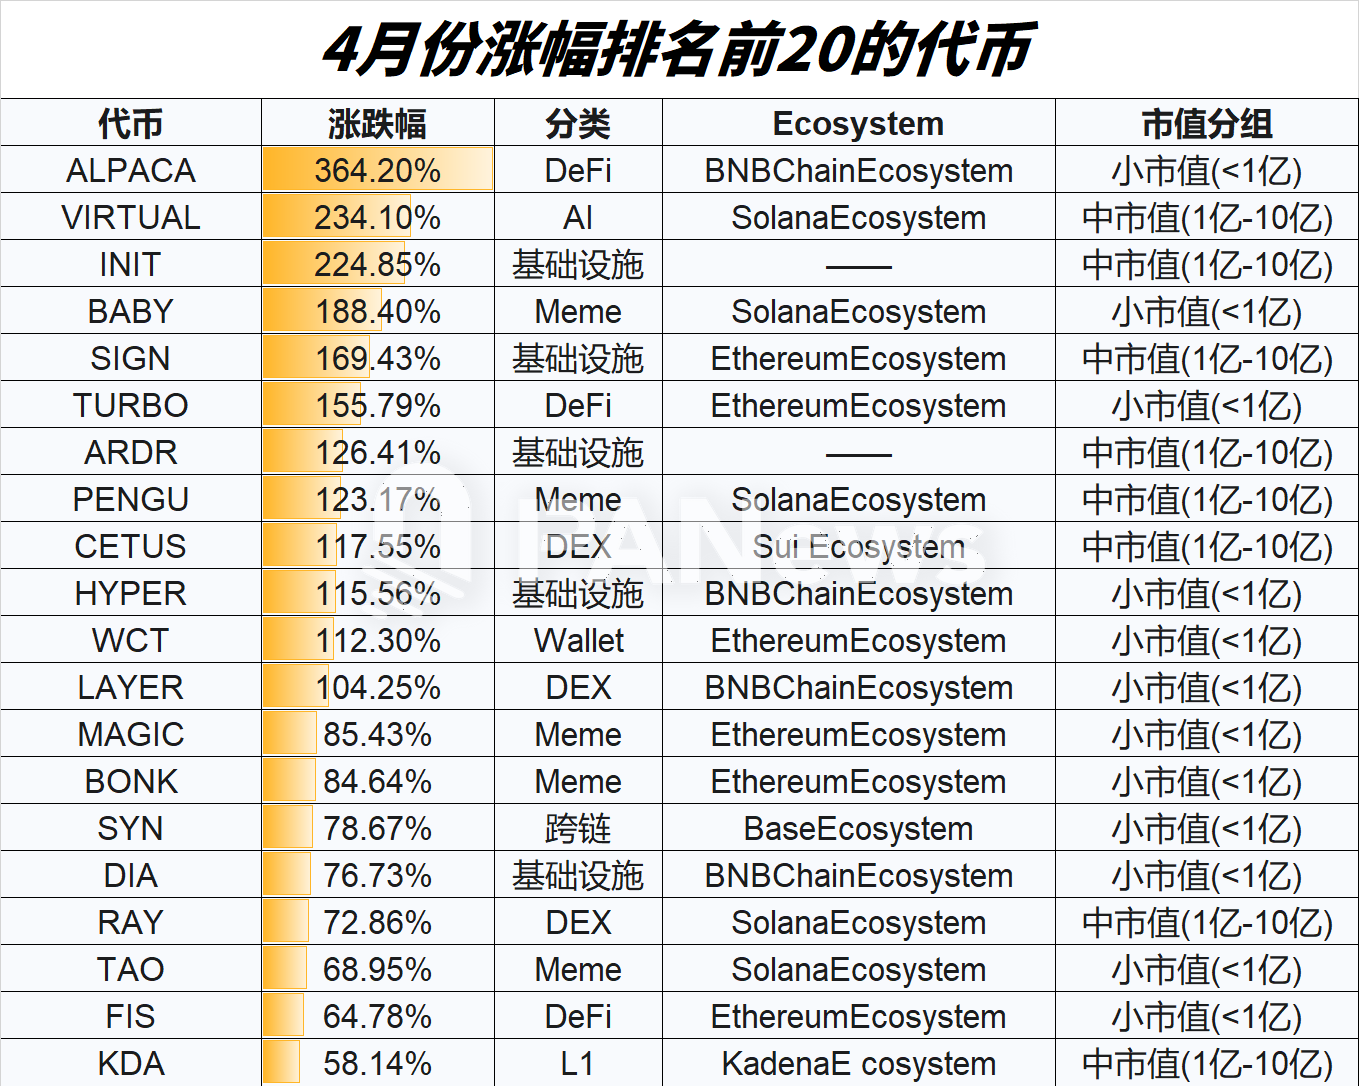
Examining the top performers reveals several patterns:
Small-cap tokens dominate: Many of the top 20 gainers fall into the small-cap (< $100M) or mid-cap ($100M–$1B) range, suggesting investors are chasing higher volatility and upside potential.
Signs of DeFi recovery: Projects such as ALPACA, TURBO, and FIS—primarily DeFi-related—appeared near the top of the list.
AI and Meme coins remain hot: VIRTUAL (AI), BABYUSDT (Meme), and PENGUUSDT (Meme) stood out, continuing prior trends of strong investor interest.
Infrastructure and DEXs: Multiple tokens from infrastructure and decentralized exchange (DEX) sectors also made the list.
Specific ecosystems: Solana and BNB Chain contributed a notable number of high-performing tokens this month.
By Launch Year: Newer Tokens Outperformed, Older Projects Lagged
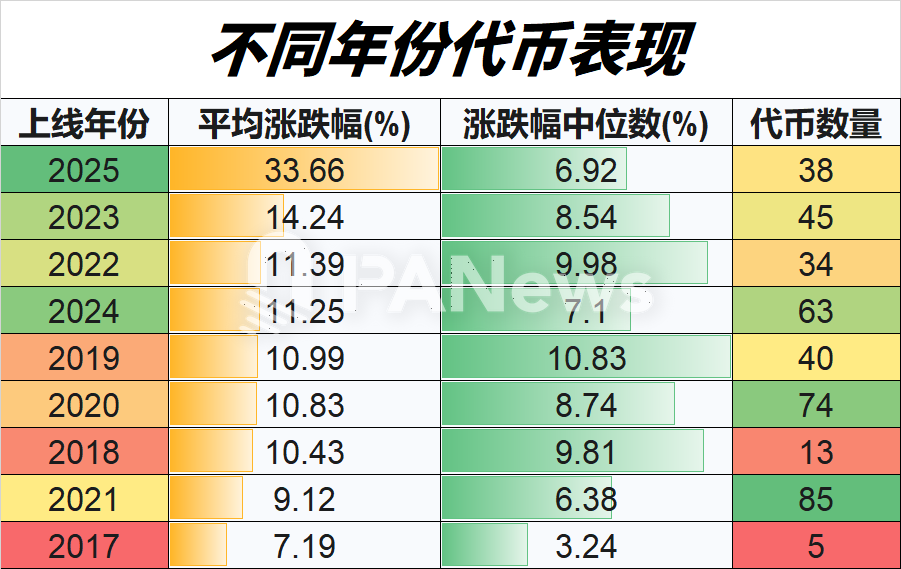
Another clear trend in this rebound phase is the market’s continued preference for “new over old.” Data shows that tokens launched in 2025 delivered the strongest average performance, rising 33.66%—significantly outperforming those from other years. This reflects persistent investor appetite for new assets. Tokens launched in 2023 and 2022 followed closely behind in performance. Interestingly, despite having the highest count (63), tokens launched in 2024 underperformed with an average gain of just 11.25%, slightly above older projects from 2019 and 2020. Even more strikingly, legacy projects from 2017 posted the lowest average gains. As for 2021—the peak of the last bull cycle—tokens from that year ranked second-to-last, possibly due to inflated valuations during the boom leaving little room for renewed growth.
This distribution suggests that tokens launched during bear markets (2022–2023) may possess stronger long-term momentum, whereas those launched during bull runs often lack staying power.
Infrastructure and AI Shine
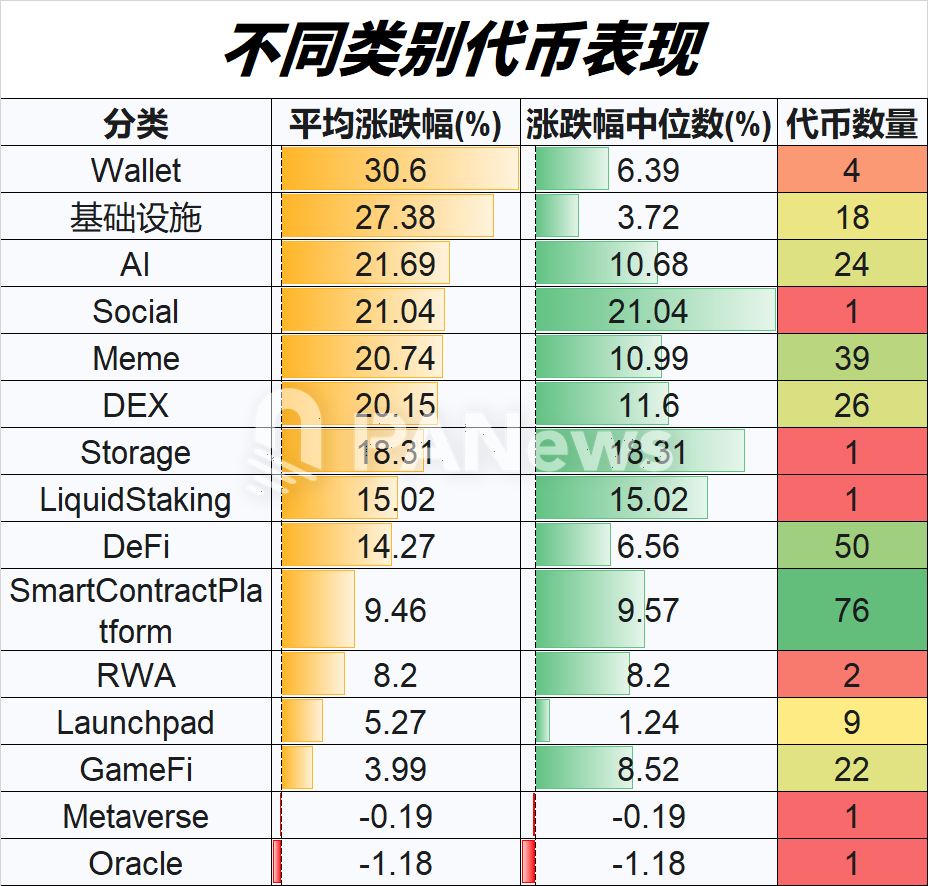
From a sector perspective, wallets, infrastructure (average gain: 27.38%), and AI (21%) recorded the highest average increases this month. However, the wallet category includes only four tokens, with WCT—a newly listed project—skewing the average upward. Excluding this outlier, real gains in the wallet space may be closer to 5%. Meme coins and DEXs followed closely. These results align with observations from the overall leaderboard.
DeFi, one of the largest sectors, performed moderately well. Smart Contract Platforms (blockchain layer-1s) include numerous tokens but lagged in average performance. RWA (Real World Assets), despite growing attention recently, showed unremarkable results. The worst performers were Metaverse and Oracle tokens, though both categories had relatively few samples in this dataset.
Sui, Base, and Solana Ecosystems Show Strongest Average Gains
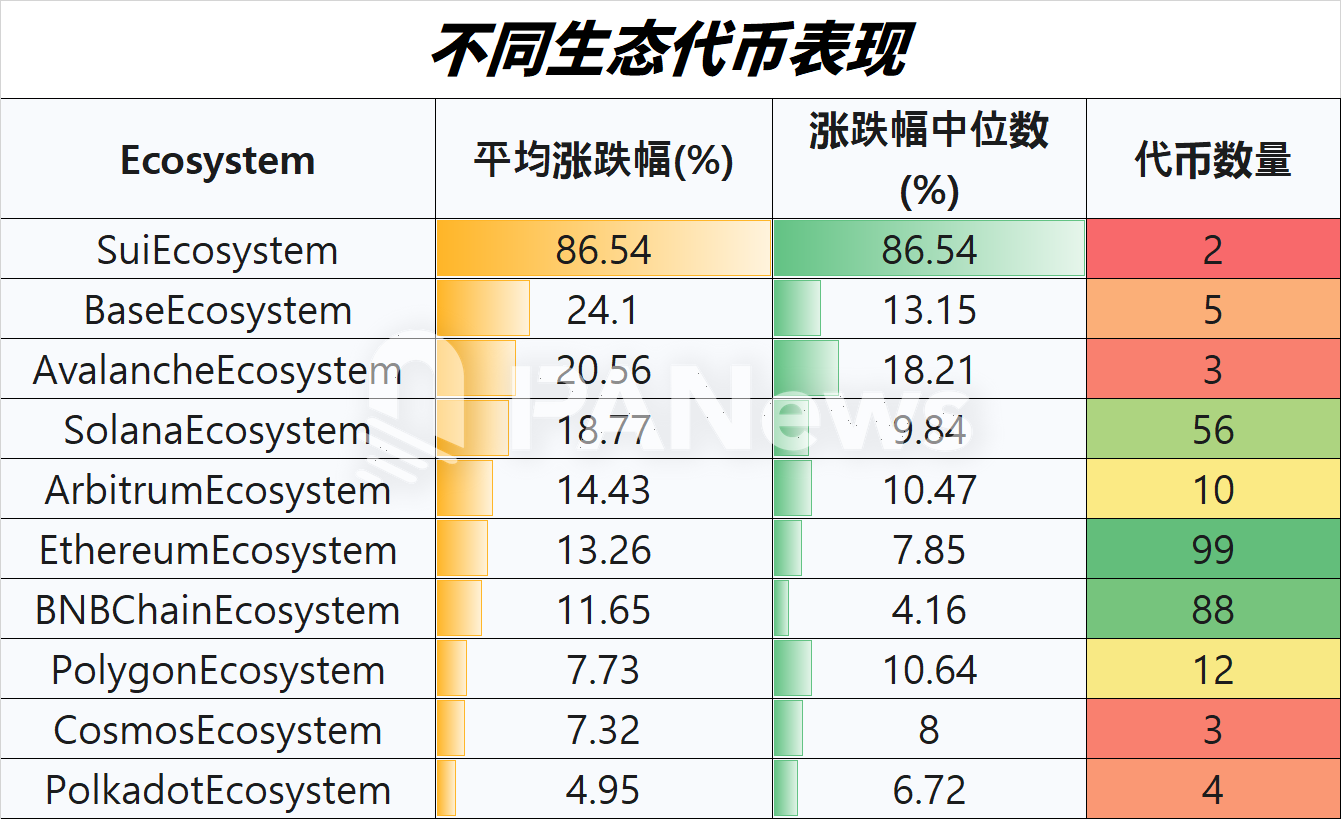
Among different blockchain ecosystems, Sui achieved the highest average gains. Although Binance lists relatively few Sui-based tokens, broader market data confirms Sui as one of the best-performing ecosystems in this rebound cycle. Base, Avalanche, and Solana followed with relatively strong average returns. However, given the limited number of listed tokens from Base and Avalanche, caution is warranted when interpreting these figures. Real-world data suggests Base indeed experienced a significant rebound, while Avalanche’s actual performance may be much weaker than indicated here. Arbitrum came next. Ethereum and BNB Chain, the two largest ecosystems by token count, performed close to or slightly below the market average. Polygon, Cosmos, and Polkadot ranked toward the lower end this month. It should be noted that these findings reflect only tokens listed on Binance and may not fully represent each ecosystem’s broader token landscape.
Mid- and Large-Cap Tokens Performed Better on Average
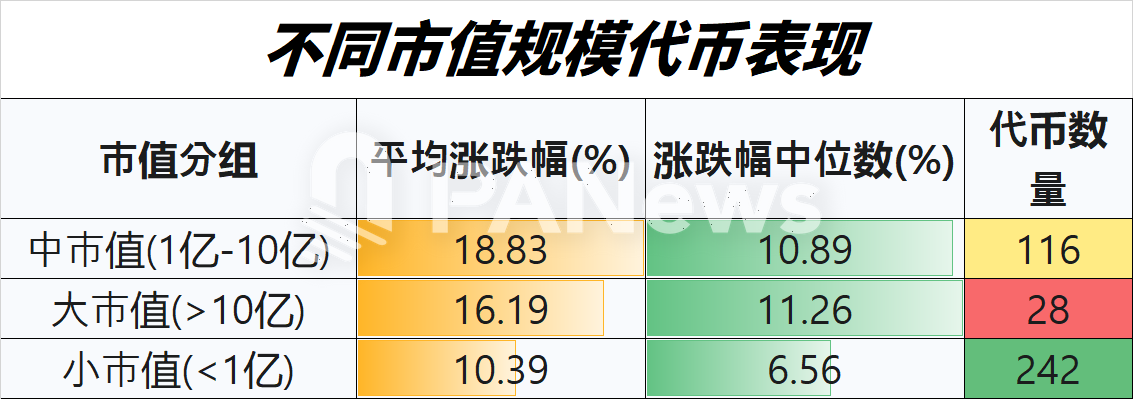
PANews introduced an additional dimension in this analysis: how tokens of varying market caps performed during the rally. Contrary to the common belief that small-cap tokens offer higher elasticity, mid-cap ($100M–$1B) and large-cap (>$1B) tokens actually posted slightly higher average gains than small-cap (<$100M) ones in April. This could indicate that capital flowed more toward established, consensus-backed assets rather than purely speculative micro-caps during this rebound. In terms of quantity, small-cap tokens still dominate Binance listings—with 242 tokens (about 60% of the sample). Mid-cap tokens number 116, while only 28 have market caps exceeding $1 billion. Overall, the token market remains highly fragmented in size distribution.
In summary, April’s rebound—while positive—did not mark the dramatic turnaround some investors hoped for. Some intriguing patterns emerged: newer tokens attracted stronger investor interest, while those launched during the last bull market largely underperformed. Mid- and large-cap tokens saw better average gains, yet small-cap tokens still dominated the extreme gainers (12 of the top 20 gainers had market caps below $100 million). For investors, the current environment appears more suited to selective bets on specific tokens and sectors, rather than waiting for a broad-based “altseason” surge.
(This article is based on historical data analysis and does not constitute any investment advice. Cryptocurrency markets are highly volatile; invest with caution.)
Join TechFlow official community to stay tuned
Telegram:https://t.me/TechFlowDaily
X (Twitter):https://x.com/TechFlowPost
X (Twitter) EN:https://x.com/BlockFlow_News
 PANews