On-Chain Data School (4): Visualized BTC Cost Distribution Chart
TechFlow Selected TechFlow Selected
On-Chain Data School (4): Visualized BTC Cost Distribution Chart
URPD can be used to observe the turnover and distribution between chips, and provide guidance on trends.
Author: Mr. Berg
🔸TL;DR
- This article introduces the URPD on-chain metric.
- URPD shows the distribution of BTC held at different cost bases.
- URPD can be used to observe chip turnover and distribution activity, providing guidance on market trends.
🟡 Introduction to URPD
URPD stands for UTXO Realized Price Distribution.
Due to Bitcoin's unique UTXO blockchain structure, we can track data on-chain that is unavailable in traditional financial markets.
The URPD chart is an indicator derived from this principle: the horizontal axis represents price, and the vertical axis represents the amount of BTC.
For example, if there are 500,000 BTC worth of chips positioned at $80,000,
This means "500,000 BTC were acquired at a cost basis around $80,000."
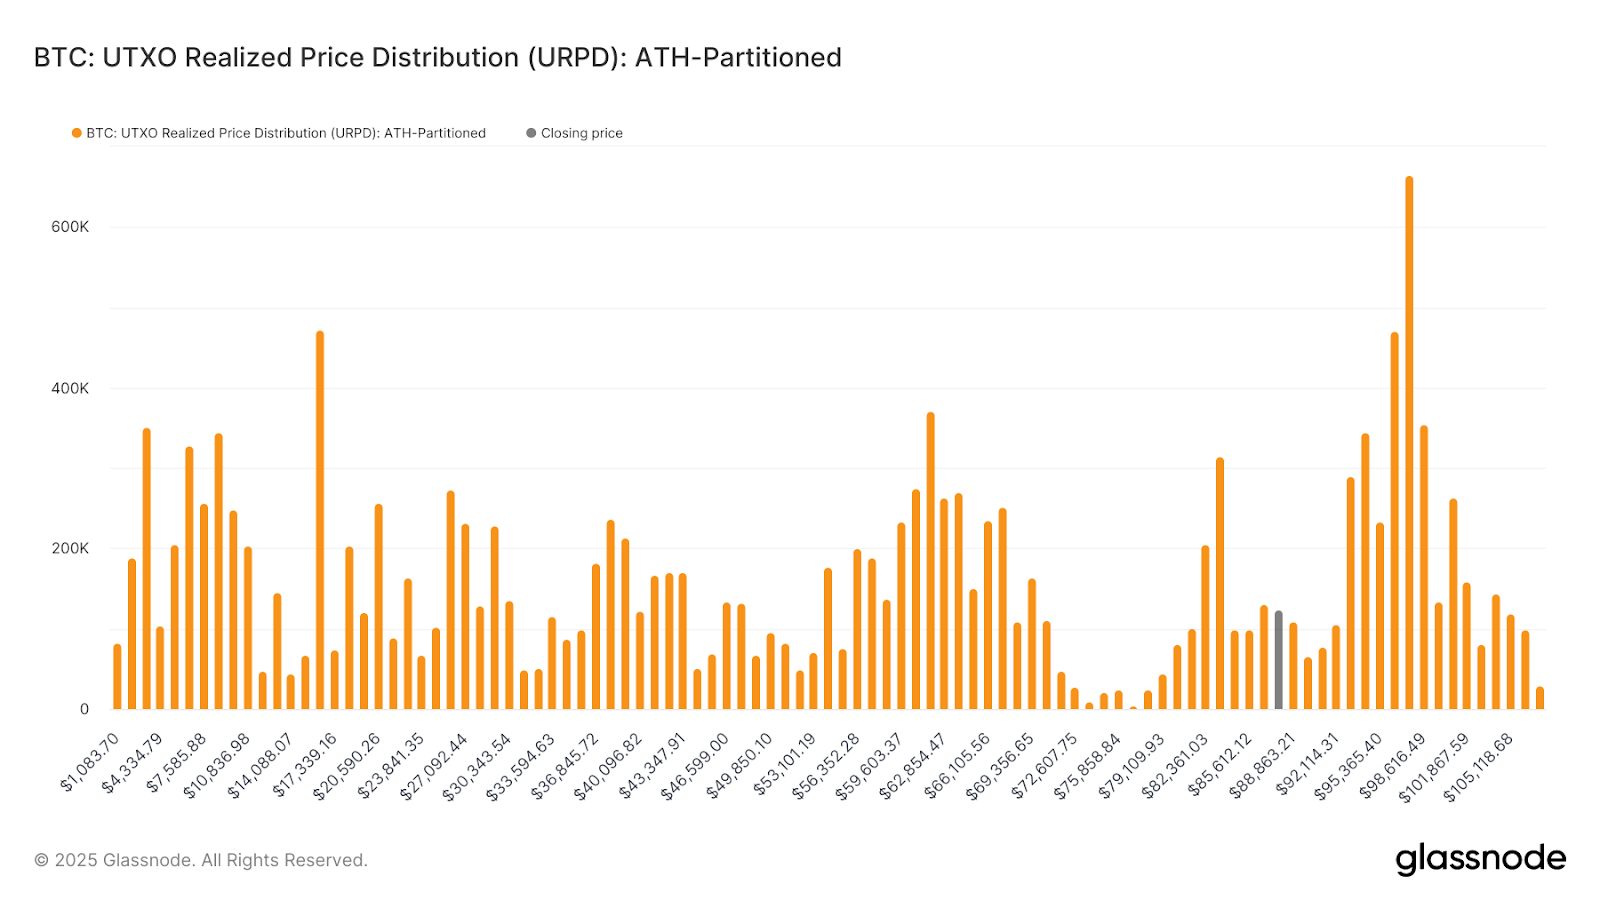
(Example of a URPD chart)
🟡 Chip Turnover, Accumulation, and Distribution
With an understanding of URPD, we can analyze daily changes in the URPD to observe chip turnover across different price levels.
For instance: below is the URPD chart from May 1, 2024:
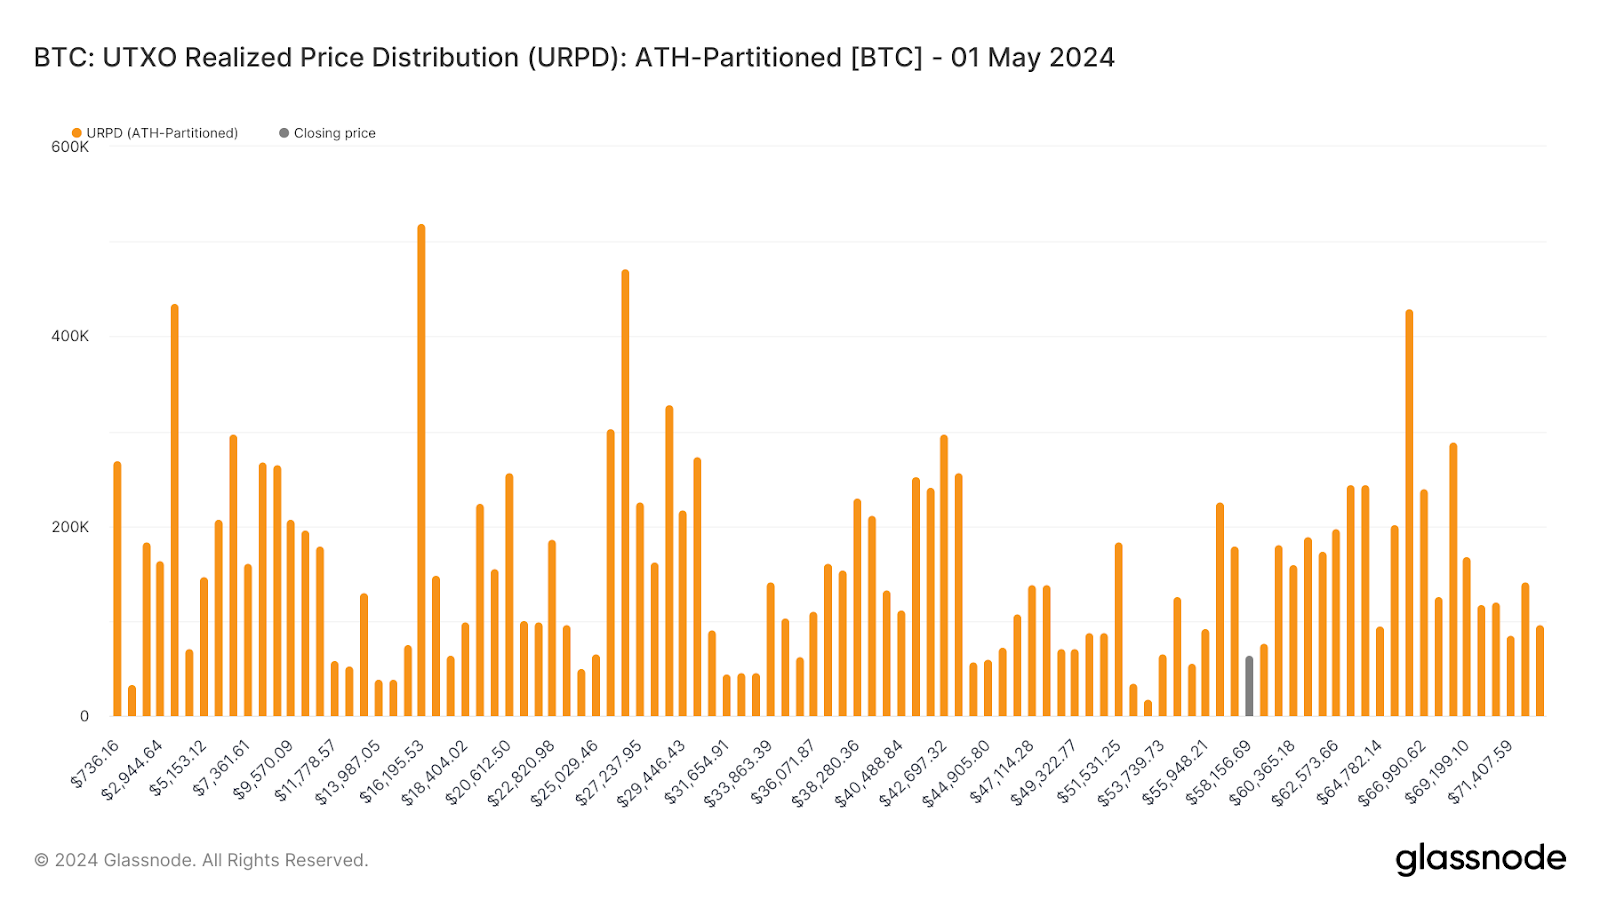
(URPD Chart on May 1, 2024)
Now let’s look at the URPD chart five months later, on October 1, 2024:
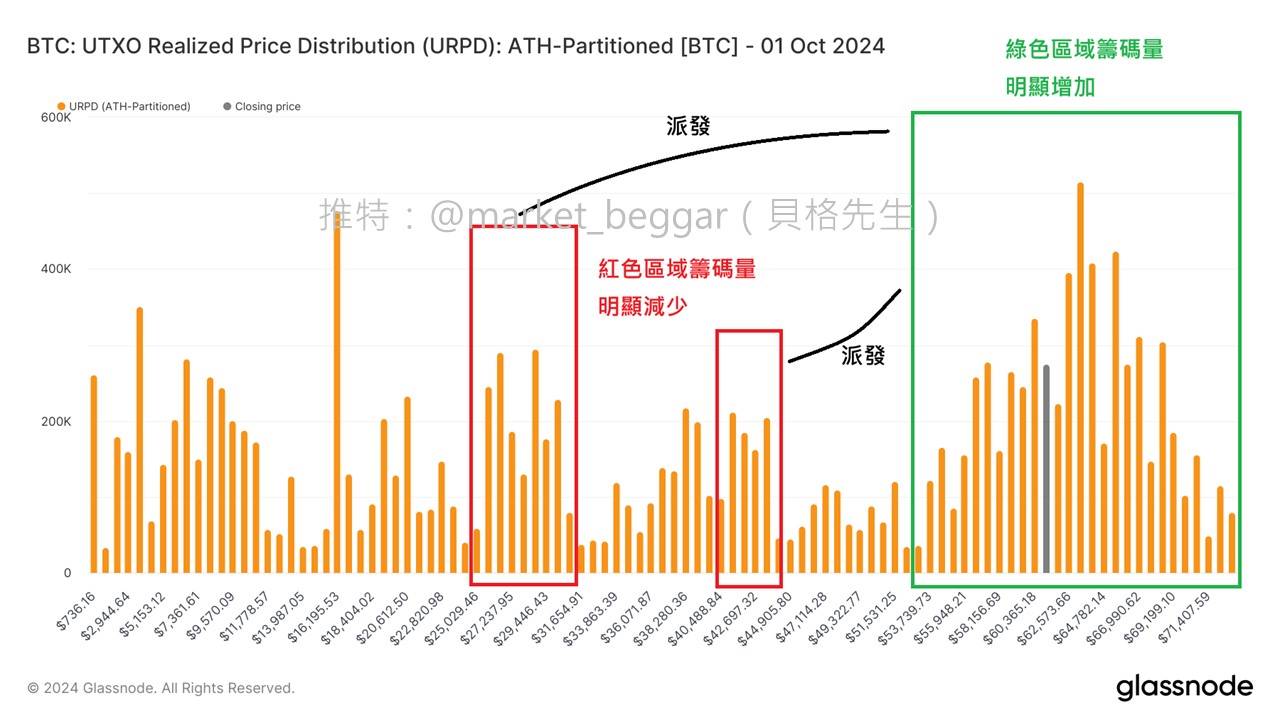
(URPD Chart on October 1, 2024)
After five months of wide-ranging price consolidation, we can clearly observe the phenomenon of "low-cost chips being distributed upward."
Historically, market tops often coincide with the near-completion of distribution by highly profitable, low-cost holders. Conversely, during market bottoms, large amounts of BTC tend to accumulate within relatively narrow price ranges.
Therefore, when conducting analysis, URPD is often used in conjunction with other on-chain metrics (such as Realized Profit, MVRV, etc.) to gain a more comprehensive understanding of market conditions.
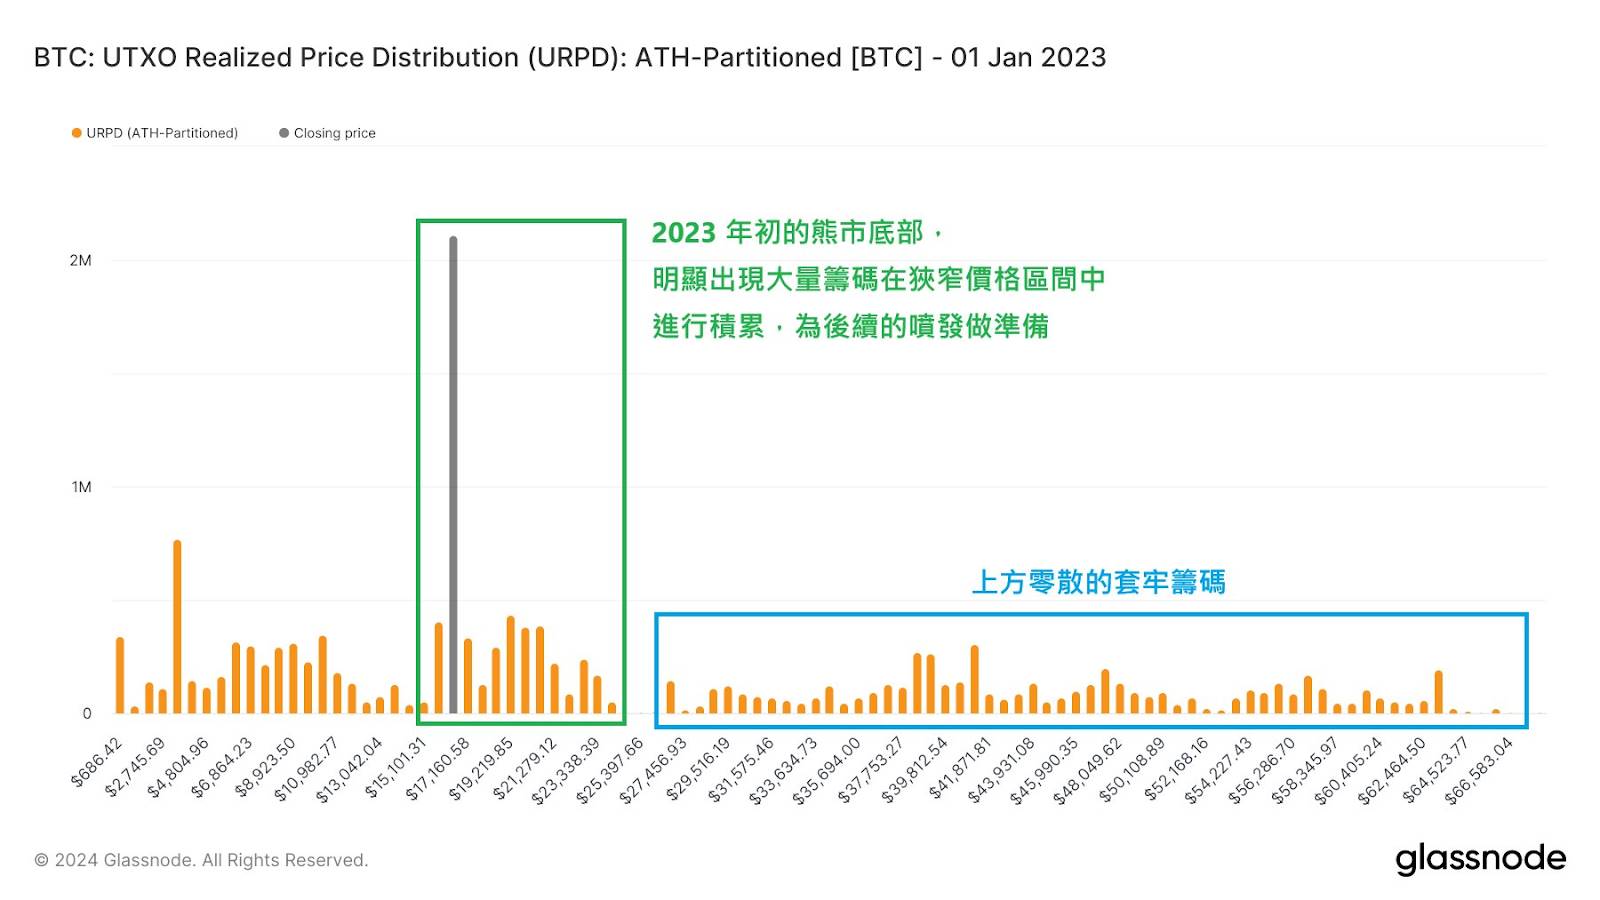
(URPD Chart on January 1, 2023, near the bottom of the bear market)
🟡 Support, Resistance, and Market Consensus
When a large number of chips begin to accumulate within a specific price range, it indicates growing supply-demand consensus around that level.
If the price subsequently rises sharply away from this zone, the significant turnover that occurred there may provide strong support in the future.
Conversely, if the price breaks below this zone, the large number of chips accumulated there will likely become trapped, potentially acting as resistance during any future recovery.
Join TechFlow official community to stay tuned
Telegram:https://t.me/TechFlowDaily
X (Twitter):https://x.com/TechFlowPost
X (Twitter) EN:https://x.com/BlockFlow_News