

Sifting Gold from Sand: Finding Long-Term Investment Opportunities That Survive Bull and Bear Markets (II)
TechFlow Selected TechFlow Selected
Sifting Gold from Sand: Finding Long-Term Investment Opportunities That Survive Bull and Bear Markets (II)
Even in a "copycat bear market," betting on projects with strong fundamentals can generate alpha returns that outperform BTC and ETH.
Authors: Alex Xu, Lawrence Lee
In our previous article, "Gold Among the Sand: Identifying Long-Term Investment Opportunities Across Market Cycles (2025 Edition, Part 1)", we reviewed and introduced several projects in the lending sector—Aave, Morpho, Kamino, MakerDAO—and staking sector—Lido, Jito. This article, the second in the series, continues to explore projects with strong fundamentals and long-term potential.
PS: The views expressed herein reflect the authors' opinions as of publication and may evolve over time. These perspectives are highly subjective and may contain inaccuracies in facts, data, or logical reasoning. All opinions presented are for informational purposes only and should not be construed as investment advice. We welcome feedback and further discussion from peers and readers.
III. Trading Sector: Cow Protocol, Uniswap, Jupiter
3.1 Cow Protocol
Business Overview
Products and Mechanism
Cow Protocol is a decentralized trading aggregation protocol, with its core product being CoW Swap, a decentralized trade aggregator. The "CoW" in its name stands for Coincidence of Wants—the concept of directly matching buyers’ and sellers’ needs through an order-matching mechanism. CoW Swap uses batch auctions as its price discovery mechanism, aggregating users’ trading intents (orders) and settling them collectively every block.
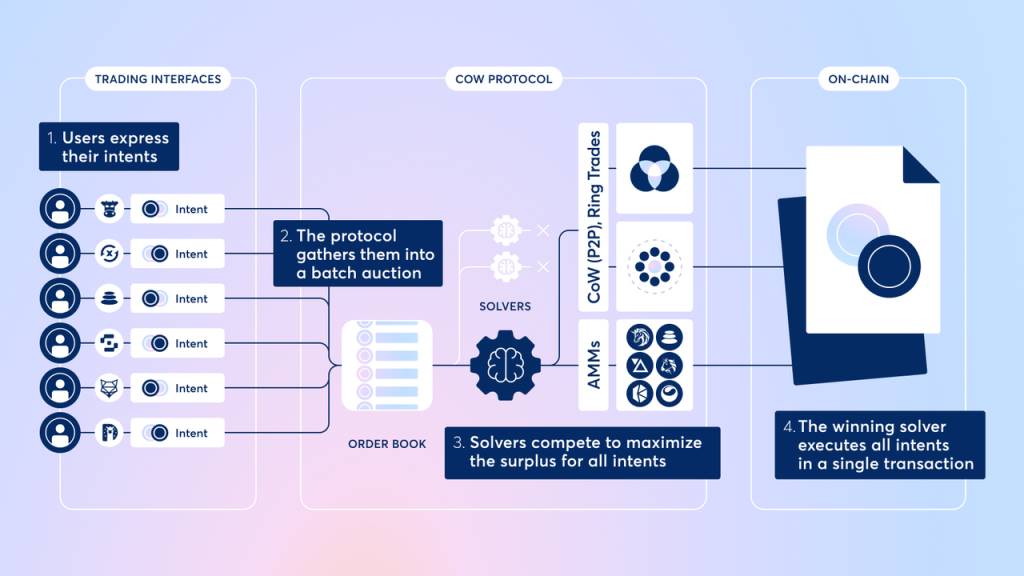
This model enables direct peer-to-peer order matching without relying on traditional market makers or liquidity pools. When two parties wish to exchange assets they each desire, trades can settle directly, eliminating intermediary fees. For orders that cannot be matched directly, CoW Swap routes residual demand to decentralized exchanges (DEXs) or other aggregators to source liquidity. This design minimizes slippage and transaction fees while ensuring all trades within a batch share the same clearing price, removing price unfairness caused by execution sequence.
Additionally, CoW Swap introduces a Solver bidding mechanism: multiple third-party solvers compete to provide optimal trade execution solutions, with the winner earning the right to execute the batch and cover on-chain gas costs. Users only need to sign their order off-chain, avoiding direct payment of gas fees; unexecuted orders incur no cost. This “intent-based matching + solver competition” model improves user experience (no risk of failed transactions wasting gas) and offers MEV (Maximal Extractable Value) protection—since matching occurs off-chain, solvers must bid to return MEV value to users, making frontrunning and sandwich attacks significantly harder.
Currently, CoW Swap operates on Ethereum, Arbitrum, Gnosis, and Base.
Besides CoW Swap, another key product from Cow Protocol is MEV Blocker, developed jointly by CoW DAO and partners including Beaver Build and Agnostic Relay. By switching their wallet’s RPC to MEV Blocker, users route transactions through a private searcher network instead of Ethereum’s public mempool (visible to all searchers), preventing exposure to MEV attacks like sandwiching and frontrunning at the source.
*Standard transaction flow on Ethereum: After a user submits a transaction, it enters the public mempool; searchers monitor the mempool for MEV opportunities and bundle transactions; builders receive bundles from searchers and construct blocks; validators accept blocks from builders, verify them, and add them to the blockchain.
Revenue Model
Cow Protocol's revenue streams fall into two main categories:
1. Surplus sharing from CoW Swap transactions. Transaction surplus refers to the extra savings CoW Swap achieves for users beyond their initial quote via its competitive solver network. Currently, CoW Swap charges 50% of this surplus across most networks, capped at 1% of the traded volume. Additionally, for external protocols integrating Cow Protocol (partners), Cow takes a 15% service fee on partner-generated transaction fees (customizable but not exceeding 1% of volume). Finally, Cow Protocol levies a flat fee on overall network trading volumes on certain chains such as Gnosis and Arbitrum, currently set at 0.1% of volume (excluding special pairs like stablecoins).
2. Revenue from MEV Blocker, taking approximately 10% of the rewards validators earn through the system.
The majority of protocol income comes from surplus sharing on CoW Swap, so our subsequent analysis will focus primarily on CoW Swap’s business metrics.
Business Data
We will focus on two key business metrics: trading volume and protocol revenue.
Trading Volume
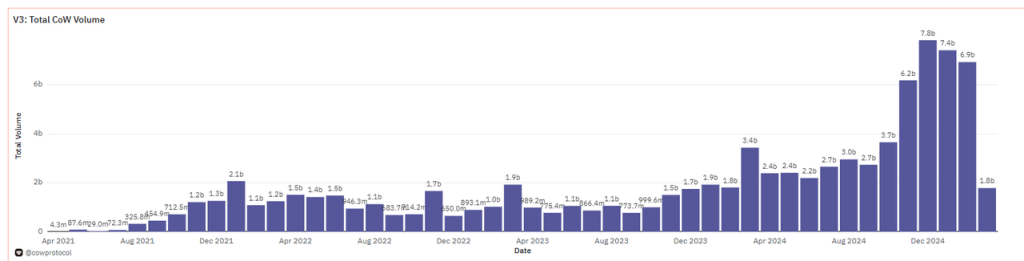
Data Source: Dune
As an emerging intent-based matching protocol, CoW Swap has experienced rapid growth over the past three years. In 2021, the protocol was in its infancy with minimal volume. From 2022–2023, driven by rising demand in DeFi for MEV protection and efficient trade aggregation, business metrics began improving. In 2024, trading volume surged further: monthly volume reached new highs, peaking near $7.8 billion in December 2024, and still maintaining nearly $6.9 billion in February 2025—far surpassing prior levels.
Notably, due to its ability to facilitate large-volume, low-slippage trades, CoW Swap is increasingly favored by DAOs and institutional players. In 2023, about one-third of DAO on-chain trading volume went through CoW Swap; by February 2025, this proportion had risen to 79.5%.
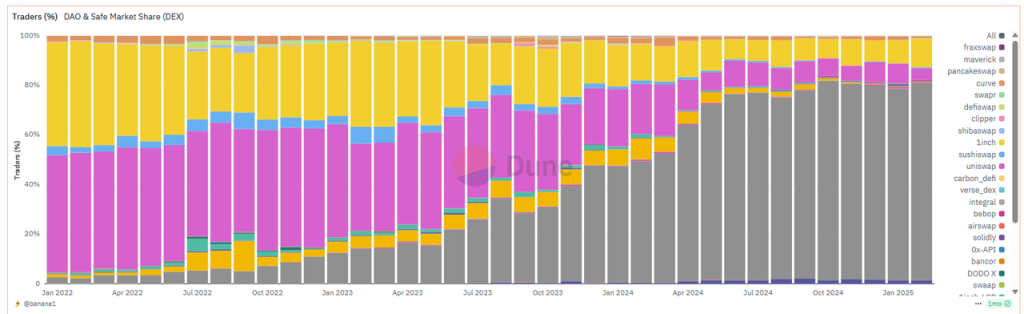
Data Source: Dune
Protocol Revenue
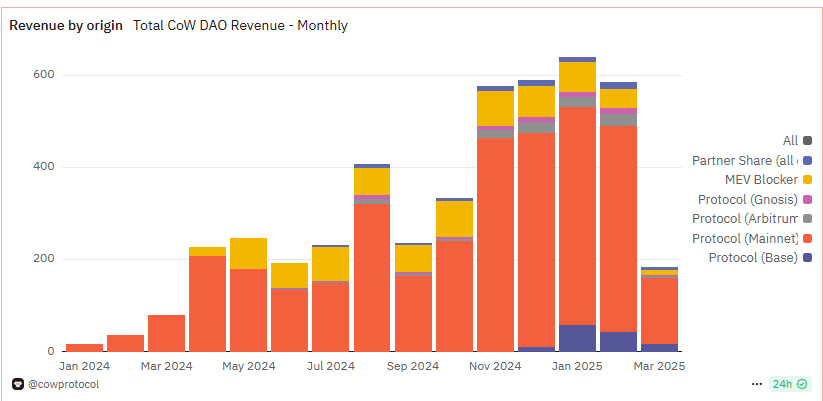
Data Source: Dune
Since early 2024, Cow Protocol has actively explored monetization, conducting multiple rounds of revenue tests, resulting in a steady month-on-month increase in income. January 2025 marked the highest revenue month (in ETH terms), generating 641 ETH. At an average ETH price of $3,328, this equates to ~$2.13 million. February revenue was 586 ETH, valued at ~$1.56 million using an average ETH price of $2,668.
Protocol Incentives
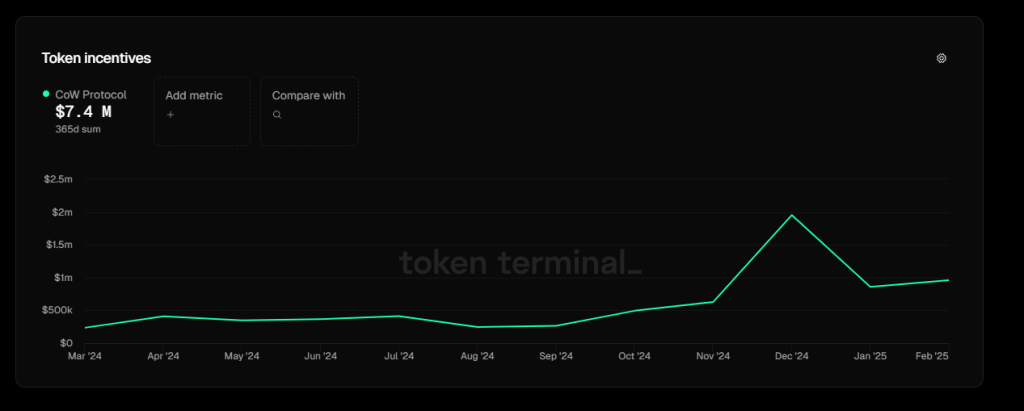
Data Source: Tokenterminal
The primary current expense for Cow Protocol is token incentives paid to solvers on the Cow Protocol network. Solvers receive $COW tokens based on the quality of their proposed trade solutions (measured by surplus delivered to traders). According to Tokenterminal, total $COW reward payouts over the past year amounted to approximately $7.4 million. In January and February 2025, incentive spending was $858k and $961k respectively, lower than the protocol’s monthly revenues of $2.13M and $1.56M during those months.
According to Cow Protocol’s official 2024 financial disclosure in January 2025, solver token rewards totaled ~$5.2 million for the year, while total protocol revenue was ~$6 million—marking the first time revenue exceeded token incentive expenditure, excluding development costs.
Competitive Landscape
Cow Protocol competes in the decentralized trade aggregation space. Historically dominated by 1inch, the landscape has diversified in recent years. According to The Block’s latest data from March 2025 (excluding UniswapX), 1inch has fallen from first place (partly due to a security incident affecting its Fusion feature in early March, causing over $5M in losses and raising user concerns), capturing only 22.8% market share—second to CoW Swap’s 33.85%, which claimed the top spot for the first time on a monthly basis.
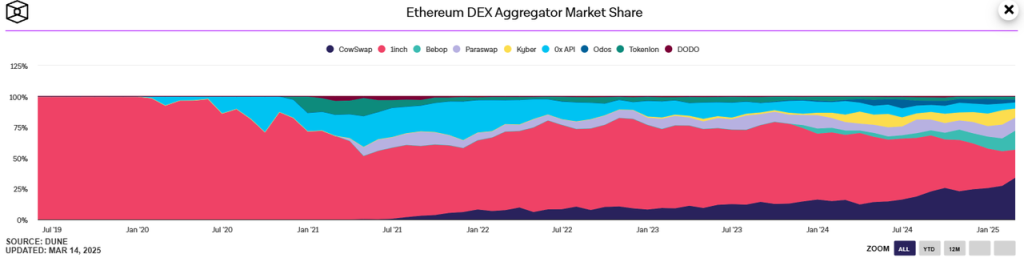
Data Source: The Block
Besides 1inch and CoW Swap, other top-five aggregators include ParaSwap, 0xAPI/Matcha (the aggregation interface provided by the 0x protocol), KyberSwap, and Bebop. Each holds around 10% or less market share. ParaSwap and 0x have longer histories and stable user bases, while KyberSwap (Kyber Network’s pivot to aggregation) and Bebop (launched by Wintermute) have recently gained incremental users. Overall, competition remains intense with continuous new entrants. While CoW Protocol has become the new leader in this space, its position is not yet solidified.
Beyond traditional aggregators, two notable emerging competitors are UniswapX by Uniswap and UniversalX by Particle Network.
UniswapX
UniswapX is a cross-platform aggregation feature launched by Uniswap in late 2023. It provides a similar intent-based order + filler model: users submit offline-signed orders via the Uniswap frontend, and third-party “fillers” (analogous to Cow Protocol’s solvers) execute these trades on-chain. The process grants fillers exclusive execution rights for a short period; if the trade isn’t filled, it moves to a Dutch auction phase where multiple fillers can bid. Like CoW Swap’s solver competition, this is an off-chain matching, on-chain settlement model. Leveraging Uniswap’s brand strength and vast user base, UniswapX was quickly integrated into its frontend and deployed on Ethereum. Notably, some in the industry have accused UniswapX of copying CoW Swap’s intent-based matching model. Voices including Curve’s team pointed out that CoW Swap pioneered the solver model, and UniswapX was not the first mover. Despite controversy, UniswapX capitalized on Uniswap’s ecosystem advantage to gain significant volume quickly—by early 2024, it captured over 10% of EVM-based aggregated trading volume (compared to CoW Swap’s ~14%). However, its market share gradually declined afterward. As per Cow Protocol’s March 2025 data, UniswapX now holds about 5.5% share in the aggregation market.
UniversalX
UniversalX is another high-profile project focused on cross-chain aggregation. Launched by Particle Network and live on mainnet since late 2024, its goal is to enable asset trading across any chain without relying on bridges. Its core idea is “chain abstraction”: users deposit assets from multiple chains into a unified on-chain account, then use a single balance to buy/sell tokens across different chains, with UniversalX handling automatic cross-chain swaps and settlements behind the scenes. As a new entrant in the aggregation space, UniversalX targets the niche of cross-chain trading, differentiating itself from single-chain-focused players like CoW Swap. However, as multi-chain ecosystems grow, future competition between UniversalX and CoW Protocol may emerge—especially if Cow expands to more chains or adds cross-chain functionality, entering UniversalX’s domain.
Cow Protocol’s Competitive Advantages
Facing fierce competition, Cow Protocol’s rise and steady growth stem from advantages in both product design and branding:
1. Product
-
Technical and Mechanistic Edge: CoW Swap was the first protocol to apply batch auction matching and solver competition to DEX aggregation, giving it first-mover advantage. Its unique Coincidence of Wants direct matching allows trades without traditional liquidity pools, reducing reliance on AMMs and minimizing slippage and fees. The uniform clearing price prevents price exploitation due to execution order, enabling fair pricing especially beneficial for heavy traders and institutions. Later entrants like UniswapX and 1inch Fusion adopted similar ideas but differ in implementation. For example, CoW Swap uses sealed-bid, per-block auctions where all solutions are submitted simultaneously and the best one executed—this maximally compresses MEV opportunities. This mechanism is considered more effective than UniswapX’s time-limited exclusive filling and Dutch auction in preventing frontrunning and unfair behavior.
-
MEV Protection and Security: Cow Protocol’s dual-product structure—trade services plus MEV Blocker—enhances resistance to MEV attacks. By routing user transactions away from Ethereum’s public mempool and batching them via trusted solvers onto Ethereum, it effectively reduces risks of frontrunning and sandwich attacks. Moreover, the protocol imposes strict limits on solver quote slippage and execution outcomes, further constraining miners’ and searchers’ ability to extract MEV. These measures make CoW Swap one of today’s most user-protective trading platforms. Such MEV protection is particularly appealing to large traders and DAO treasury managers.
2. Brand
-
As the first trading product to introduce batch auction matching and solver competition, combined with its anti-MEV features, Cow Protocol has established a strong reputation centered on security and cost savings for traders. This value proposition has taken root in users’ minds, making it the default choice for large-volume traders—a habit unlikely to change easily. This user loyalty reflects brand equity built through product excellence, ultimately serving as the foundation for the protocol’s path to profitability.
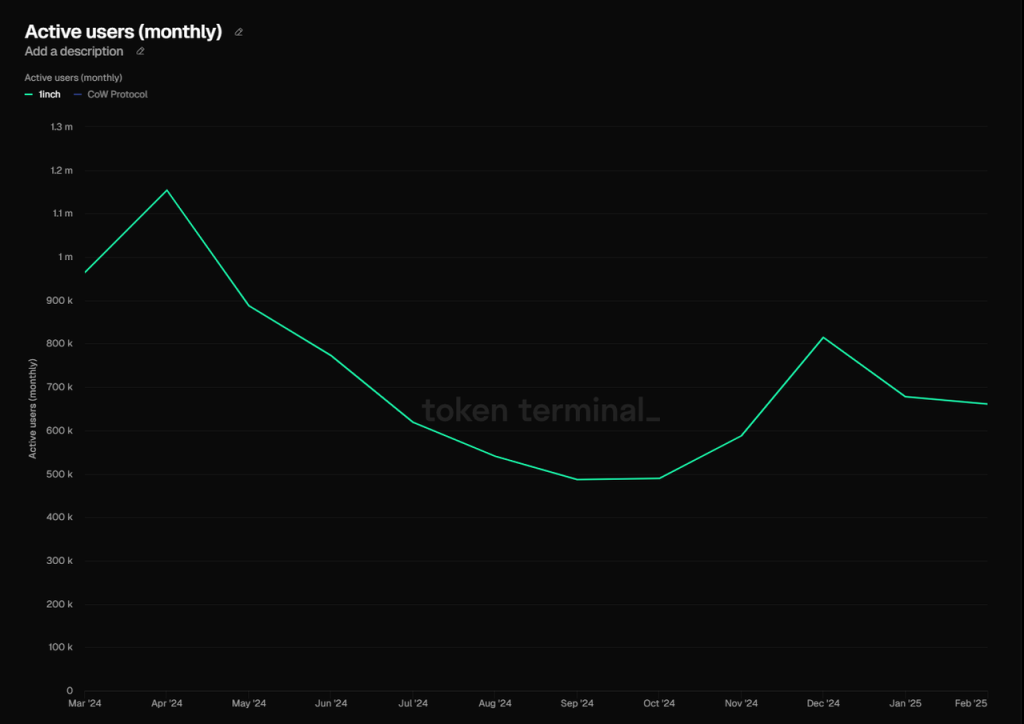
1inch Monthly Active Users Over Past Year – Data Source: Tokenterminal
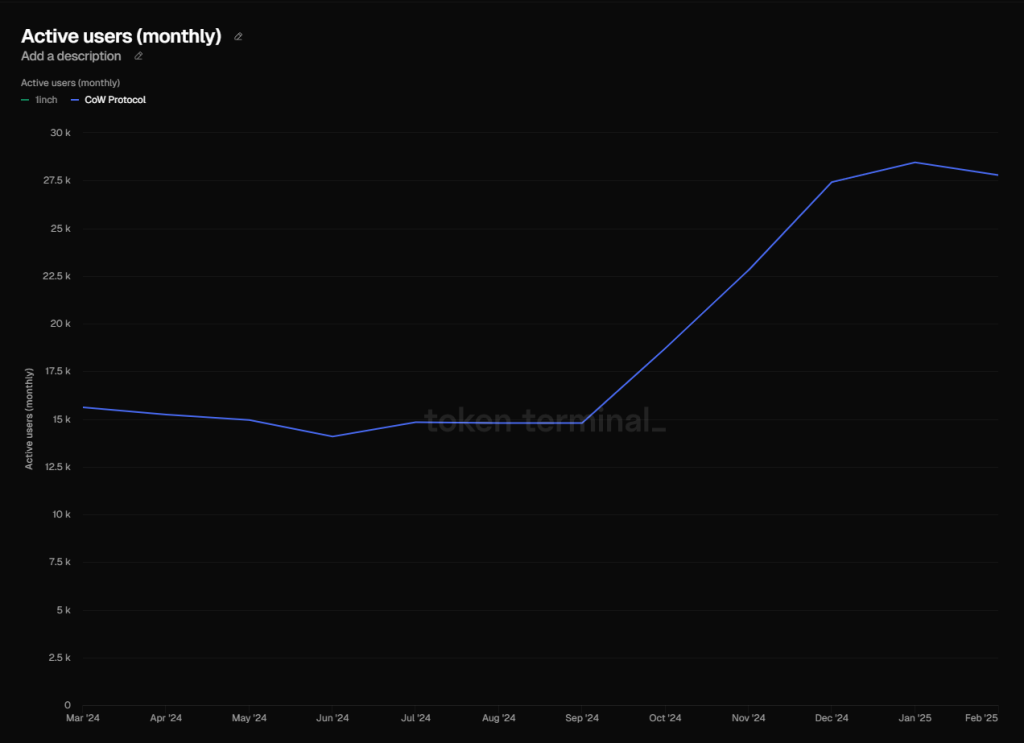
Cow Protocol Monthly Active Users Over Past Year – Data Source: Tokenterminal
Key Challenges and Risks
Intense Competition
The trade aggregation space is fiercely competitive, with established players like 1inch, Kyber, and DoDo on one side, and emerging forces like Bebop backed by Wintermute on the other. Meanwhile, closer-to-user products such as CEXs and wallets—with superior access points and front-end advantages—and innovative concepts like UniversalX’s chain abstraction continue pushing product innovation and increasing user penetration. Long-term, their relationship with Cow Protocol is more competitive than cooperative. Although Cow Protocol has overtaken 1inch in market share, maintaining this lead under sustained pressure will be difficult. Intense competition also constrains the protocol’s bargaining power with users and suppliers (solvers), creating a clear tension between pursuing “market share” and maximizing “protocol profit.”
Market Cycle Sensitivity
A broader market downturn naturally leads to reduced trading activity, negatively impacting CoW Swap’s volume. This applies equally to other trading products and won’t be discussed further.
Dependence on EVM Ecosystem
Cow Protocol currently operates exclusively within the Ethereum ecosystem. If Ethereum lags behind other public chains in development, Cow Protocol’s growth potential could be constrained. Uniswap faces a similar risk, which we’ll revisit later.
Valuation Reference
$COW Token
The total supply of $COW is 1 billion. According to Coingecko, the current circulating ratio is approximately 41.5%, with a projected 19.61% inflation rate in token circulation over the next year.
Currently, $COW is primarily used for governance. As protocol revenue grows, token buybacks may be implemented. Previously, there were experiments allowing $COW staking to reduce trading fees.
Valuation
From a vertical (historical) valuation perspective, Cow’s FDV has reached a new high in this cycle (excluding anomalous values from the first month post-launch when circulation was extremely low), peaking at $990 million in late December last year before sharply correcting to ~$280 million today.
We assess Cow’s PS ratio by comparing FDV to protocol revenue:
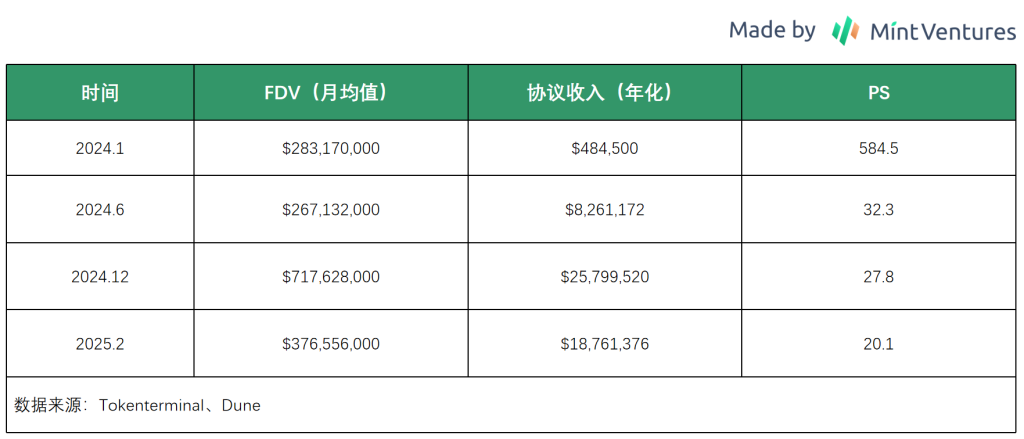
The chart shows that despite Cow’s FDV trending upward over the past year, its PS ratio has clearly declined due to rising revenue, indicating improved relative value compared to history.
From a horizontal (peer comparison) standpoint, among comparable aggregators, 1inch is the most direct benchmark. However, since 1INCH lacks direct value capture mechanisms and has no consistent, publicly reported protocol revenue, we compare the two protocols using FDV-to-volume ratios.
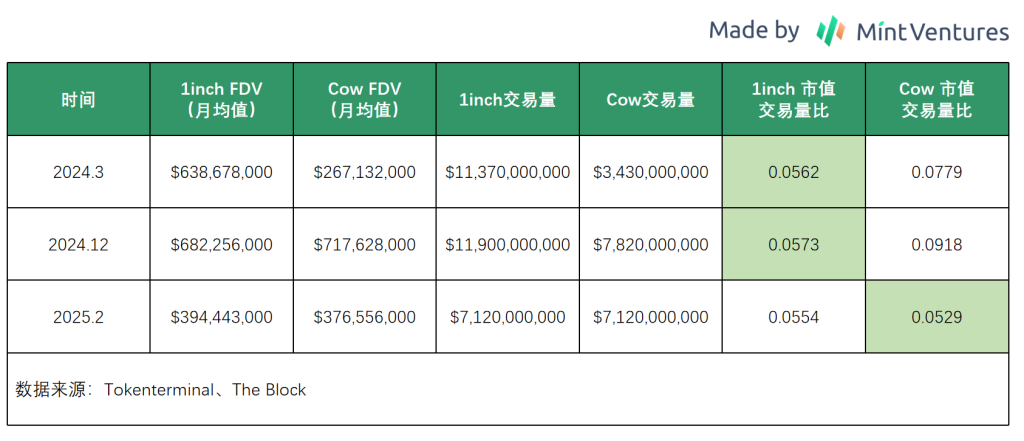
The chart reveals that starting in February 2025, Cow’s market cap-to-volume ratio dropped below 1inch’s for the first time, indicating better relative value on a cross-sectional basis.
3.2 Uniswap
Business Overview
Core Products
Uniswap is the largest decentralized exchange (DEX) on Ethereum. Its main products include the DEX protocol (deployed on Ethereum and multiple L2 chains) and the newly launched Unichain—a dedicated Layer 2 network.
The fee switch for the Uniswap protocol remains inactive, meaning the protocol itself generates no direct revenue (though Uniswap Labs charges a 0.15% interface fee on certain trades via its official frontend).
However, Unichain, announced in November 2024, will distribute value to UNI holders by sharing transaction sequencer fees earned through staking UNI—achieving value accrual without activating the fee switch.
Business Metrics
For Uniswap, the most important metrics are trading volume and fees; for Unichain, we focus on active addresses, key ecosystem developments, and total funds locked.
DEX Volume and Fees
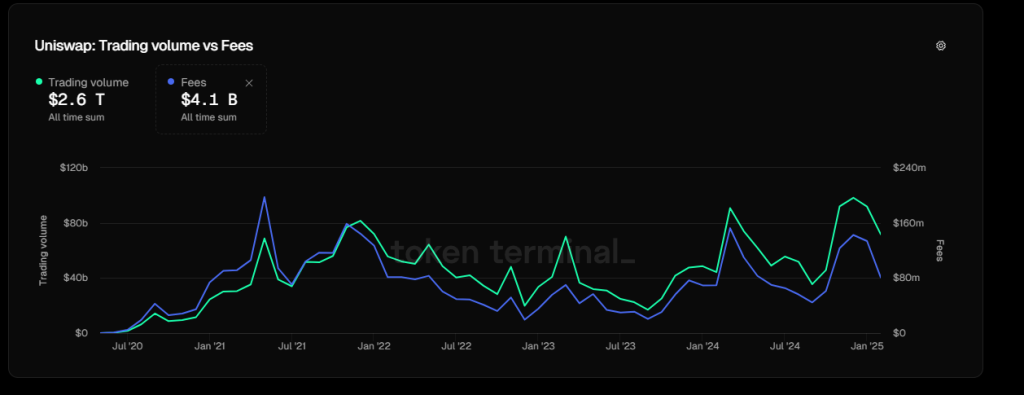
Uniswap Volume and Fees – Source: Tokenterminal
Overall, Uniswap’s trading volume continues to grow with the market, setting new monthly records in March and December of the past year. However, recent cooling market conditions have led to a noticeable decline in volume.
Notably, Uniswap’s fee metric this cycle hasn’t surpassed previous peaks, suggesting declining fee rates over time and intensifying competition among liquidity providers (LPs).
Multi-Chain Data
Thanks to multi-chain deployment (currently spanning 11 EVM chains), particularly Coinbase’s Base, Uniswap hit a record 19 million active users in October last year. This growth far outpaces transaction volume increases, highlighting L2s’ effectiveness in onboarding new users.
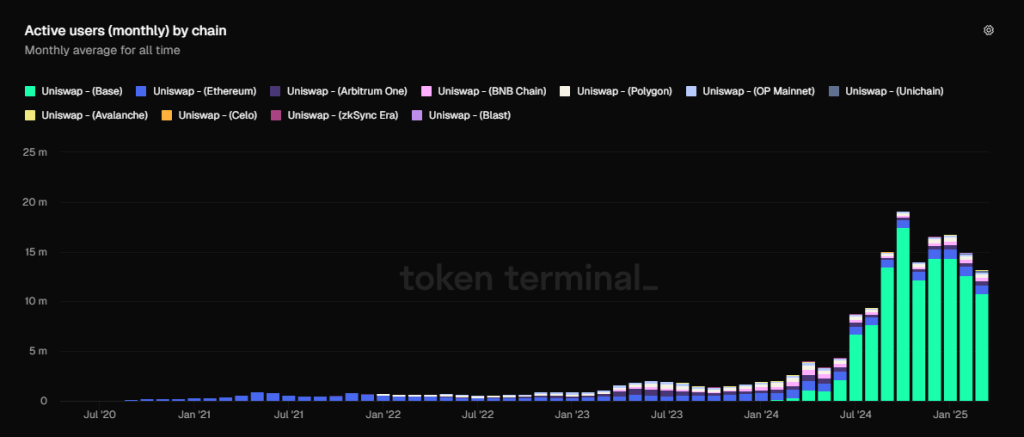
Uniswap Monthly Active Addresses by Chain – Source: Tokenterminal
Base dominates active users, accounting for 82% of Uniswap’s total across all chains.
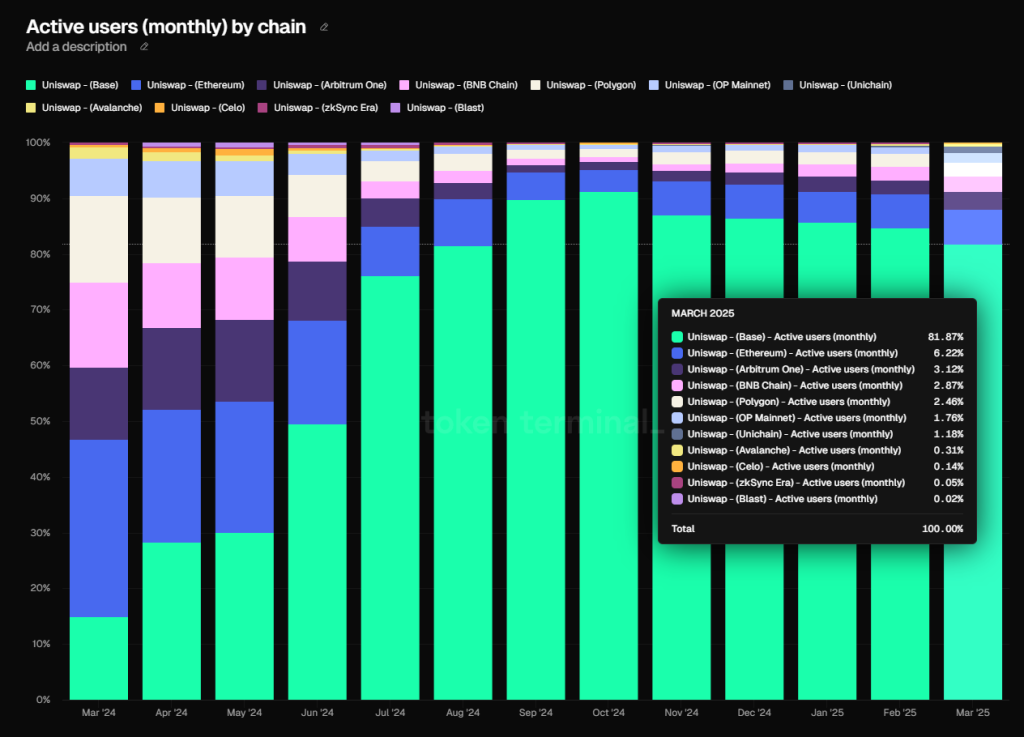
Source: Tokenterminal
In terms of trading volume, however, Ethereum remains Uniswap’s primary battlefield, contributing ~62% of volume, followed by Arbitrum at 23%, and Base at 8.4%.
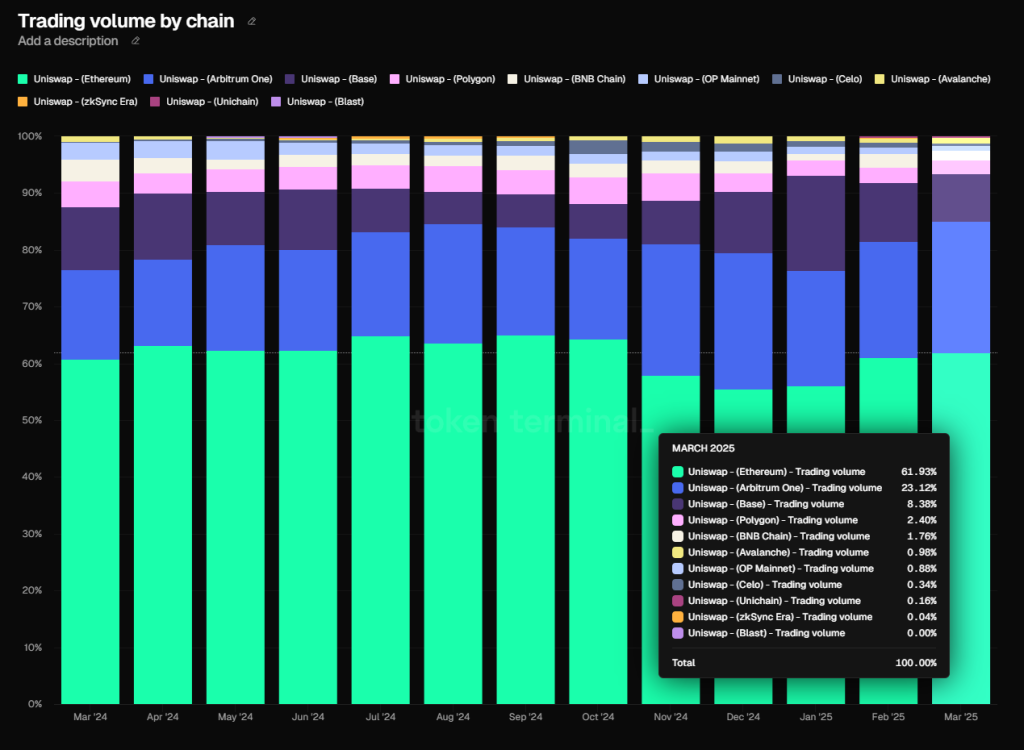
Source: Tokenterminal
Unichain Business Metrics
Since launching in early February, Unichain has grown rapidly. By early March, weekly active addresses approached 120,000, ranking 7th among all L2s—outperforming well-known projects like zkSync, Manta, and Scroll.
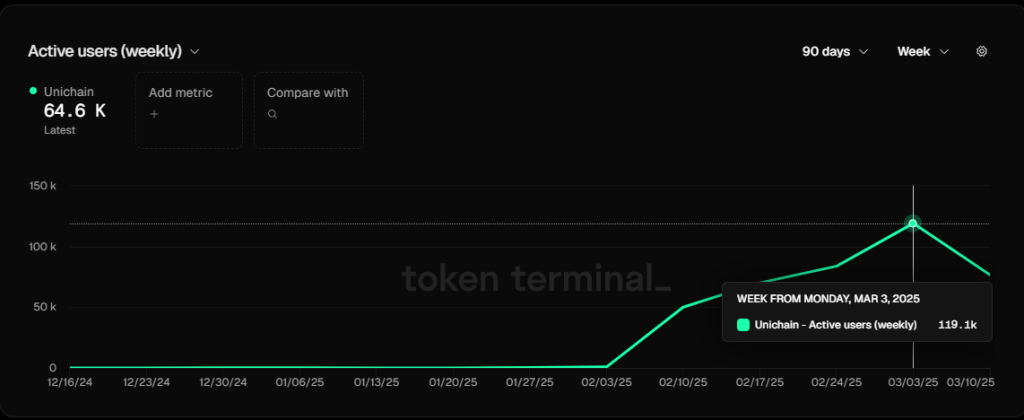
Source: Tokenterminal
However, bridged asset value remains low at around $14 million.
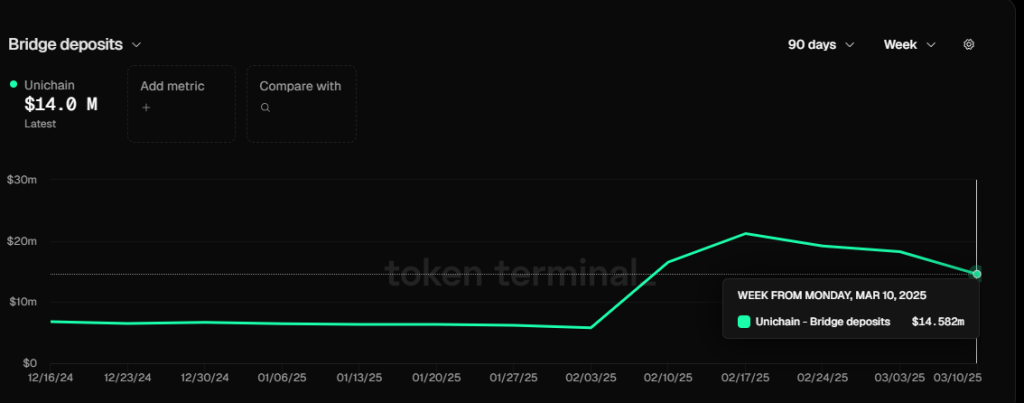
Source: Tokenterminal
Ecosystem-wise, over 80 projects are listed in Unichain’s official ecosystem, though most remain unaudited or unlaunched. In DeFi, besides Uniswap itself, only Venus is live (with $5.67M in total deposits).
Competitive Landscape
Over the past year, Uniswap has maintained its leadership in the EVM DEX market, holding the top spot in overall market share—although the trend shows gradual erosion. The chart below illustrates market share trends across all EVM L1s and L2s.
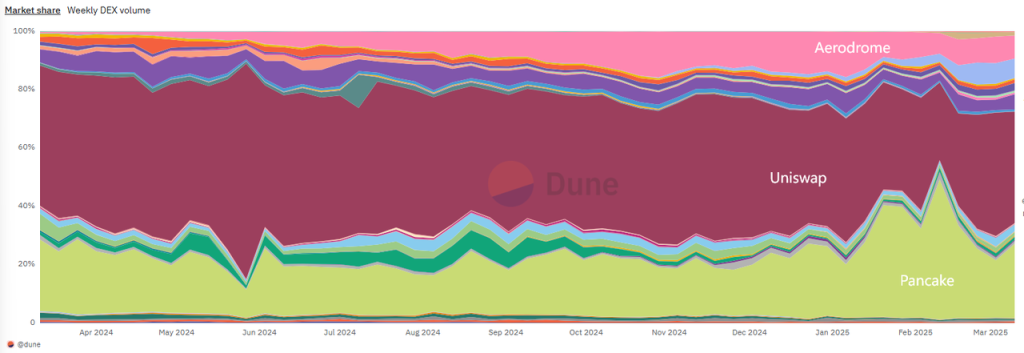
Source: Dune
PancakeSwap ranks second, followed by Aerodrome—leading DEXs on BNB Chain and Base, respectively—even though Uniswap is also deployed on both chains.
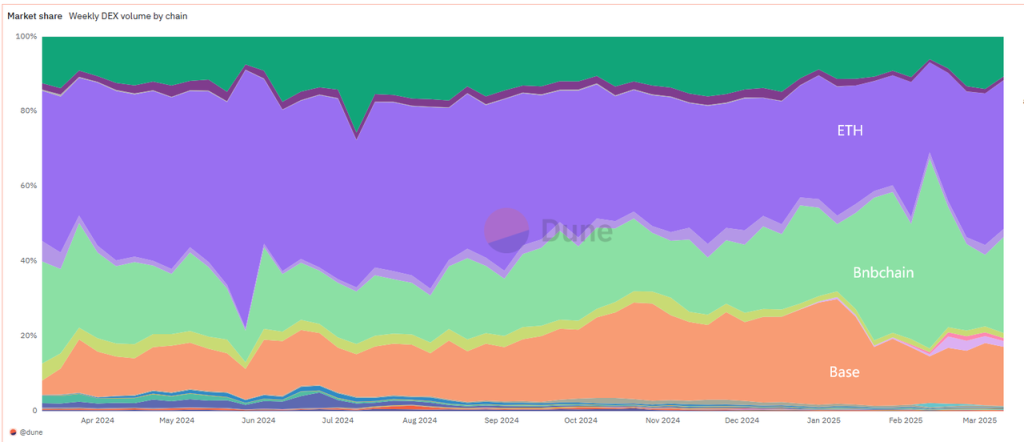
Source: Dune
Ethereum, BNB Chain, and Base are also the three EVM chains with the highest trading volumes, aligning with the market rankings of Uniswap, PancakeSwap, and Aerodrome.
Regarding Unichain, due to its short launch timeline, the ecosystem remains nascent, currently in the cold-start phase for apps and capital. Aside from promising user growth, other metrics lag significantly behind major L2s.
Uniswap’s Competitive Advantages
Uniswap’s strengths can be summarized as follows:
1. Network Effects and Liquidity Depth
The largest liquidity pools attract the most traders, which in turn draws more tokens to deploy liquidity—creating a self-reinforcing flywheel effect.
2. Brand Loyalty and User Habit Stickiness
As the pioneer in popularizing the AMM model in DeFi, Uniswap enjoys unmatched brand recognition and legitimacy. It occupies a dominant mental share among both traders and liquidity providers. Even in today’s crowded DEX and aggregator landscape, many users instinctively trade on Uniswap’s frontend—even though it charges an additional interface fee. This brand strength also played a crucial role in launching Unichain, attracting high-quality projects early and enabling rapid user growth.
3. Strategic Multi-Chain Positioning
Uniswap has deployed its products across most major EVM chains and consistently ranks among the top three in trading volume on each. This secures its foundational presence in the multi-chain era and lays the groundwork for future multi-chain aggregation capabilities, facilitating easier interoperability of liquidity across chains.
Main Challenges and Risks
Intense competition and disruption from new models
While Uniswap maintains a lead in market share, its dominance faces challenges: traditional rivals like Curve hold strong ground, while breakthroughs on other EVM L1s/L2s remain limited, with each chain hosting its own dominant local DEX (Pancake on BNB Chain, Aerodrome on Base, Camelot on Arbitrum). More importantly, emerging trading models pose growing threats: RFQ (Request-for-Quote) protocols and batch auction matching (e.g., CowSwap) allow market makers (solvers) to provide direct quotes, improving price efficiency for large trades, reducing AMM slippage and MEV. These models are increasingly popular among professional traders and whales, siphoning significant volume from Uniswap. Although Uniswap launched UniswapX with a similar mechanism, it hasn’t slowed CowSwap’s momentum. Furthermore, wallets and CEXs—products with inherent front-end advantages—are aggressively targeting the trading space, aiming to intercept user actions upstream, forcing Uniswap into a passive role as a mere “price taker” amid brutal quoting competition.
Inefficient Governance and Lack of Token Utility
Longtime observers of Uniswap’s governance forum often note its inefficiency compared to other well-governed, reputable DeFi projects like Aave. Issues include slow decision-making, resource misallocation, and lack of strategic focus. Specific examples: 1. The community’s most debated topic—the fee switch—has been discussed for nearly three years without resolution; 2. Funding is allocated to research and organizations with little connection to Uniswap’s north star metric (volume), yielding negligible benefits. Poor governance and indifference toward establishing meaningful value accrual for the UNI token likely exert long-term negative pressure on its price.
Valuation Reference
Since Uniswap does not yet generate formal protocol revenue, and Unichain’s fees are negligible relative to its market cap, we evaluate valuation using Uniswap’s market cap divided by fees (PF ratio), comparing both vertically and horizontally.
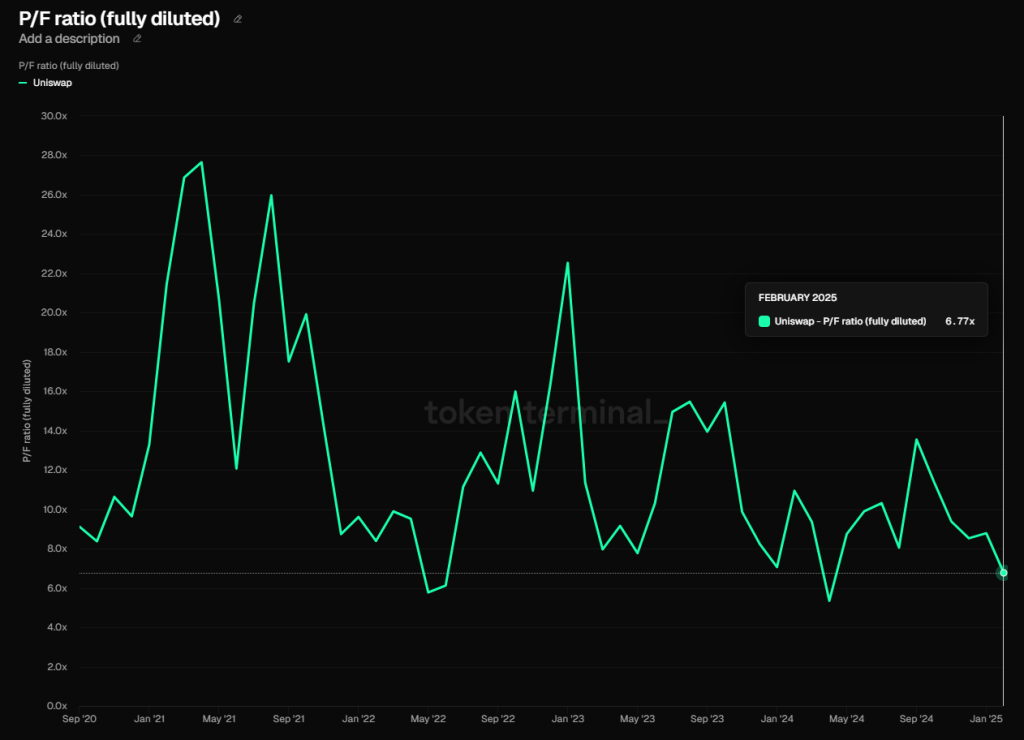
Source: Tokenterminal
Vertically, Uniswap’s PF ratio was 6.77 in February 2025—the absolute historical low. Since Uniswap’s token launch, only three months have seen lower readings: May–June 2022 (Three Arrows collapse) and April 2024 (major altcoin correction + SEC Wells Notice to Uniswap). In March, the ratio slightly rose to 7.26. This suggests extreme market pessimism regarding UNI’s prospects.
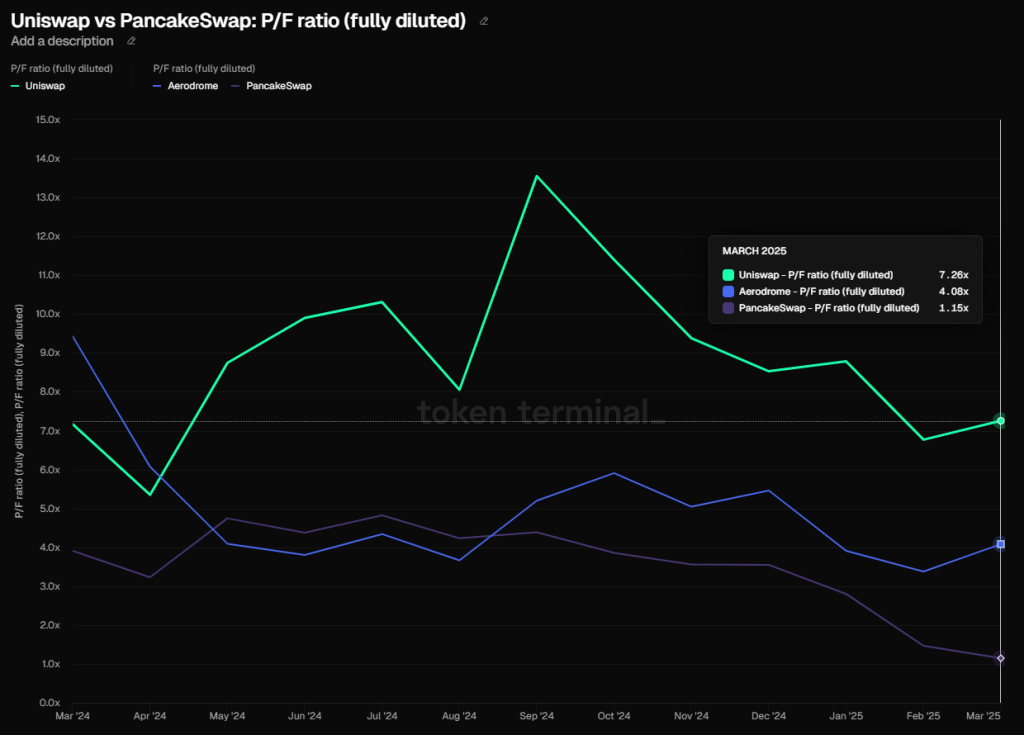
Source: Tokenterminal
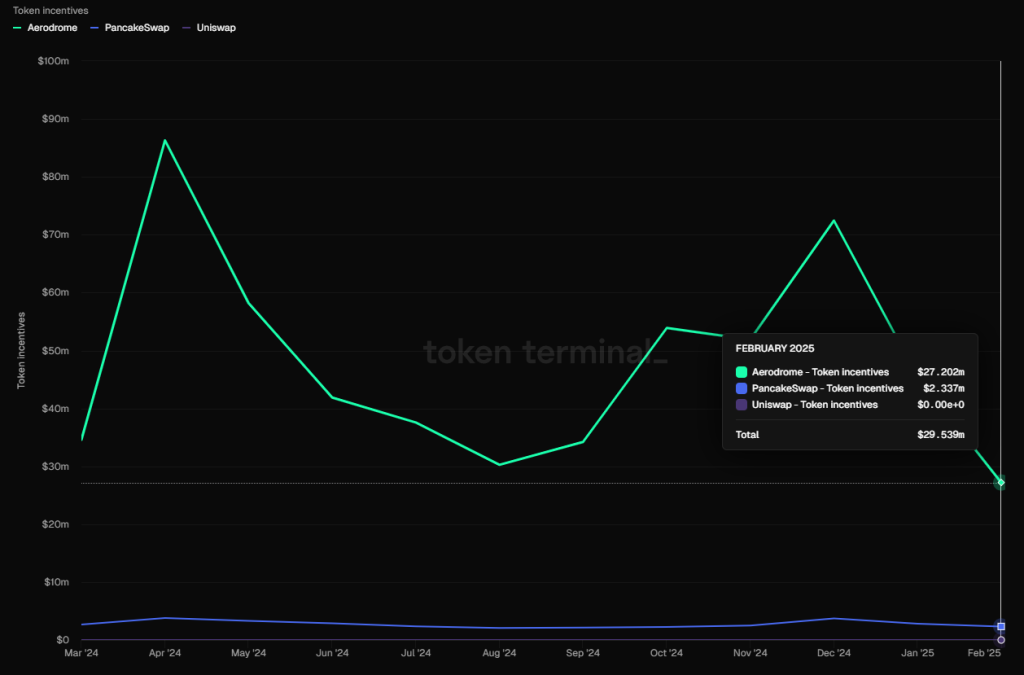
For horizontal comparison, we selected DEX peers with the next-highest market shares: PancakeSwap and Aerodrome. Curve was excluded due to its significant lending business, reducing comparability.
Based on PF ratios alone, Uniswap appears significantly more expensive than Pancake and Aerodrome. However, two critical factors must be considered:
-
Uniswap provides no token subsidies, whereas Pancake and Aerodrome continue substantial issuance—especially Aerodrome, which distributed $27 million in token incentives in February alone (see chart below)
-
Uniswap has Unichain as a second growth vector
-
Uniswap’s multi-chain ecosystem is more mature. While Pancake is deployed across multiple chains, its operational performance lags behind Uniswap’s. Aerodrome is a single-chain DEX.
Overall, even considering similarities between Uniswap, Pancake, and Aerodrome, the horizontal PF comparison is less informative than the vertical one.
3.3 Jupiter
Business Overview
Jupiter started as a trade aggregator and, through continuous product expansion and acquisitions, has evolved into a full-stack trading platform centered on Solana, while expanding horizontally into other chains and ecosystems. Key products within the Jupiter ecosystem include:
-
Core trading products: aggregation (Instant), market orders (Trigger), and recurring conditional orders (Recurring)—Jupiter’s earliest offerings and most widely used. On January 20, daily transaction count peaked at 57 million
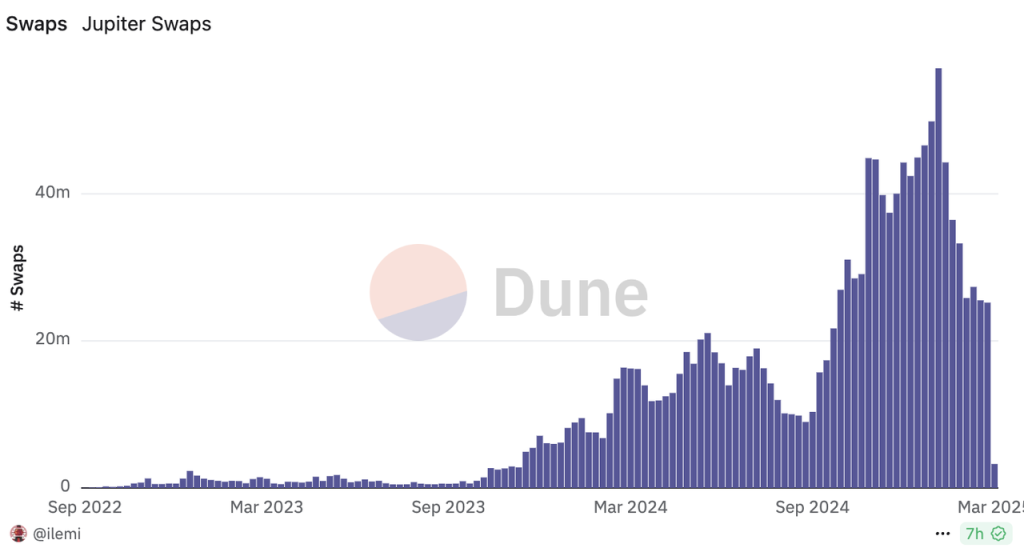
Source:Dune
-
Trenches (formerly Ape.pro): A specialized tool targeting meme trading, functionally similar to meme-focused tools like Photon/GMGN. However, after merging into Trenches at the end of February, its product form became largely indistinguishable from Jupiter’s core aggregation offering.
-
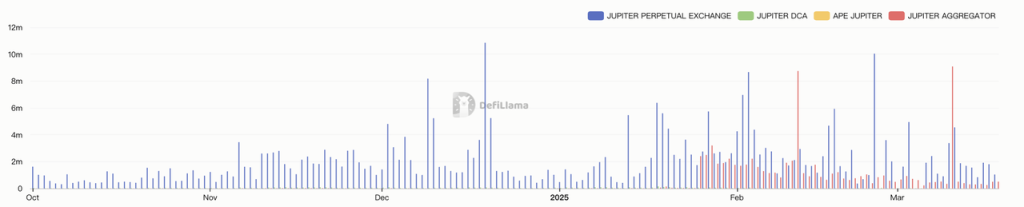
Perps: Functionally similar to GMX, offering leveraged long/short positions and yield farming on BTC, ETH, and SOL. TVL briefly exceeded $2 billion, constituting the bulk of Jupiter’s TVL. Peak daily volume neared $1 billion, serving as Jupiter’s primary cash flow engine in early stages.
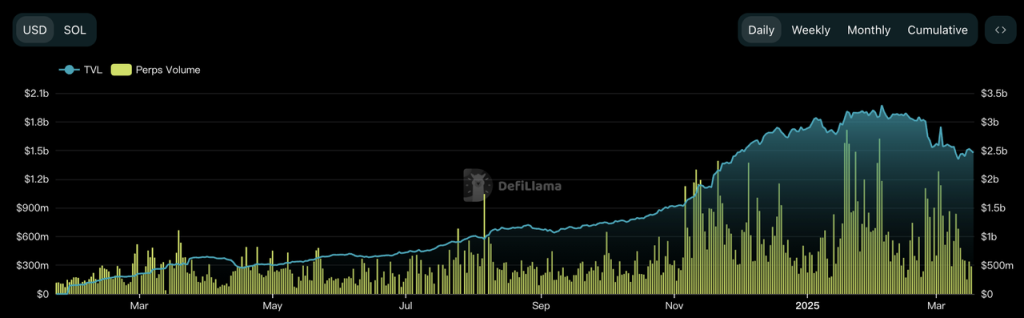
TVL (left axis) and Volume (right axis) of Jupiter Perpetual Exchange – Source:DeFillama
These represent Jupiter’s main products. Additional offerings include:
-
Meme trading platform Moonshot. In January 2025, Jupiter acquired majority control of Moonshot, a fast-rising meme trading platform. Moonshot attracted users with seamless fiat onboarding and smooth trading flows, creating a “Moonshot listing effect,” most notably during TRUMP’s launch.

Moonshot Volume (left) and Fees (right) – Source:Dune
-
Liquidity platform Meteora, founded by Ben Chow, an early Jupiter co-founder. Though not under explicit control, it's considered part of the Jupiter ecosystem. Meteora plans to issue its own token, meaning its relationship to $JUP will be indirect.
-
jupSOL, a liquid staking token (LST). Launched in 2024, jupSOL quickly captured meaningful market share, now ranking fourth behind jitoSOL, bnSOL, and mSOL.
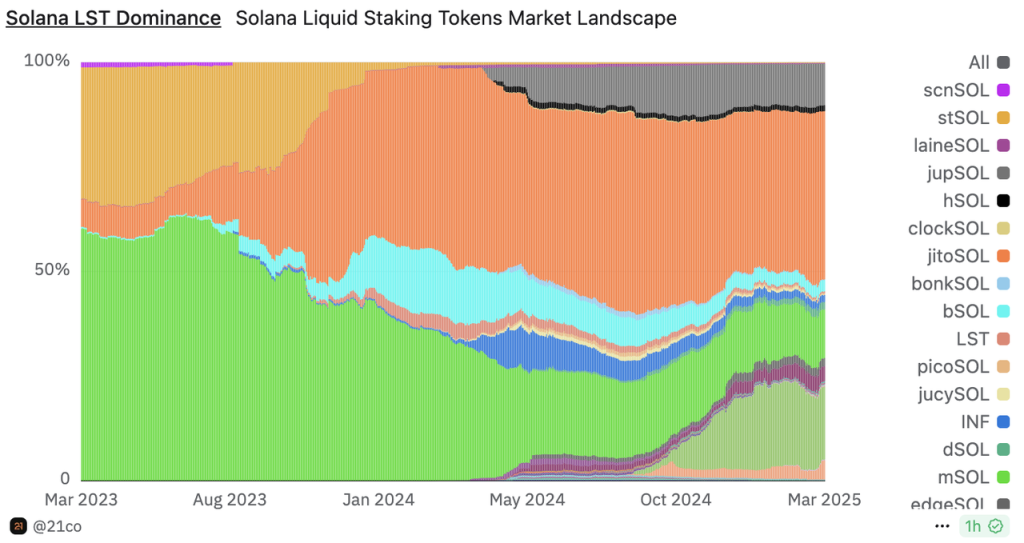
Solana LST Market Share (gray block above is jupSOL) – Source Dune
-
Launchpad LFG: Besides $JUP, LFG launched governance tokens for Zeus (cross-chain comms, ZEUS), Sanctum (LST protocol, CLOUD), debridge (cross-chain, DBR), and several meme projects. Few in number but relatively high in quality.
-
Portfolio management platform Jupiter Portfolio: Announced acquisition of Sonarwatch, an on-chain portfolio tracker, in January, with Jupiter Portfolio officially launching on January 30.
-
Mobile wallet Jupiter Mobile: Launched after acquiring Ultimate Wallet, a Solana mobile wallet.
-
Omni-chain network Jupnet: Launched end of January, aiming to enable access to all chains, currencies, and goods through a single account. No consumer-facing version available yet.
-
Trading terminal Coinhall: Acquired in September 2024, focusing on Cosmos ecosystem token trading. This acquisition gave Jupiter in-house trading terminal development capability, which was leveraged to build Trenches. Cosmos chain trading remains infrequent, averaging under $10M daily volume.
Source: Coinhall Official Website
-
Beyond consumer-facing products, Jupiter has made other moves, such as acquiring Solana browser SolanaFM. Several products, including Jupnet, are still in development.
In terms of product scope, Jupiter—as Solana’s largest consumer traffic gateway—covers nearly every direction except lending. Even within Solana’s already broad “conglomerate-style” landscape, Jupiter’s reach is unparalleled. Beyond organic growth, it aggressively expands boundaries through strategic acquisitions.
Revenue Model
Current revenue-generating services at Jupiter include:
-
Aggregation trading (including Trenches): 0.05%–0.1% fee; market orders and DCA: 0.1%
-
Derivatives trading: Follows GMX-like mechanics, charging 0.06% on opening/closing positions, plus borrowing fees and price impact fees. However, derivative revenue doesn't fully go to JupiterDAO—75% goes to liquidity providers (JLP), and only 25% is retained by JupiterDAO.
All other services are currently free.
Token Incentives
Jupiter has no ongoing token incentive program. Its primary incentives came from two retroactive airdrops.
Competitive Landscape
Trading is Jupiter’s core service. Other businesses—like LST, Launchpad, wallets—are essentially monetizing traffic generated by trading. Thus, we focus our competitive analysis on Jupiter’s position in aggregation and derivatives trading.
Aggregation Trading
In the Solana trading gateway race, Jupiter leveraged its multi-pool routing and superior UX to surpass Orca and Raydium in H1 2024, achieving dominant market share (51% of Solana trading sources in Q2 2024, source: Messari).
However, with the explosion of memes and Pump.fun, specialized meme trading tools like Photon, Trojan, Bullx, and GMGN rapidly captured share at the entry level. Promoting faster speeds and comprehensive meme-trading utilities, they’ve become the preferred “meme gateways,” diluting Jupiter’s dominance. Jupiter launched ape.pro in October last year as a response, but it received lukewarm reception and was eventually merged into Trenches. Data reflects this: Jupiter’s share of Solana trading sources dropped to 38% in Q4 2024 (source: Messari).
During meme booms, meme trades accounted for up to 90% of Solana’s network volume. Losing share in this segment represents Jupiter’s biggest challenge in aggregation.
Derivatives Trading
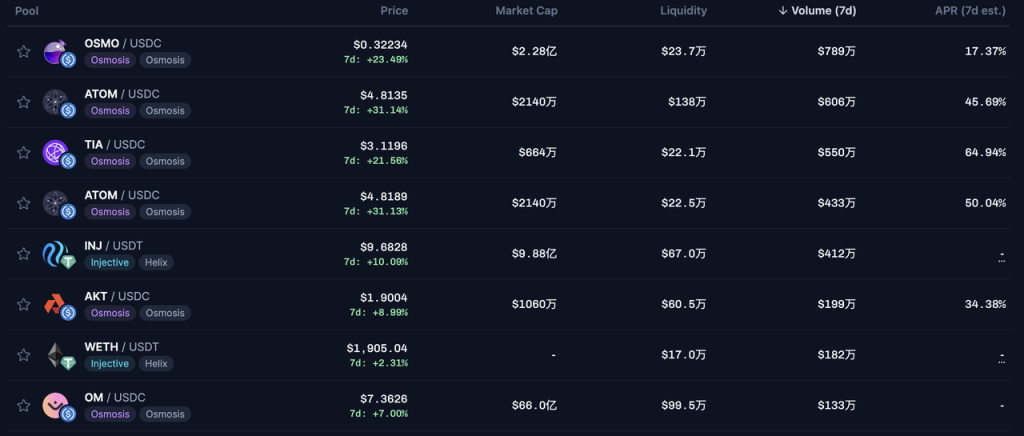
Jupiter’s perpetual exchange is currently the second-largest on-chain derivatives platform, trailing only Hyperliquid (to be covered in the next article). On Solana specifically, Jupiter holds a clear edge over its main competitor Drift, with recent trading volume ranging between 5x and 10x higher.
7-Day Derivative Exchange Volume Ranking – Source: DeFillama
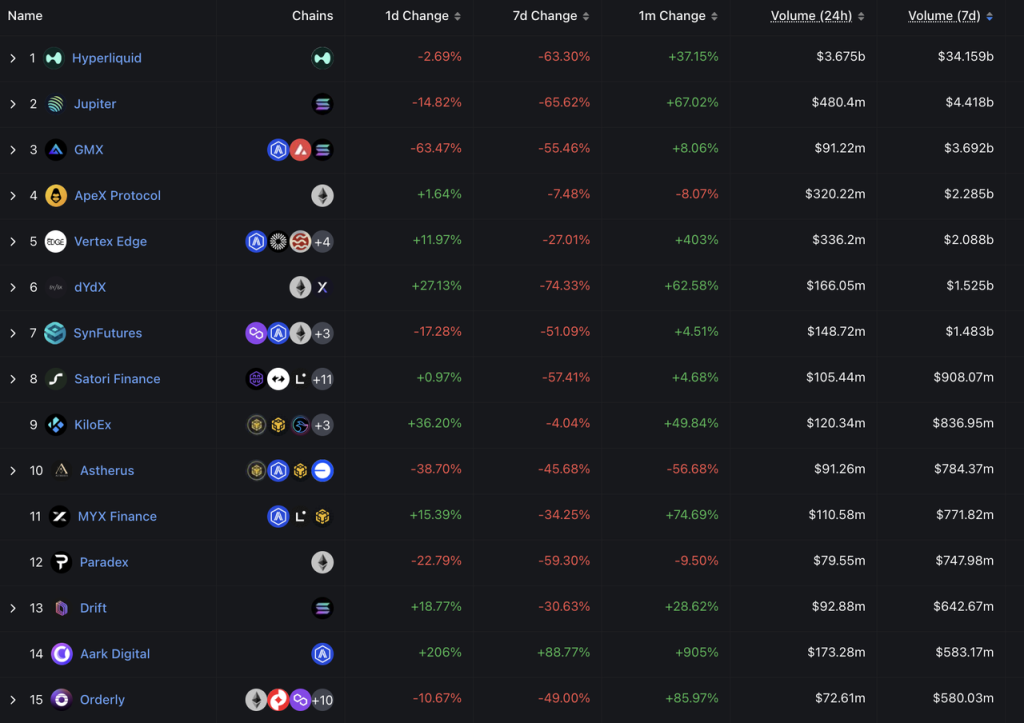
In DAU terms, the gap over the past month is similarly an order of magnitude apart.
Data Source: Dune
In the derivatives space, Jupiter’s leadership on Solana appears unshakable in the short term.
Main Challenges and Risks
Despite launching Jupnet to expand into omnichain services, Jupiter’s core operations remain heavily concentrated on Solana. The biggest uncertainty for Jupiter lies in whether the Solana network can sustain its vibrancy and maintain active on-chain trading.
Beyond the previously mentioned struggle in meme gateway competition, Jupiter faces additional challenges:
Overly Aggressive Expansion with Uncertain Outcomes
Jupiter’s expansion pace is far more aggressive than most Web3 projects. With grand ambitions, it has frequently pursued acquisitions over the past year to extend its footprint. Yet, many acquisitions have underdelivered, including Moonshot and Coinhall.
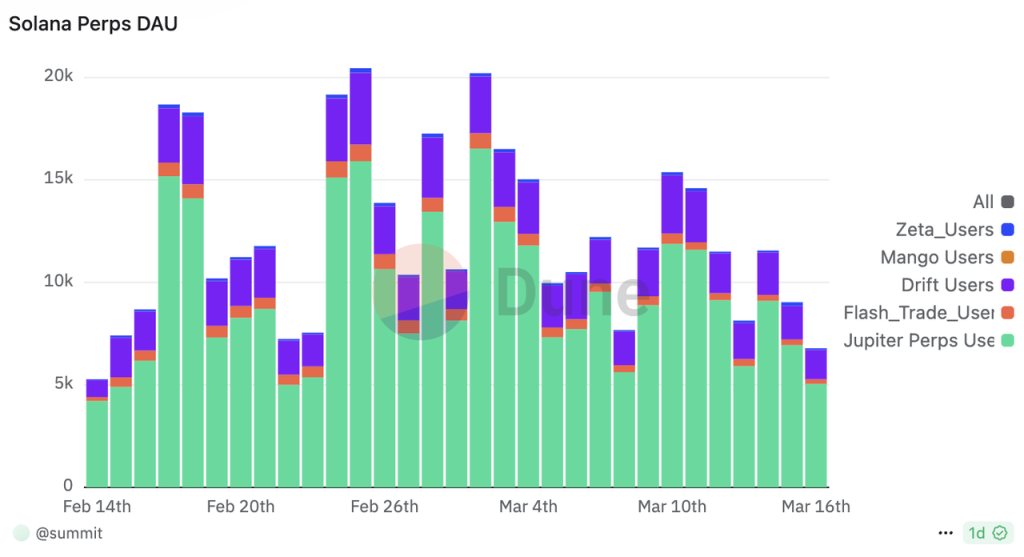
Compared to its peak—$660M daily volume and millions in revenue in January—Moonshot’s current daily volume has plummeted to under $5M, with revenue below $10K. While Jupiter hasn’t disclosed acquisition terms, buying Moonshot today would clearly cost much less. From a $JUP holder’s perspective, the timing appears suboptimal.
Moonshot Volume (left) and Fees (right) – Source: Dune
The Coinhall acquisition enabled Trenches’ development, but in practice, Trenches lags far behind leading meme trading tools like Photon, Bullx, Trojan, and GMGN in both volume and visibility.
No Self-Built Liquidity Pool
Jupiter lacks its own liquidity pool. Meteora, which supports Jupiter, has initiated an emissions program and is expected to launch its own token—meaning JupiterDAO (or $JUP) cannot capture transaction fees from “trading within liquidity pools.” This fee stream supported Raydium’s $22+ million revenue in January alone.
Untested Through Bear Markets
Bear markets often dismantle bull-market assumptions. Currently, Solana’s meme traders show strong willingness to pay, showing little sensitivity to Jupiter’s 0.05% aggregation fee—especially given competitors charge 0.5% to 1%. But in a bear market, as trading enthusiasm wanes, users may become more fee-sensitive, potentially forcing Jupiter into conflict between “market share” and “net profit” goals.
Moreover, Jupiter’s current lineup includes non-revenue-generating products like wallets, Jupnet, and Jupiter Portfolio—whose viability during prolonged bear markets remains questionable.
Valuation Reference
$JUP has a total supply of 10 billion. In late January, 3 billion tokens were voted for burning, leaving a max circulating supply of 7 billion. Current circulation is 2.63 billion, representing a 38.5% circulation rate. Of the remaining unissued tokens, 810 million team tokens will begin unlocking over the next 21 months, and 700 million will be released in next January’s Jupiter airdrop. Projected inflation exceeds 40% over the next year, classifying $JUP as a low-circulation, high-inflation token.
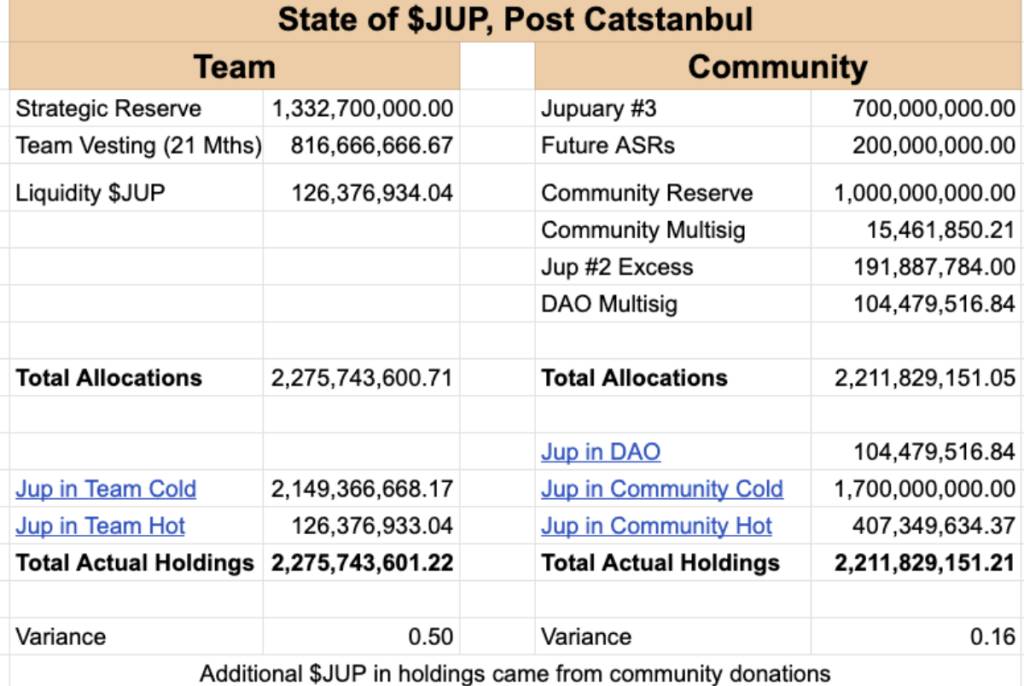
Current $JUP Token Distribution – Source:Jupiter Governance Forum
At the end of January, Jupiter announced that 50% of protocol revenue will be used to buy back $JUP, with repurchased tokens locked for three years.
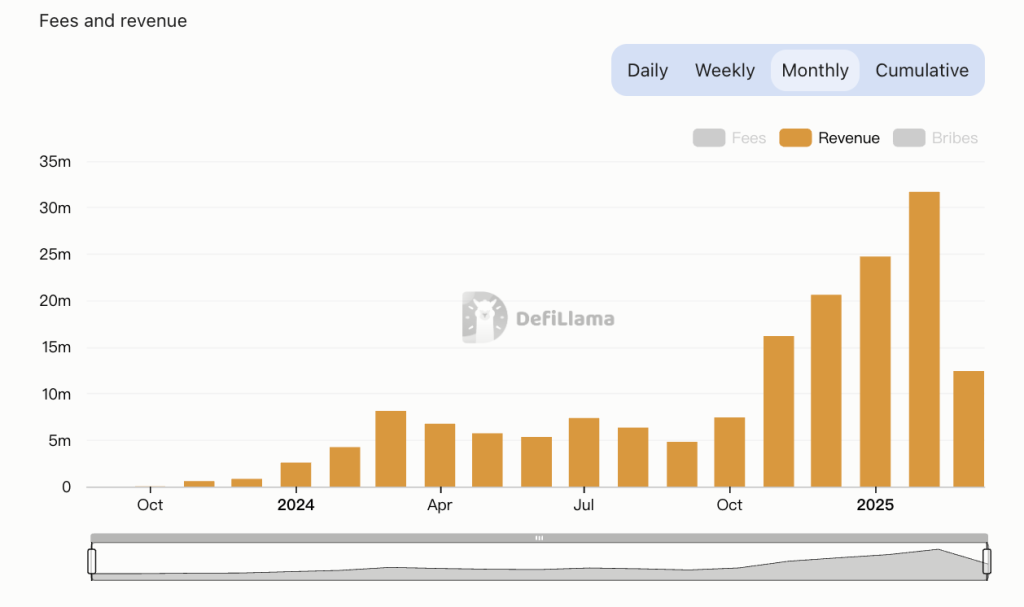
The chart below, sourced from DeFillama, shows Jupiter’s protocol revenue since October last year (Note: Possible anomalies in Jupiter aggregator revenue on Feb 10 and Mar 10; no alternative reliable revenue source found). Jupiter’s revenue remains primarily driven by derivatives (blue bars), partly because meme trading fervor had cooled when its aggregator fee went live.
 Data Source:DeFillama
Given Jupiter’s major economic model update at the end of January (introducing 0.05%–0.1% aggregator fees), February and March data offer more meaningful P/S comparisons.
Based on DeFillama’s figures, Jupiter earned $31.7M in February (annualized: $380M), implying a P/S (circulating) of 3.65 and P/S (fully diluted) of 9.5. In March (through the 18th), revenue was $12.25M (~$253M annualized), yielding a P/S (circulating) of 5.45 and P/S (fully diluted) of 14.15.
Source: DeFillama
Whether compared horizontally to CowSwap or vertically to Jupiter’s own history, $JUP’s current valuation appears relatively low.
Of course, these figures rely on Solana’s current momentum. As bearish pressures mount and Solana cools, sustaining such high revenue levels will become increasingly difficult—a trend already visible in March’s drop from February.
Join TechFlow official community to stay tuned
Telegram:https://t.me/TechFlowDaily
X (Twitter):https://x.com/TechFlowPost
X (Twitter) EN:https://x.com/BlockFlow_News


