

Step-by-step guide: Quickly master how to check Meteora liquidity price ranges
TechFlow Selected TechFlow Selected
Step-by-step guide: Quickly master how to check Meteora liquidity price ranges
To understand at what price Dev is distributing and accumulating in a one-sided pool, it is essential to know the corresponding price range.
Author: Zibu
Meteora is a DeFi project on the Solana chain, focused on building an efficient, sustainable, and flexible liquidity layer for the Solana ecosystem. Its goal is to address liquidity shortages on Solana, enabling smoother and lower-cost trading while delivering better returns for liquidity providers.
Meteora's pools are primarily DLMM pools and Dynamic Pools. In DLMM pools, users can provide liquidity in both two-sided and single-sided positions. Developers (Dev) can use single-sided pools to offload tokens or accumulate holdings. For example, with the Trump/Sol trading pair, when prices rise, the Dev can add a single-sided pool of $Trump within a higher price range. When the price reaches that range, $Trump will automatically be swapped into $Sol, facilitating token distribution while also earning trading fees. When prices fall, the Dev can add a single-sided pool of $Sol at a lower price range, automatically buying $Trump when the price drops into that range, thus achieving accumulation.
If we want to know at which prices the Dev uses single-sided pools to distribute or accumulate tokens, it's essential to understand their corresponding price ranges.
1. Basic Concepts
Website: https://app.meteora.ag/
1. Trading Pair
Any two tokens form a trading pair; for instance, $Trump and $Sol form the Trump-Sol pair, while $Trump and $USDC form the Trump-USDC pair.
2. Pool (LP Pool)
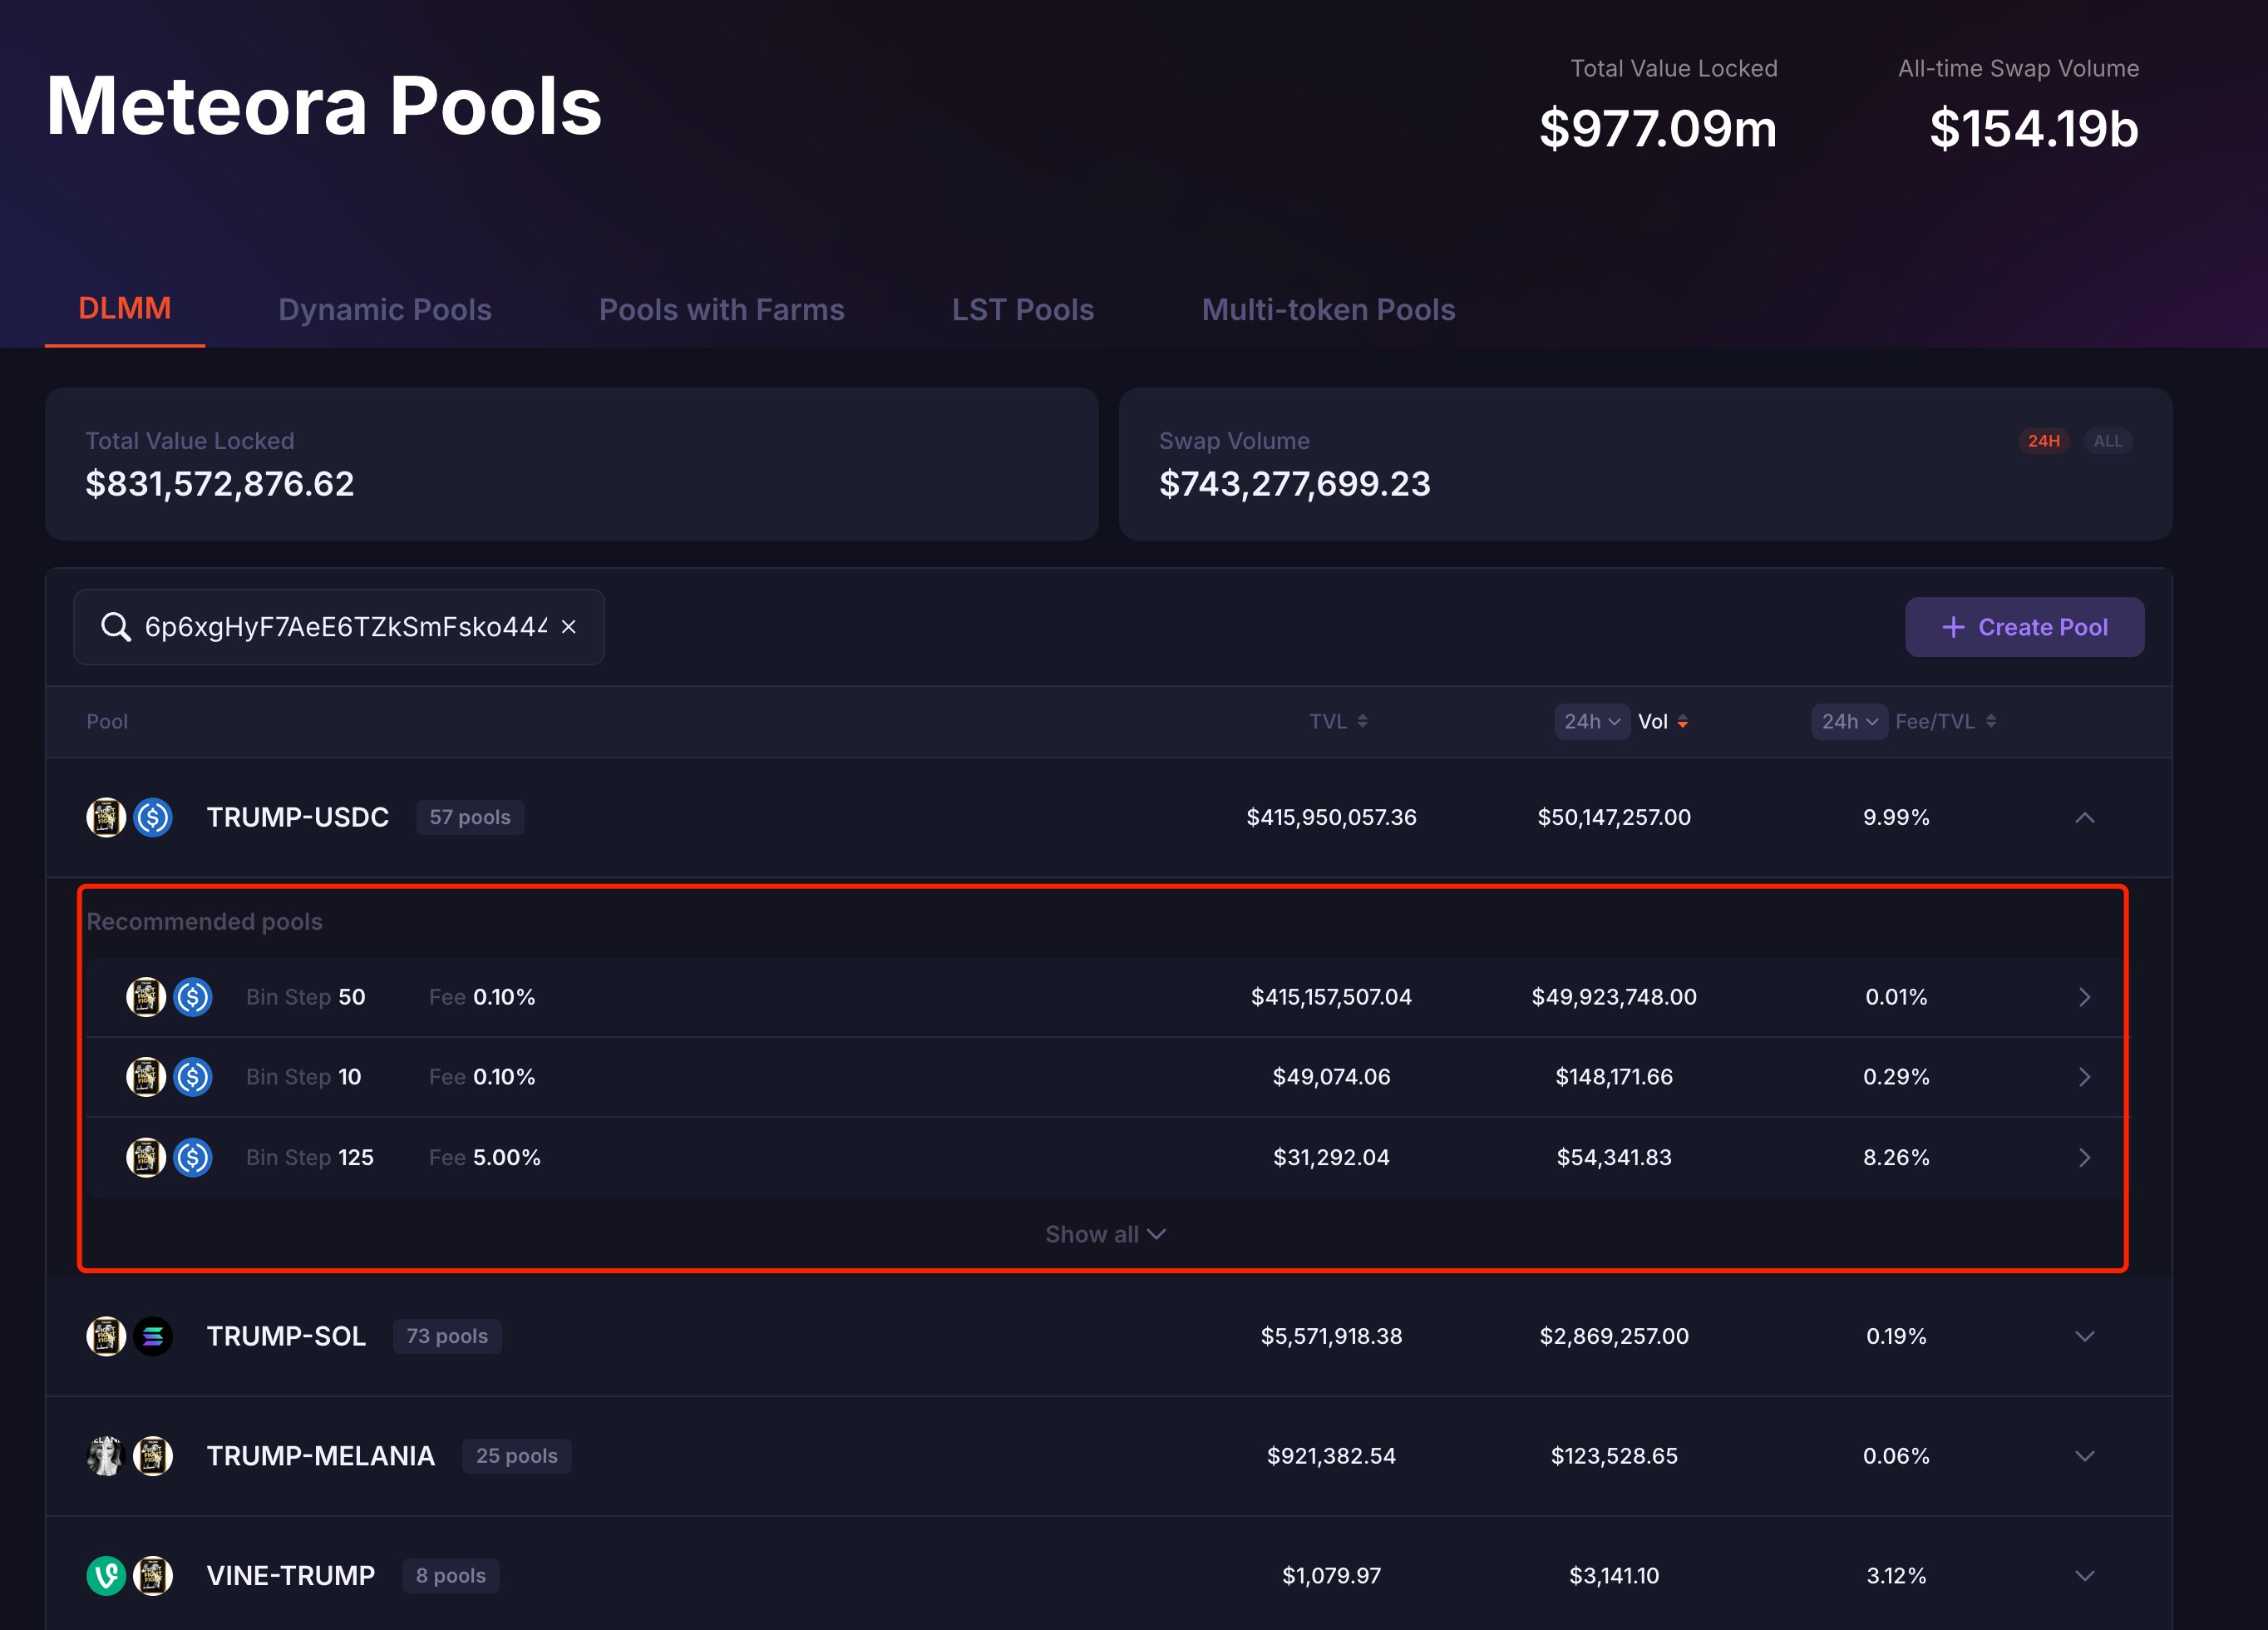
Beneath each trading pair, there can be multiple Pools, differentiated by Bin Step and Fee (trading fee).
For example, under the Trump-USDC trading pair, there are 57 Pools, each with a unique address.
As shown:
3. Bin
In DLMM, each Bin represents a price level, essentially functioning as a buy or sell order placed at a specific price.
4. Bin Step
Bin Step refers to the price interval between two adjacent Bins, measured in basis points (1 basis point = 0.01%). It determines the density of Bins and the granularity of liquidity distribution, set by the pool creator.
For example:
Assume the current Sol/USDC price is $20, with a Bin Step of 25 basis points (0.25%).
The next Bin’s price would be 20 × 1.0025 = $20.05, and the following one 20.05 × 1.0025 ≈ $20.10, and so on.
5. Position (Liquidity Position)
A Position describes how a liquidity provider allocates funds within a specific price range. Each Position has a unique address and is created within a particular pool, with multiple Positions possible per pool.
A Position typically includes the following key elements:
(1) Price Range
Each Position has a defined price range indicating the price levels where the liquidity provider wishes to support trading. This range consists of a sequence of consecutive Bins.
(2) Liquidity Amount
The quantity of two tokens provided (e.g., Sol and USDC). Meteora calculates the exact ratio based on the current price and range to meet pool requirements.
(3) Distribution Strategy
Meteora offers several liquidity distribution methods:
Spot (Uniform Distribution): Funds are evenly distributed across all Bins, suitable for low volatility scenarios.
Curve (Bell-shaped Distribution): Liquidity is concentrated around the current price, tapering off toward the edges—ideal for LPs expecting price stability.
Bid-Ask (Bimodal Distribution): Liquidity peaks on both sides of the current price, forming two clusters—optimal for highly volatile markets.
(4) Bin Step
Users cannot modify the Bin Step when creating a Position; this parameter is fixed upon Pool creation.
2. Viewing via Wallet Connection
After connecting a wallet, Meteora allows users to view their Positions. It also supports viewing via watch-only wallets, enabling inspection of a pool’s price ranges.
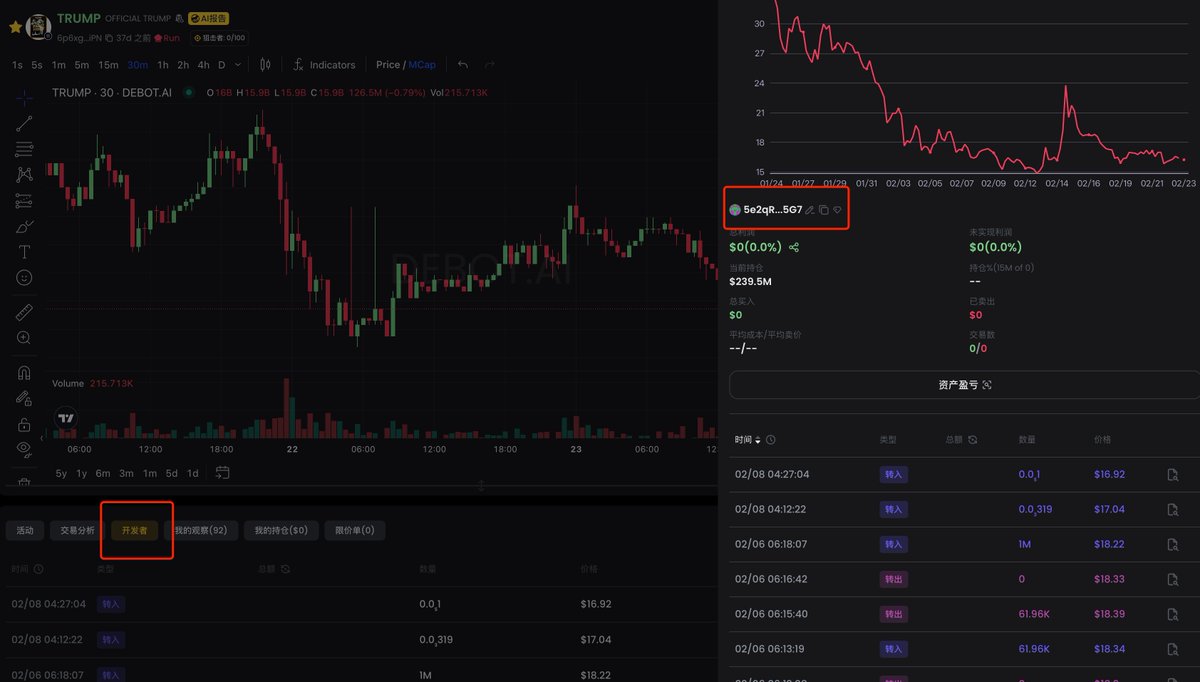
Take $Trump as an example.
First, open Debot, enter $Trump’s contract address (CA), and locate the Dev’s address:
5e2qRc1DNEXmyxP8qwPwJhRWjef7usLyi7v5xjqLr5G7
As shown:
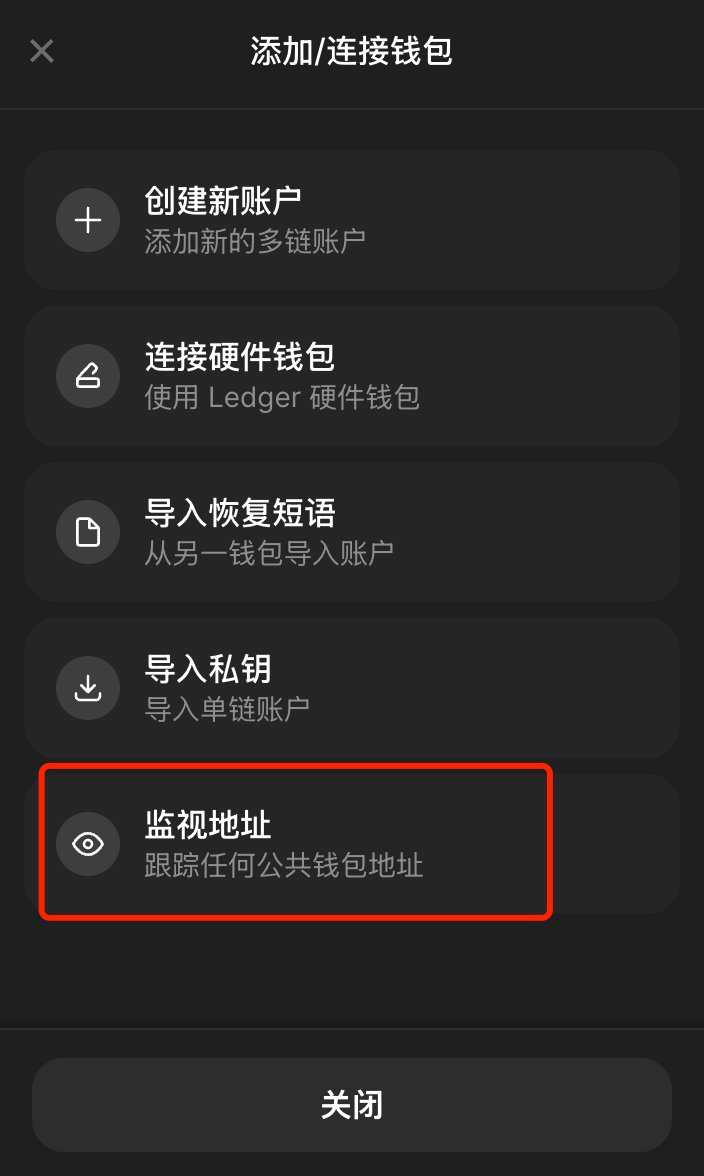
Next, open the Phantom wallet, select 【Add/Connect Wallet】 → 【Watch Address】, then input the name and the Dev’s address:
5e2qRc1DNEXmyxP8qwPwJhRWjef7usLyi7v5xjqLr5G7
Finally, connect Phantom to Meteora, click 【Portfolio】 at the top to see all added pools. Click any DLMM pool to view its details and all active Positions.
As shown:
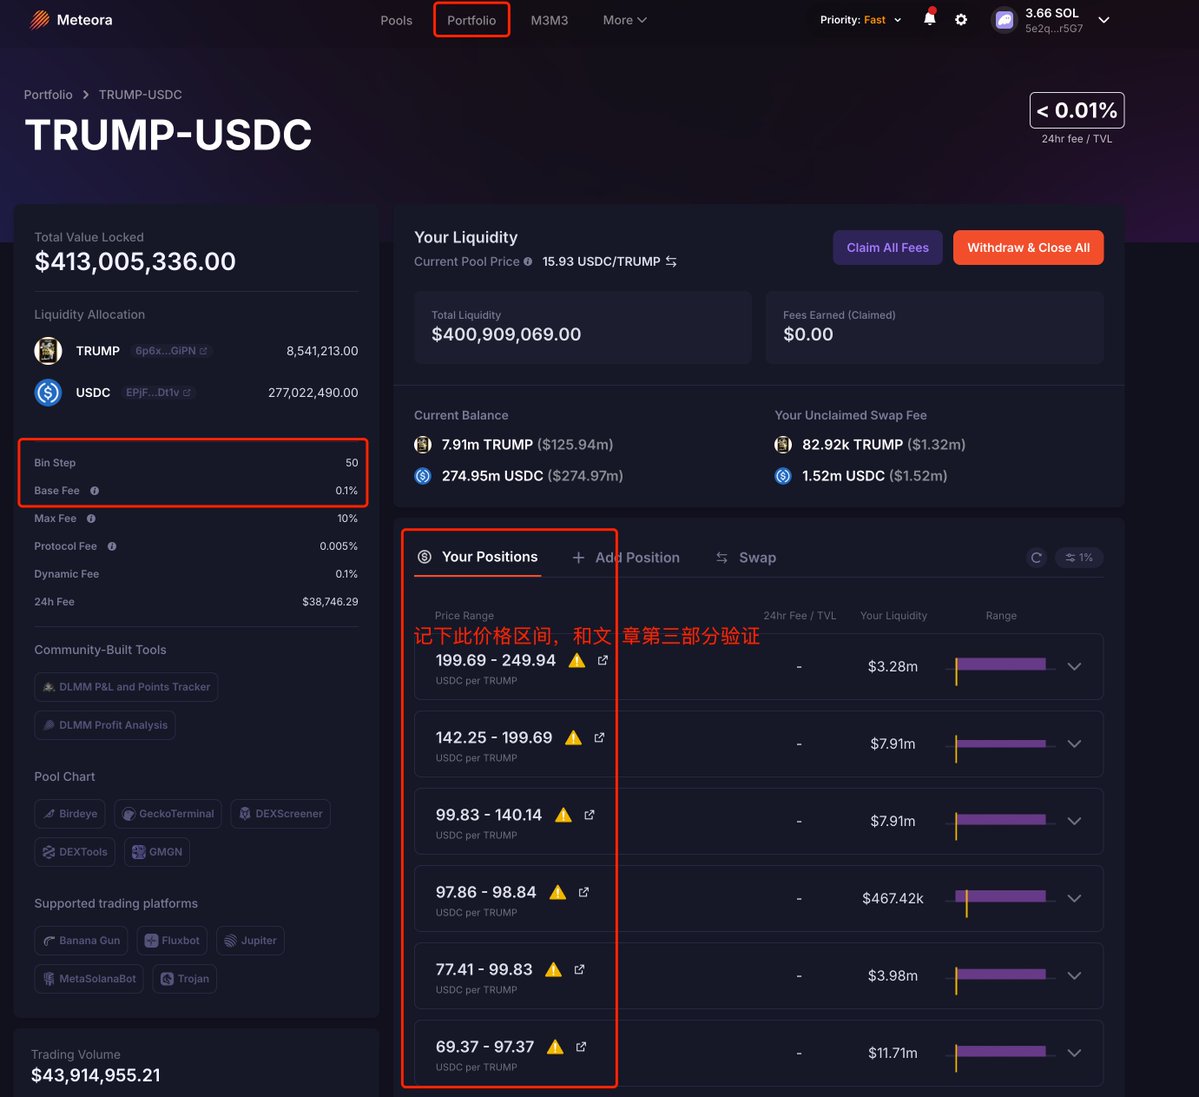
The Bin Step and Base Fee on the left display current pool information, while the center section shows Positions across different price ranges. Clicking any Position reveals current balance, unclaimed fees, distribution strategy, and more.
The advantage of this method is convenience and visual clarity, listing all existing Position data. The downside is that withdrawn liquidity cannot be viewed afterward.
3. On-chain Data Calculation
We can calculate each Position’s price range using on-chain data, regardless of whether the Position still exists.
Meteora’s documentation provides the calculation formulas:
Minimum price in range: min_price = (1 + Bin_Step/10000) ^ lower_Bin_id
Maximum price in range: max_price = (1 + Bin_Step/10000) ^ upper_Bin_id
For a trading pair A/B, where token A has decimals_A and token B has decimals_B, the final formulas are:
Minimum price: min_price = (1 + Bin_Step/10000) ^ lower_Bin_id / 10^(decimals_B - decimals_A)
Maximum price: max_price = (1 + Bin_Step/10000) ^ upper_Bin_id / 10^(decimals_B - decimals_A)
Note: The calculated price reflects token A relative to token B. To convert to USD, you must additionally query token B’s USD price and perform conversion.
From these formulas, we need the following data: Bin_Step of the pool, lower_Bin_id and upper_Bin_id of the Position, and the decimal precision of both tokens in the trading pair.
Continuing with $Trump, let’s calculate the price range of a single-sided pool held by this Dev.
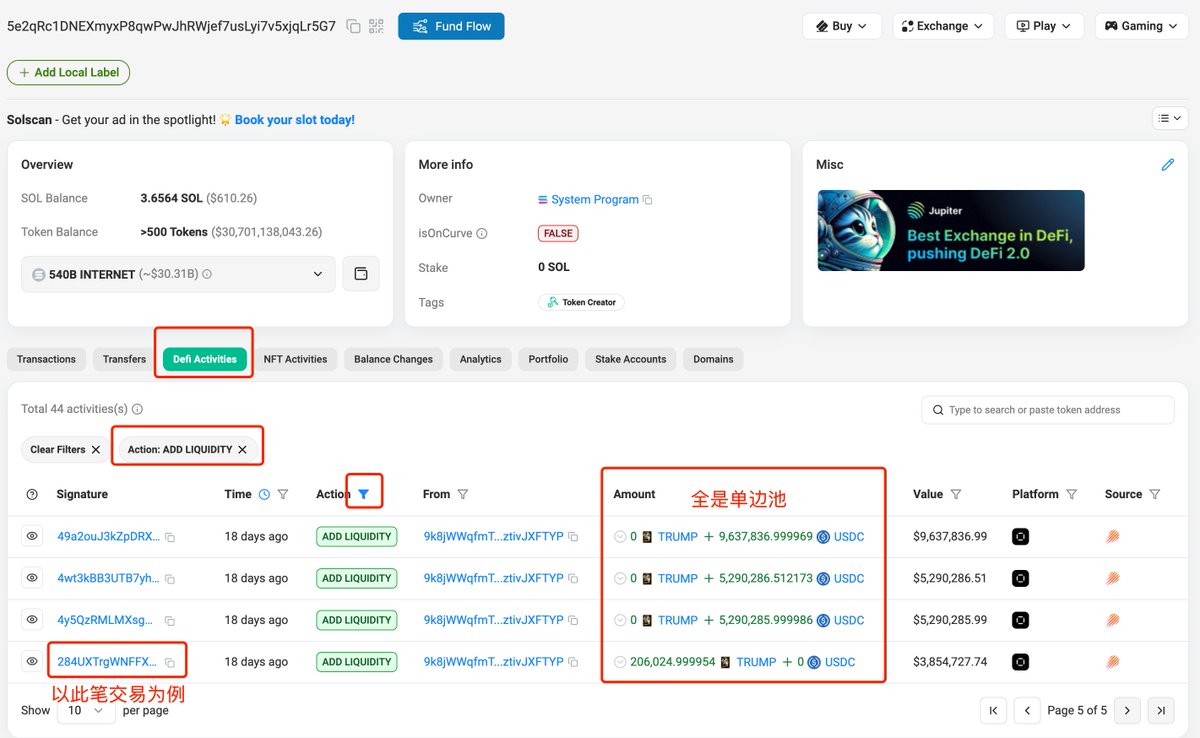
Open Solscan and enter the Dev address for $Trump:
Navigate to the 【Defi Activities】 tab, filter 【Action】 to “ADD LIQUIDITY”, and observe that all listed liquidity additions are single-sided—either only $Trump or only $USDC added.
This article uses the last transaction shown in the image:
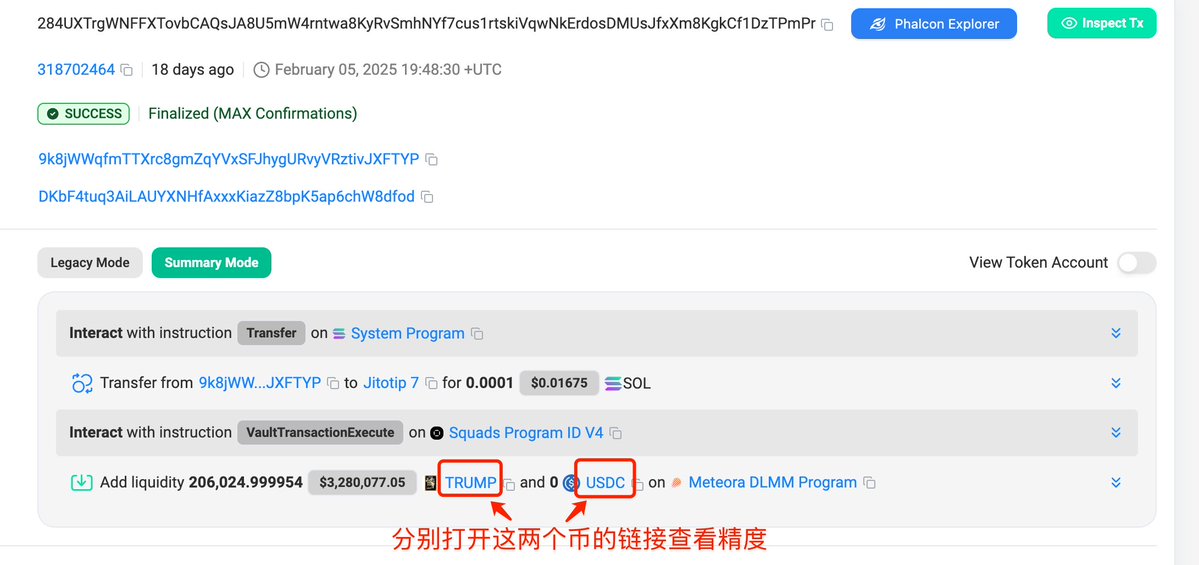
Open the last transaction in the list:
In the transaction details, we see only $Trump was added to the pool, as shown:
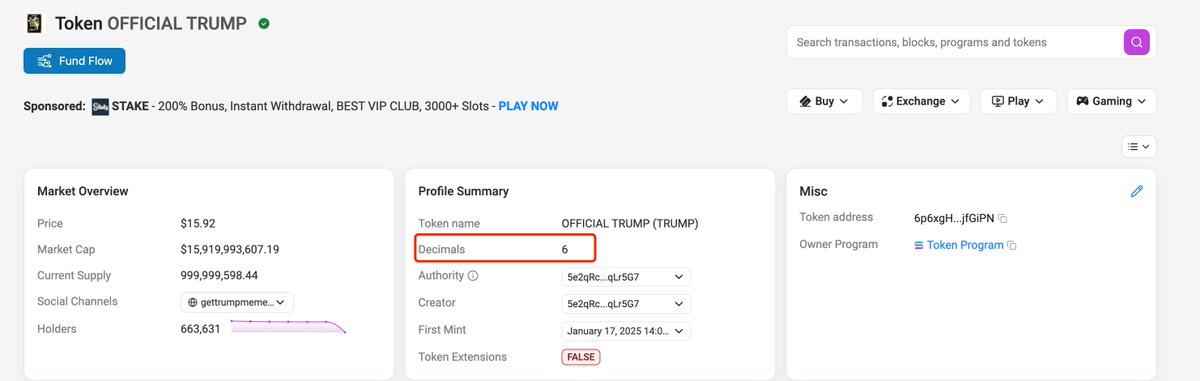
By opening the links for $Trump and $USDC, we find both have 6 decimal places, as shown:
Scroll down the transaction details to 【#4.1 - Meteora DLMM Program: initializePosition】, where lowerBinId is 1062, the Bin width (number of Bins) is 46, and the pool address is:
9d9mb8kooFfaD3SctgZtkxQypkshx6ezhbKio89ixyy2
As shown:
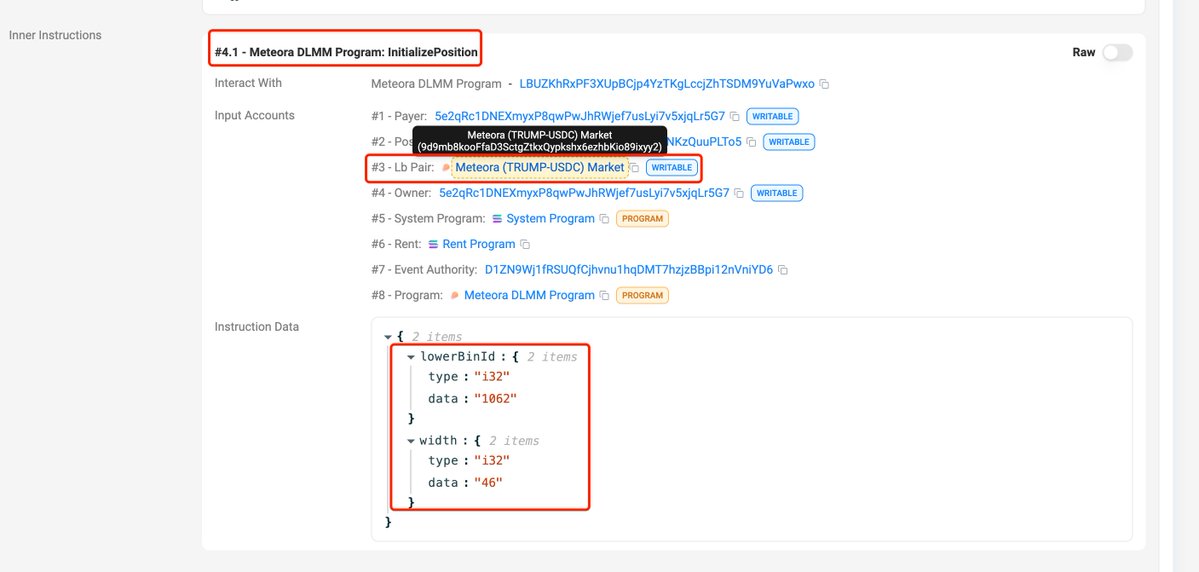
From this, we calculate upperBinId = lowerBinId + width - 1 = 1062 + 46 - 1 = 1107
Now, open the pool address on Solscan:
9d9mb8kooFfaD3SctgZtkxQypkshx6ezhbKio89ixyy2
https://solscan.io/account/9d9mb8kooFfaD3SctgZtkxQypkshx6ezhbKio89ixyy2
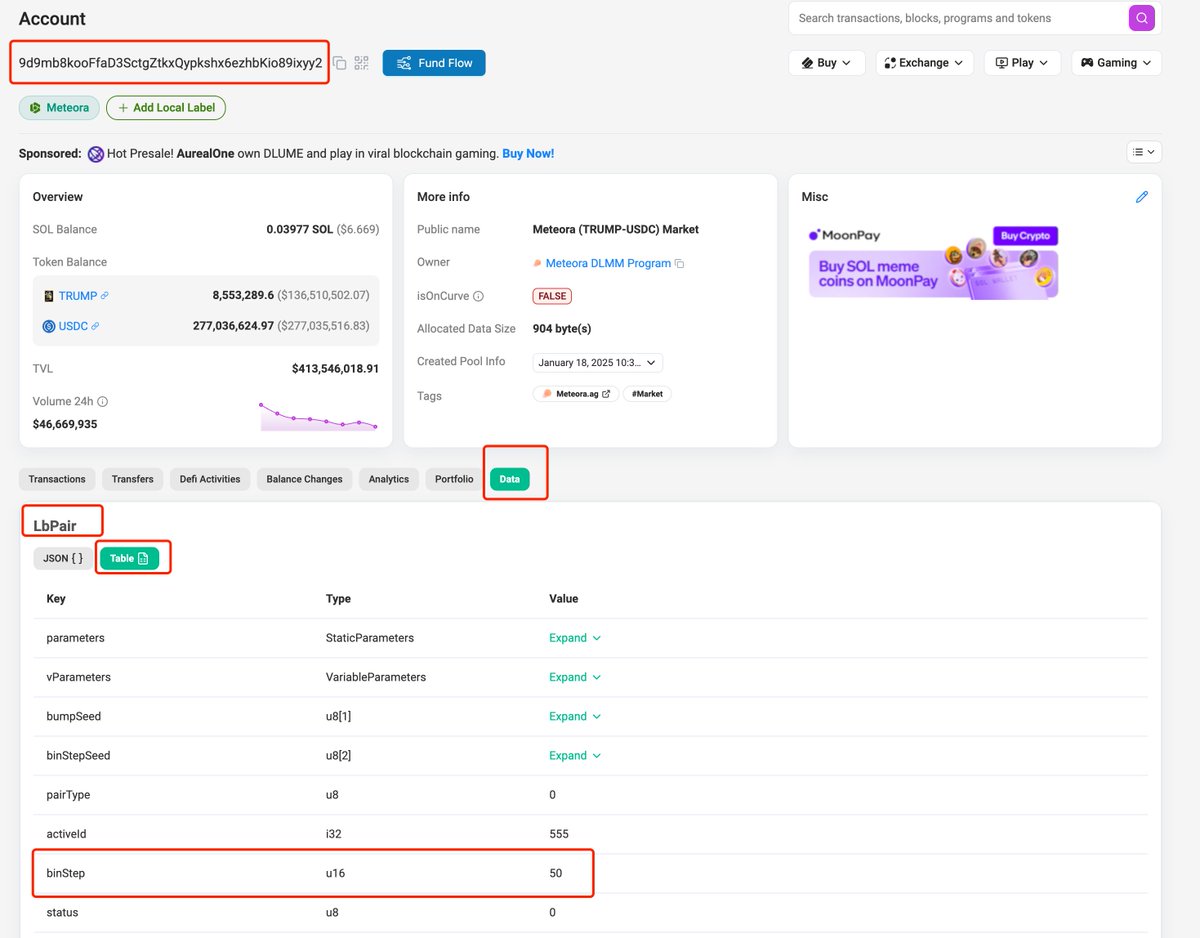
Click the 【data】 tab, switch “LbPair” to “Table” format, and find the BinStep value is 50, as shown:
Now we have all required data for the formula:
Bin_Step = 50
lower_Bin_id = 1062
upper_Bin_id = 1107
decimals_A = 6
decimals_B = 6
Therefore:
Minimum price: min_price = (1 + 50/10000) ^ 1062 / 10^(6−6) = 199.6905832
Maximum price: max_price = (1 + 50/10000) ^ 1107 / 10^(6−6) = 249.9368917
The calculated price range exactly matches the range shown in the image from Section Two.
4. Summary
Combined with monitoring tools, when we detect that a Dev or large holder adds a single-sided pool, we can use the above method to determine their intended price range for distribution or accumulation, then make informed decisions using K-line charts and other data. For example, $LIBRA issued by Argentina’s president Milei also used single-sided pools for distribution—its historical pool addition price ranges can be analyzed using the method described here.
I commonly use Debot, GMGN, and OKX. However, these tools are still inconvenient for liquidity analysis. Some ideal features include:
1. Listing all operations by the Dev, including transfers in/out, adding/removing liquidity, with clear identification of locked positions and liquidity events.
Debot identifies all transfers but lacks liquidity event tracking;
GMGN detects liquidity additions/removals but misses Dev’s transfers and failed to identify such events for Trump;
OKX has a “liquidity pool change” feature that separately lists liquidity events, but also failed to capture Dev’s liquidity actions for Trump.
2. For each liquidity add/remove event, directly displaying the specific price range, eliminating manual calculations.
3. When calculating Dev’s profit, including claimed fees and capital changes from removing liquidity, avoiding manual profit tracking.
This functionality could potentially be implemented by Debot and GMGN, as they already track profit data per address.
Join TechFlow official community to stay tuned
Telegram:https://t.me/TechFlowDaily
X (Twitter):https://x.com/TechFlowPost
X (Twitter) EN:https://x.com/BlockFlow_News


