
5 Big Data Analysis: Has the market reached a阶段性 bottom range?
TechFlow Selected TechFlow Selected
5 Big Data Analysis: Has the market reached a阶段性 bottom range?
Tokens lacking popularity, narrative, fundamentals, and facing continuous large-scale unlocks may struggle to attract funding and could face ongoing downward pressure.
 Navigating Web3 tides with focused insights
Author: 1912212.eth, Foresight News
Since the market peaked in December 2024, it has been fluctuating for several months, with many participants suffering heavy losses amid endless downtrends and choppy price action. Market sentiment is deeply divided on bull vs bear outlooks and long vs short positions. With macro conditions unstable, Trump waving tariffs again, and Fed rate cuts still far off, market liquidity is tightening and pessimism is spreading across the community.
So how is the crypto market progressing? If Bitcoin still has room to rise further, are we now in a阶段性 bottom zone?
1. Fear Index Below 40 Since February This Year
The CMC Fear & Greed Index on CoinMarketCap measures overall market sentiment in the cryptocurrency space. Ranging from 0 to 100, lower values indicate extreme fear while higher ones reflect extreme greed. This index helps investors gauge market mood for better buy/sell decisions, and also signals whether the market may be undervalued (extreme fear) or overvalued (extreme greed).
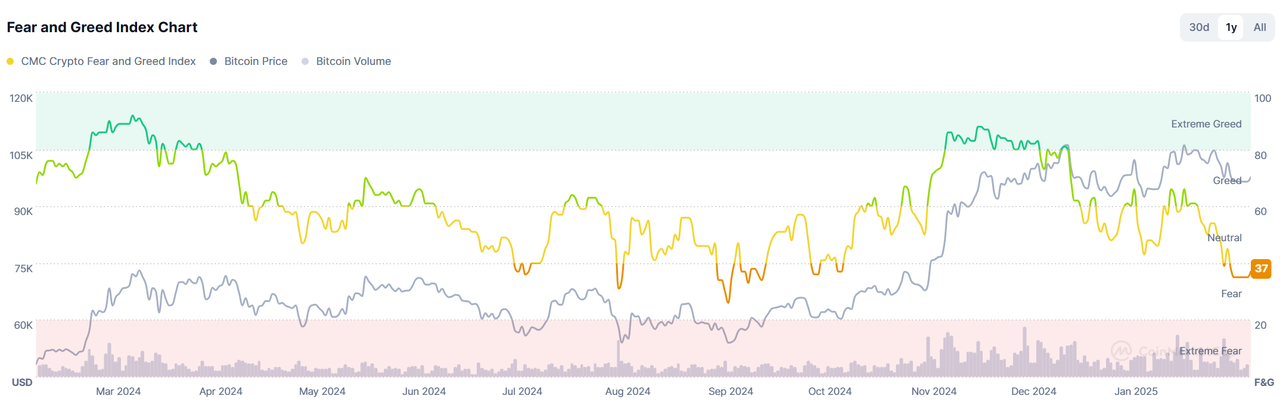
As shown above, from July to early October 2024, the Fear Index dropped below 40 multiple times (indicating fear), followed by a FOMO phase in November when the index briefly exceeded 80. After that, the market pulled back. Currently, since early February this year, the Fear Index has once again fallen below 40.
Historically, extremely low Fear Index readings often suggest that prices may be approaching a阶段性 bottom zone.
2. Bitcoin's 7-Day Average Funding Rate Down 85% From December Last Year
The 7-day average funding rate of perpetual contracts serves as a key indicator of market sentiment. During bullish rallies, funding rates tend to stay high—often signaling market tops. Conversely, low or negative funding rates frequently coincide with market bottoms.
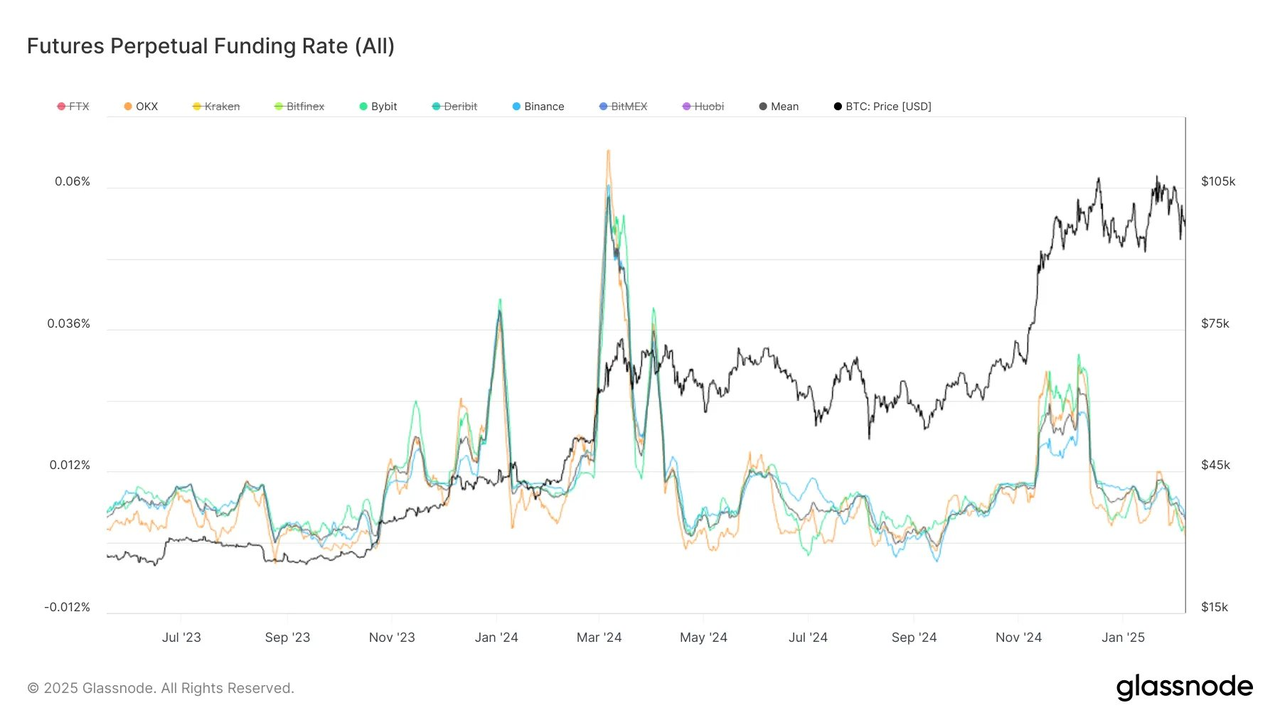
As shown above, in March 2024, BTC’s 7-day average funding rate briefly surpassed 0.06%, indicating long traders were willing to pay high premiums to shorters—a sign of extreme FOMO and marking the peak of Q1 that year. From November to December 2024, the rate remained above 0.03%, coinciding with Bitcoin briefly breaking the $100K mark. However, prior to the rally, funding rates turned negative between May and October of that year.
At the time of writing, the funding rate has dropped to just 0.004%, down 85% from its December peak. Market sentiment is clearly bearish.
3. ETH Profit-Taking Ratio Hits 4-Month Low
Ethereum’s market cap has declined 36% from its local high seven weeks ago, sharply reducing the number of ETH holdings in profit. Daily closing data shows the current ETH profit ratio has hit a four-month low, with the number of profitable tokens falling to a three-month minimum.
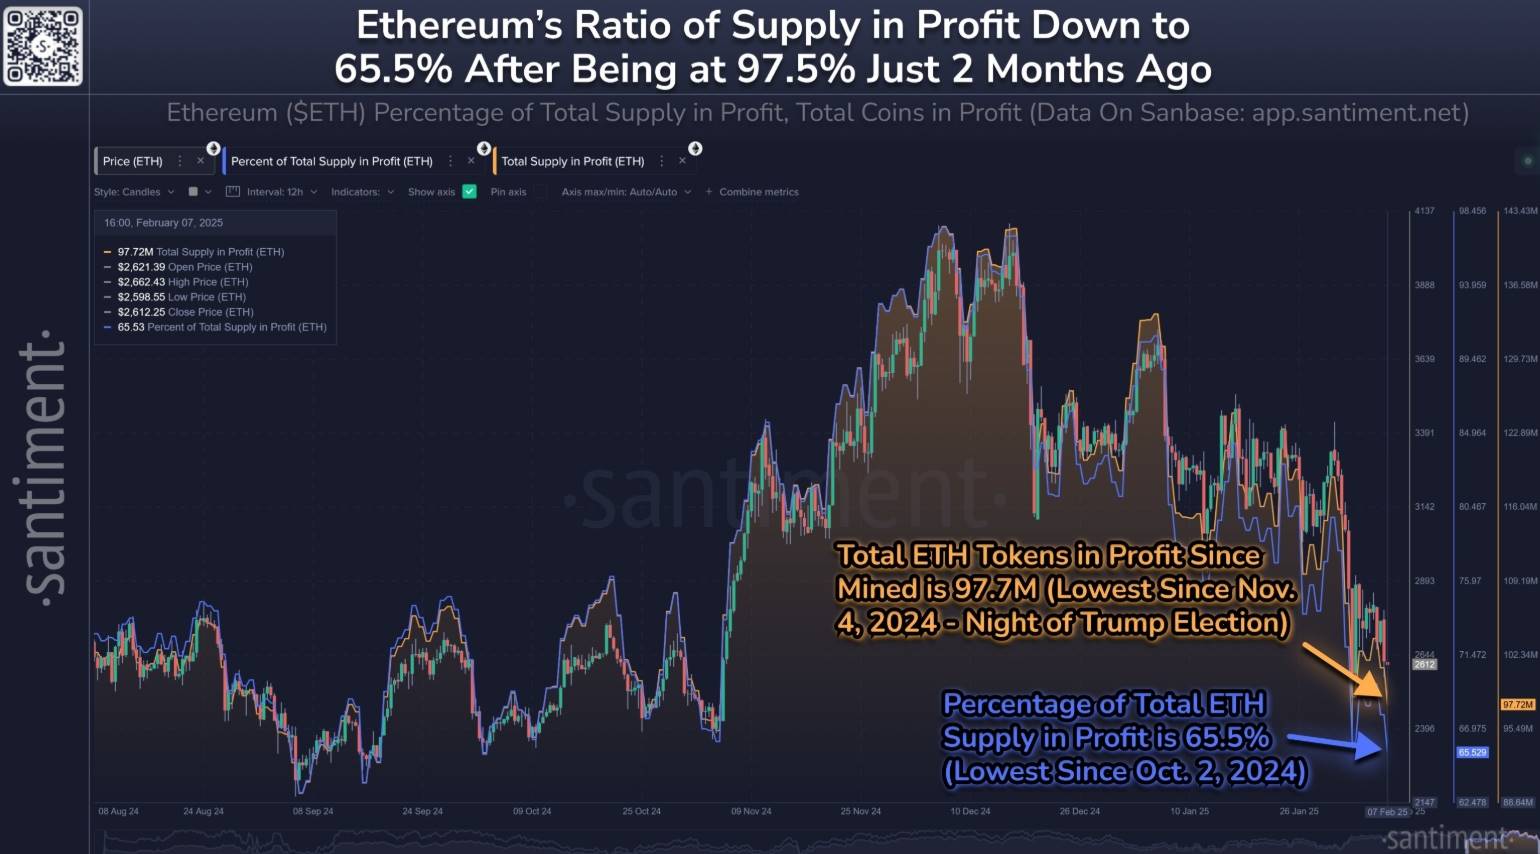
As the second-largest cryptocurrency by market cap, Ethereum has underperformed other major coins, reflecting notably negative market sentiment. Despite prevailing panic (FUD) and ongoing retail selling, Ethereum could see a rebound once the broader crypto market stabilizes.
4. Bitcoin Miners Surrender Again Since Early February, Mining Difficulty Rises Instead of Falling
Bitcoin miner capitulation is often seen as a key signal of potential market bottoms. When miners surrender, it means the cost of mining one Bitcoin exceeds revenue. Historically, such events have frequently coincided with market lows.
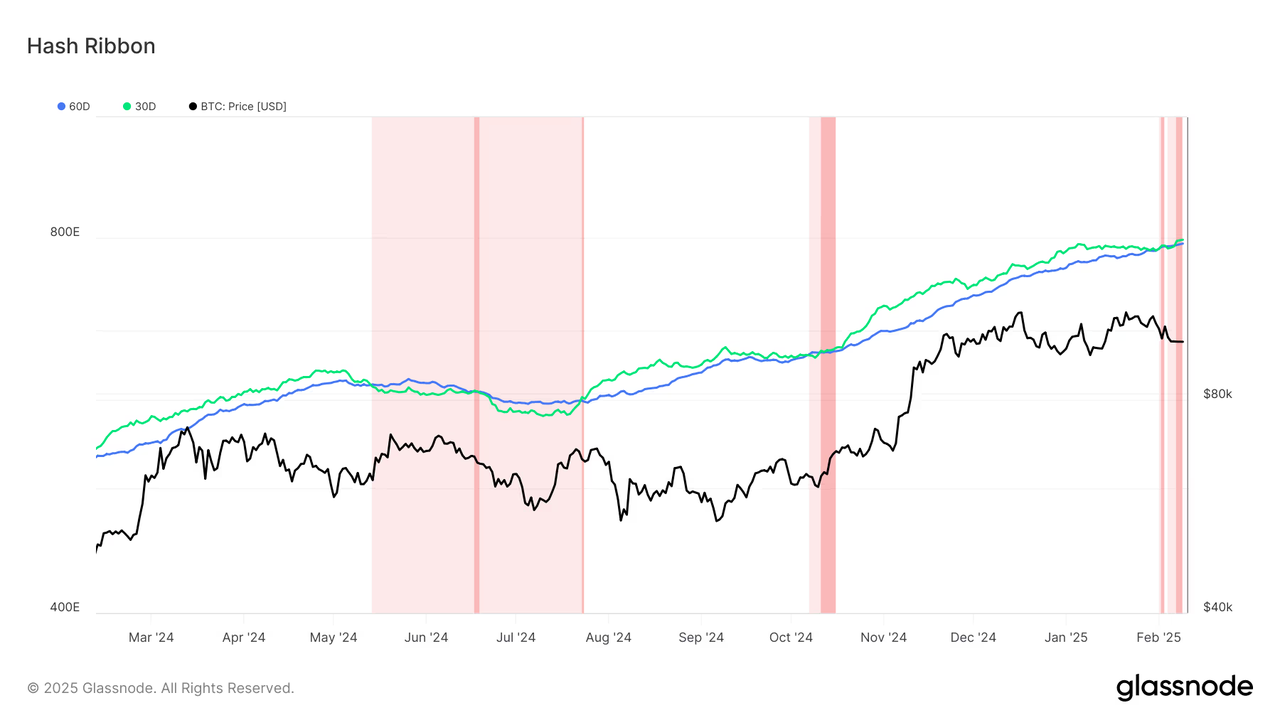
The chart above shows Bitcoin miners previously capitulated in June and October 2024. In 2025, miner capitulation resumed starting in February.
Meanwhile, Bitcoin’s mining difficulty recently hit a record high of 114.7T. Rising difficulty typically indicates miners remain confident in Bitcoin’s long-term value, otherwise they wouldn’t keep investing in hash power. This could provide some positive support to market sentiment.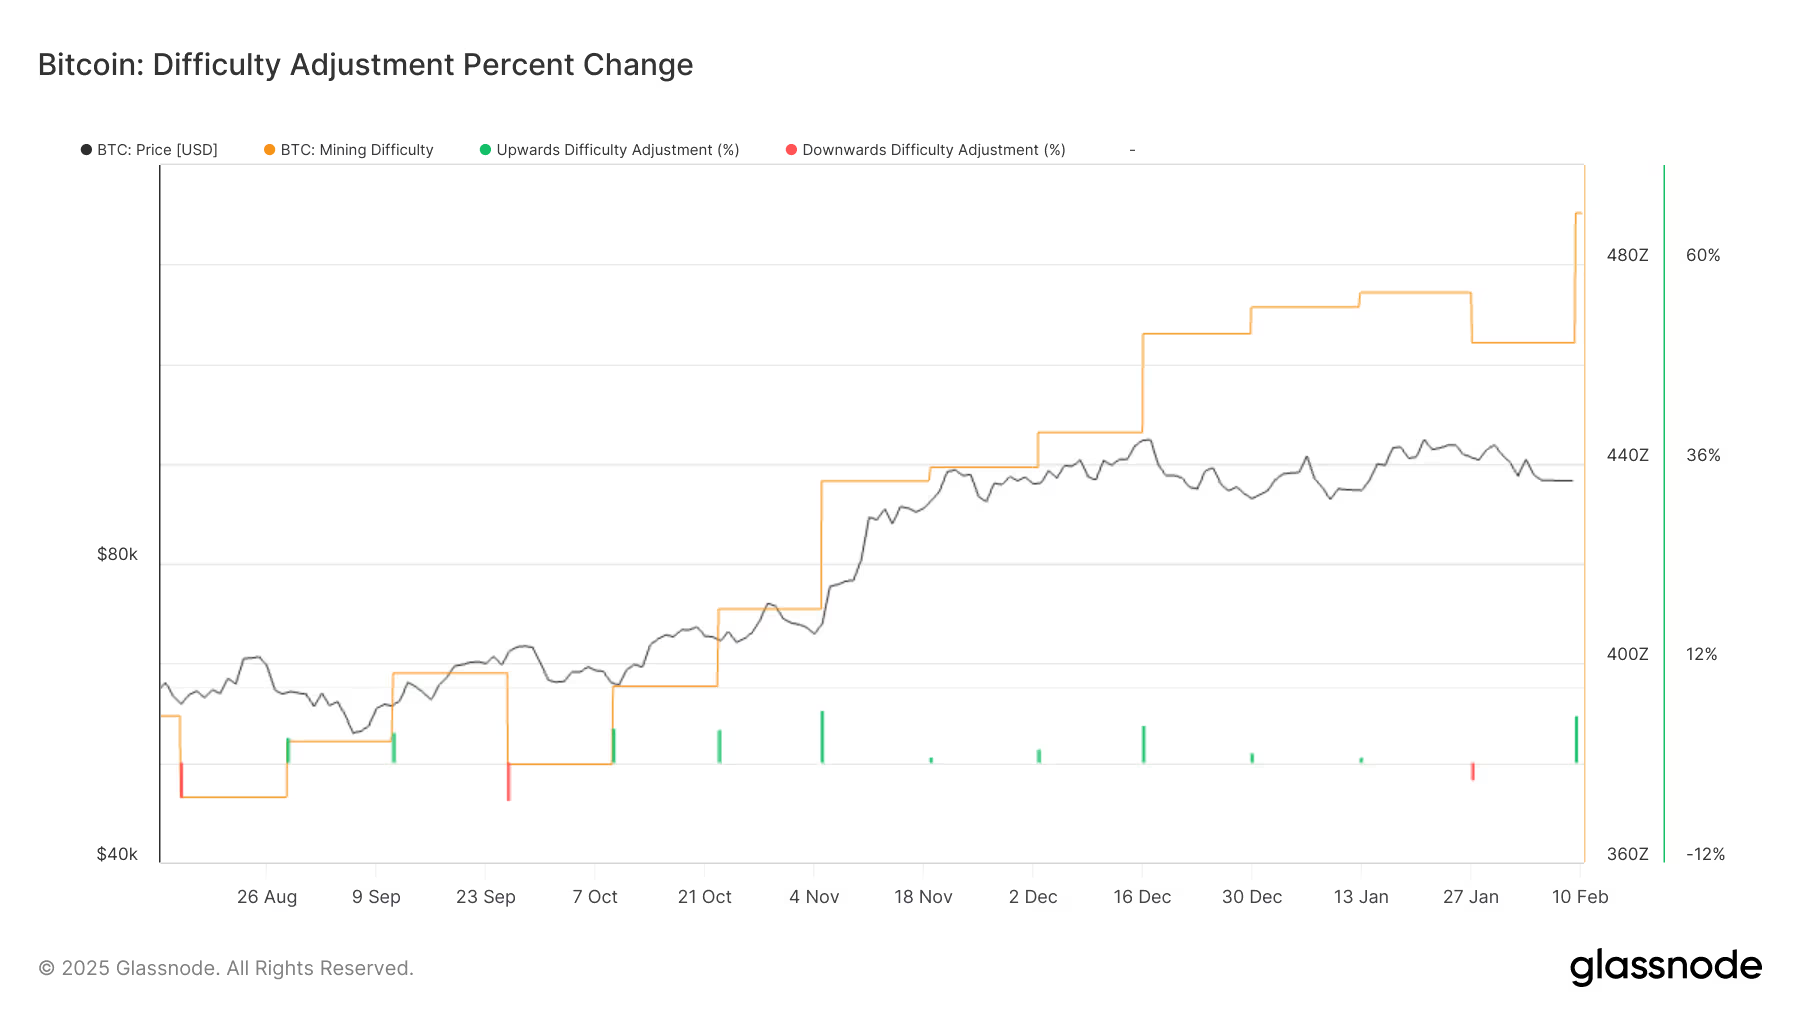
5. Stablecoin Market Cap Rises Over Past Month Instead of Falling
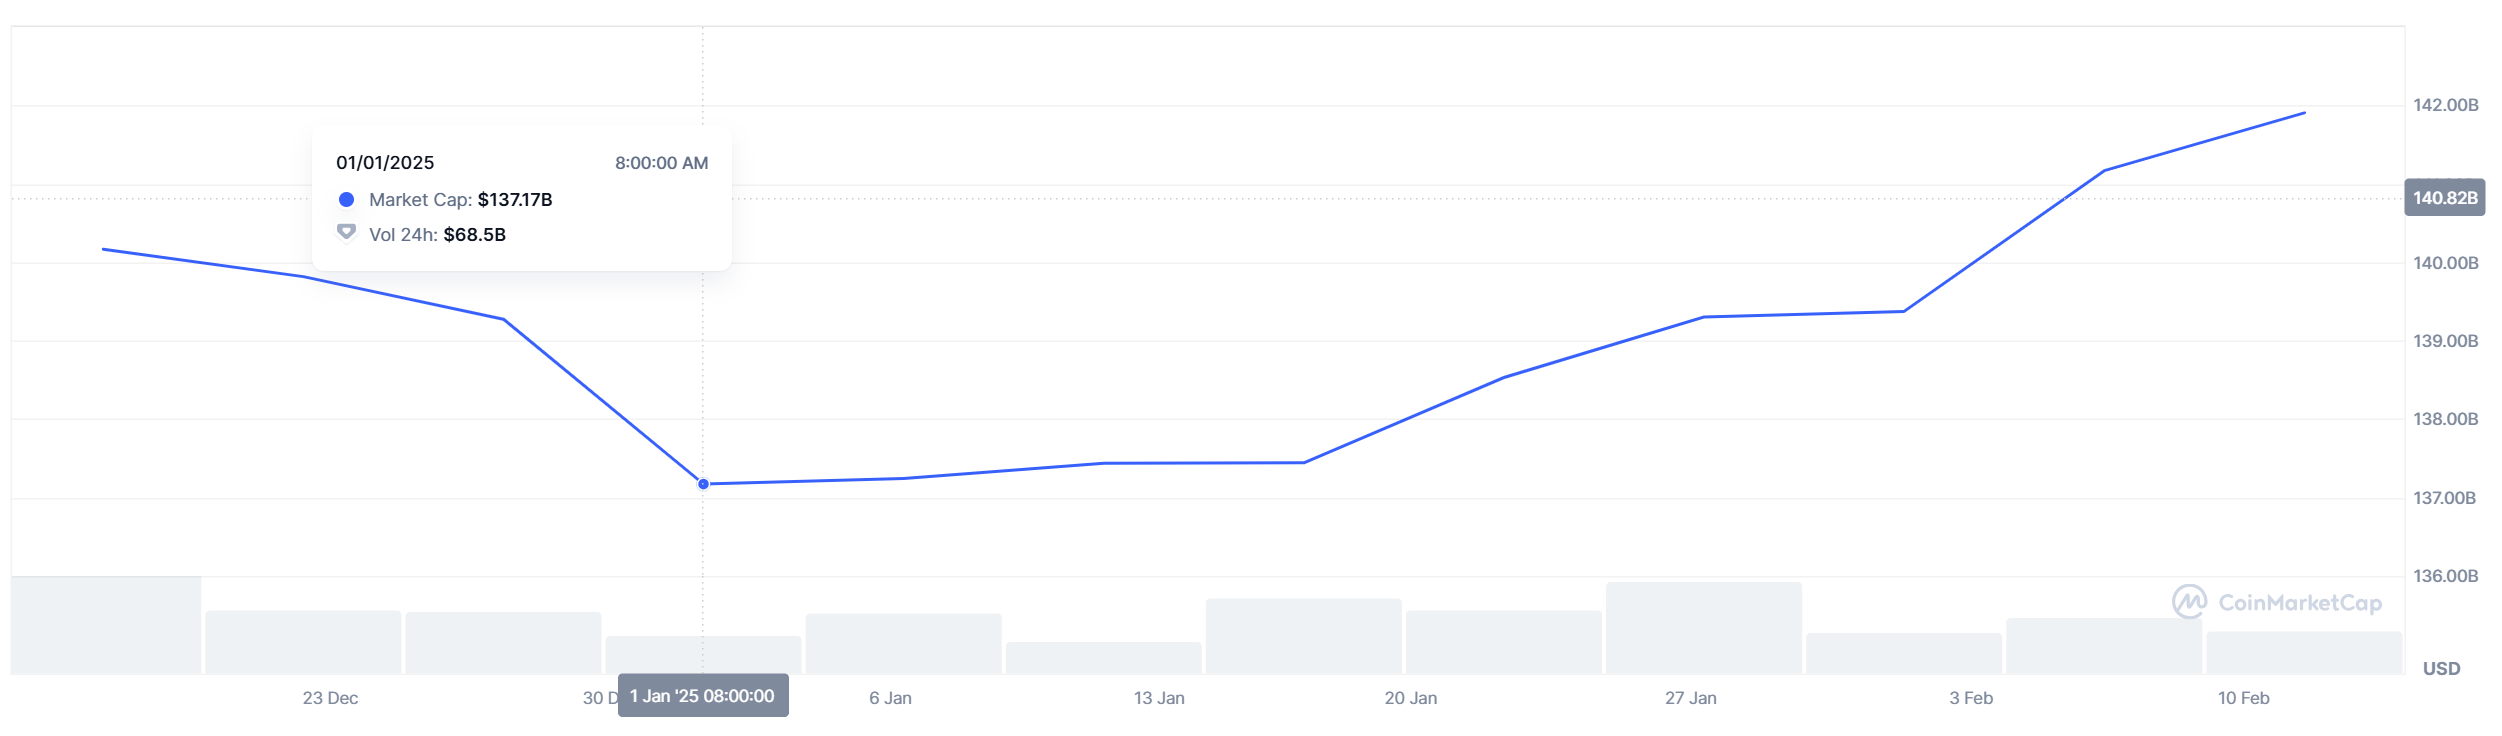
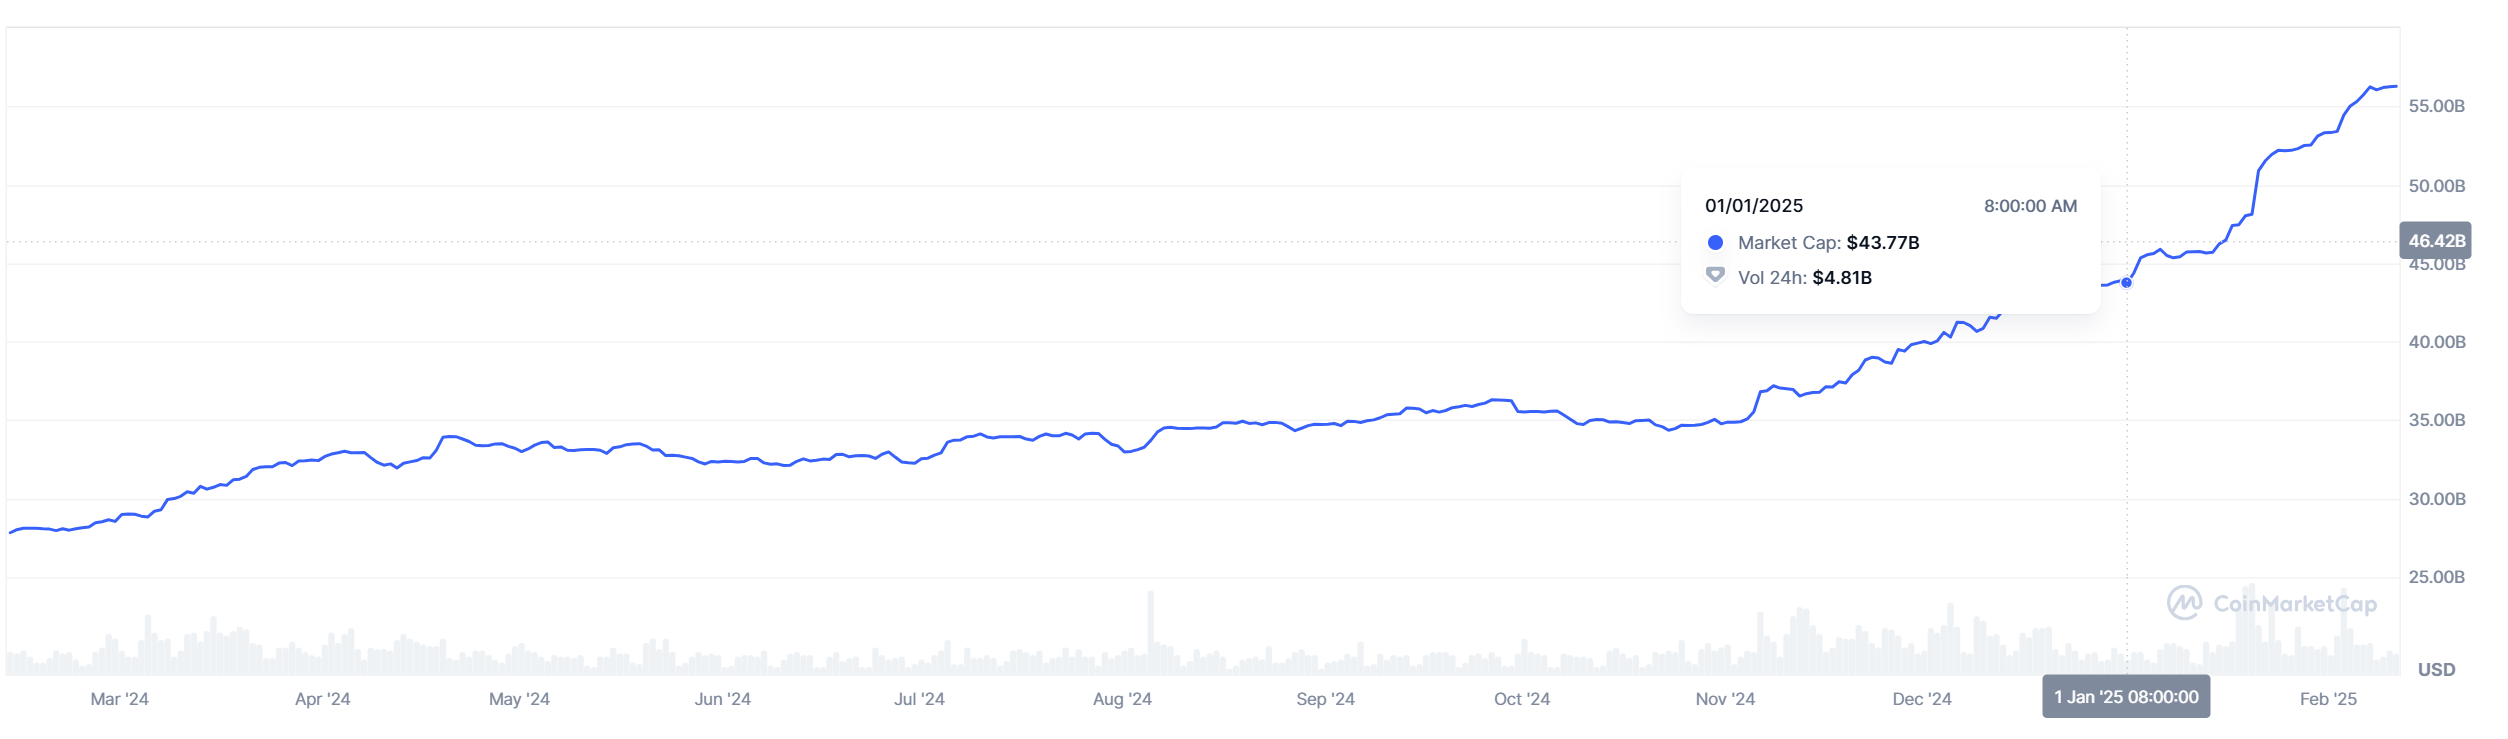
Stablecoin metrics are important indicators of capital flows into the crypto market. Over the past month, according to DefiLlama, USDT’s market cap increased by 3.4% ($4.676 billion), while USDC surged by 22.73% ($10.396 billion).
Since January 1, 2025, USDT’s market cap has grown from $137.17 billion to $141.9 billion—an increase of $4.73 billion.
USDC rose from $43.77 billion to $56.28 billion during the same period.
Summary
The above five indicators may suggest the market is currently in a阶段性 bottom zone, though it remains uncertain when prices will break out. Investors should note that even if some tokens appear near their lows, those lacking narrative,热度, fundamentals, and facing continuous large token unlocks may struggle to attract capital and could continue declining.
Join TechFlow official community to stay tuned
Telegram:https://t.me/TechFlowDaily
X (Twitter):https://x.com/TechFlowPost
X (Twitter) EN:https://x.com/BlockFlow_News
 Foresight News