

Data Review of Ethereum's "Darkest Hour": $380 Million in Contract Liquidations, Ongoing Staking Outflows, Inflation Returns
TechFlow Selected TechFlow Selected
Data Review of Ethereum's "Darkest Hour": $380 Million in Contract Liquidations, Ongoing Staking Outflows, Inflation Returns
Prices erase a year's gains, contract open interest hits new highs repeatedly.
Author: Frank, PANews
On February 3, the crypto market faced another dark moment as the entire market experienced a sharp downturn. Within 24 hours, over 720,000 traders were liquidated across the board, totaling $2.21 billion in liquidations (Bybit CEO Ben Zhou speculated the real figure might reach $8–10 billion due to incomplete data collection), including $1.87 billion in long positions and $340 million in short positions. Ethereum stood out during this downturn, plunging by as much as 25% in a single day—the largest daily drop in nearly four years (since May 2021). Moreover, Ethereum's total liquidation amount reached $380 million on that day, surpassing Bitcoin’s futures liquidation value.
After this wave of liquidations, market disappointment toward Ethereum peaked. Rumors circulated that certain industry whales or institutions may have been liquidated during this move, triggering ETH’s steep decline. So, what is Ethereum’s current fundamental state after this storm? PANews analyzes Ethereum from multiple angles—futures open interest, ETF inflows, on-chain metrics, token inflation—and paints a comprehensive picture.
Price Erases One-Year Gains, Open Interest Hits Repeated Highs
First, in terms of price, Ethereum hit a low of $2,125 this round—slightly higher than the August 2024 pullback low of $2,111. However, the intraday volatility was significantly larger, making it highly destructive for the derivatives market. From its peak of $4,107 down to the bottom, Ethereum corrected nearly 48% over roughly 50 days, bringing prices back close to early 2024 levels. This is precisely why long-term holders are frustrated.
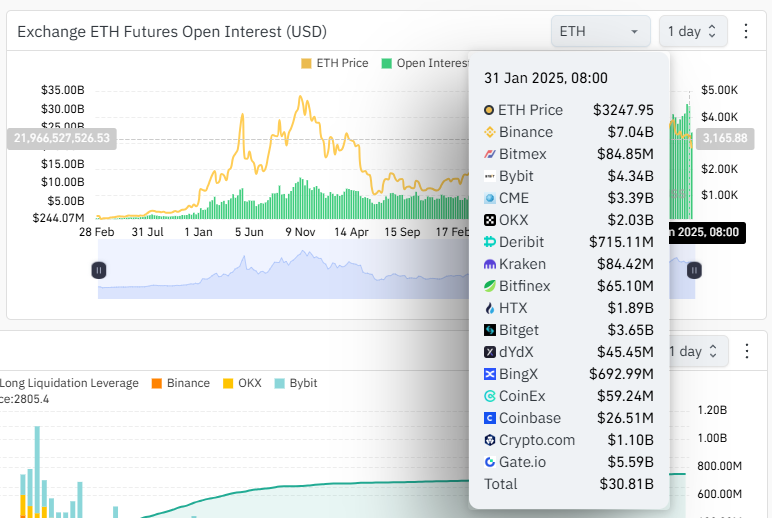
Although Ethereum’s market performance has not been impressive over the past year, open interest across exchanges has consistently increased, repeatedly breaking historical records. According to CoinGlass data, Ethereum’s total open interest reached $30 billion as of January 31. When Ethereum hit its all-time high of $4,800 in 2021, this figure stood at just $11.4 billion. Following the market crash, by February 5, the combined open interest across major exchanges dropped to $23.7 billion—a nearly $7 billion decline.
The contrast between open interest and price reveals a significant gap between market expectations and actual outcomes, leading to continuous leveraged bets and contributing to the extreme volatility behind this sudden downturn.
Are U.S. Spot ETFs Buying the Dip Recently?
Regarding U.S. spot Ethereum ETF inflows, since November 6, net inflows into various institutions’ Ethereum ETFs have noticeably increased. The highest single-day net inflow reached $428 million on December 5. Of course, as Ethereum’s price fluctuated sharply, both daily net inflows and outflows grew substantially. On January 8, daily ETF net outflows hit $159 million—the highest ever recorded. On February 3, despite Ethereum’s sharp price drop and heavy losses in the futures market, ETF funds did not flee. Instead, on February 4, ETFs saw a $300 million net inflow—the third-highest single-day inflow on record. This suggests that traditional institutional players in the U.S. market may be actively accumulating exposure in this price range.
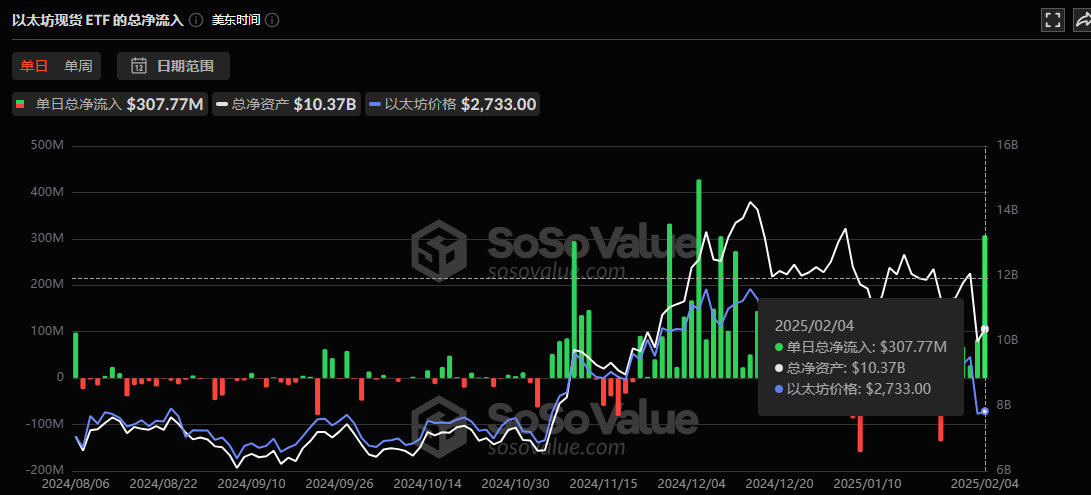
As of February 4, the total net asset value of Ethereum ETFs was approximately $10.37 billion, accounting for 3.15% of Ethereum’s market cap. In comparison, Bitcoin ETFs’ total net asset value stands at around $116 billion, representing about 5.93% of BTC’s market cap—significantly higher than Ethereum’s. This indicates that ETFs currently have a relatively smaller impact on Ethereum’s price trajectory.
On-Chain Data Stalls, Staking Continues to Bleed
Of course, this downturn was fundamentally driven by macro factors. Ethereum’s plunge was simply the most vulnerable link in this broader decline. On-chain data shows that Ethereum’s daily active addresses reached the second-highest level of the year—553,000—on January 25, just before the crash, and have been declining ever since. In terms of on-chain revenue, Ethereum’s mainnet earnings remain far below year-ago levels. At its lowest, daily income was around $1 million. This may also explain why staking inflows have remained negative since mid-November.
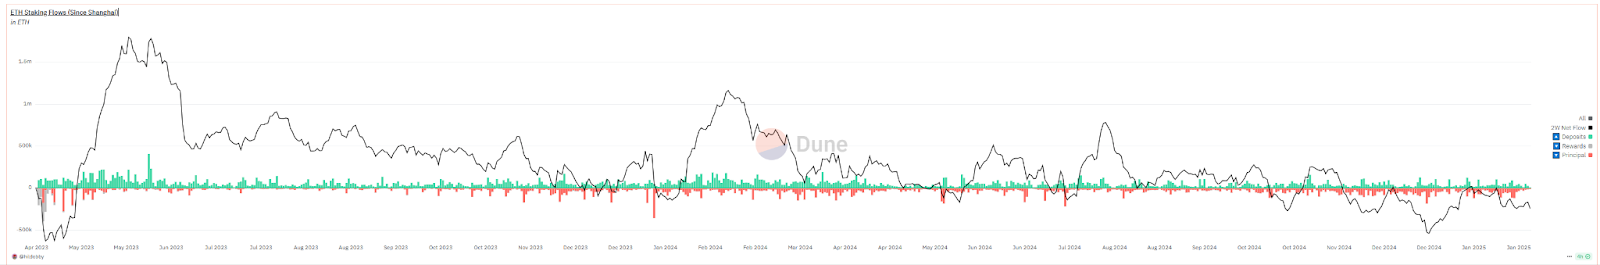
Data shows that since mid-November 2024, Ethereum’s weekly net staking inflow has remained negative, with a record single-day net outflow of 181,000 ETH. Currently, this metric remains below zero—the longest sustained period below zero since the Shanghai upgrade. Previously, between April 12 and April 30, 2023, net outflows lasted for over half a month. That period followed a short-term top and saw a maximum drawdown of about 16%. This current outflow cycle has now lasted 84 days, with prices correcting nearly 50% from their peak.
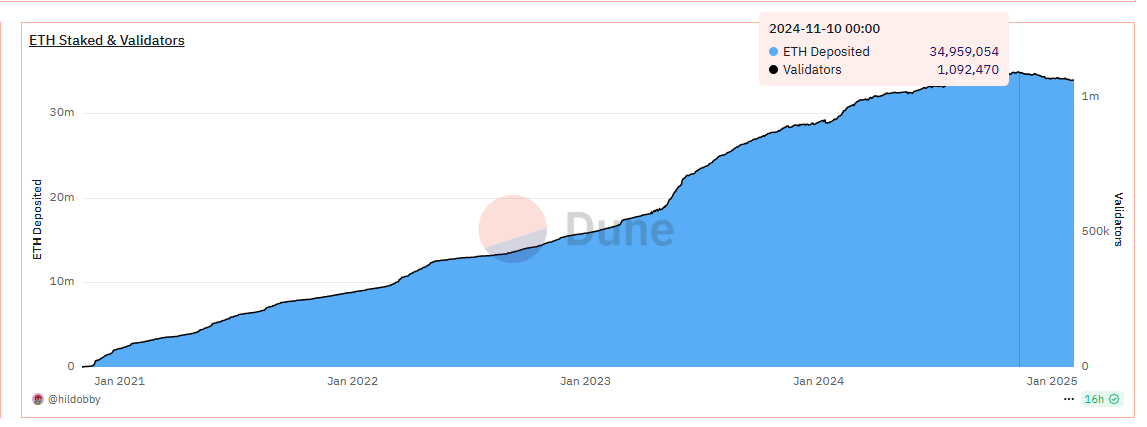
In terms of staking volume, the metric peaked historically on November 10, 2024, at approximately 34.95 million ETH, with 1.09 million stakers. The data has since shown a downward trend, with current staked volume around 34 million ETH and staker count at approximately 1.06 million.
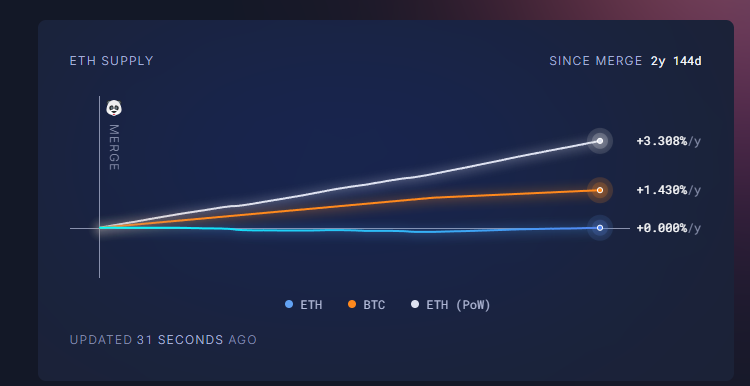
Beyond the above, Ethereum’s recent inflation rate has become another focal point in the market. After Ethereum transitioned from POW to POS, a key supply expectation was that token burning would lead to a deflationary model. However, recently, after more than a year oscillating between deflation and inflation, newly issued tokens have fully offset previous burn-driven deflation. As of February 5, Ethereum’s inflation rate has returned to 0%, identical to pre-Merge levels. Analysts attribute this shift primarily to reduced on-chain fee burning following the Dencun upgrade.
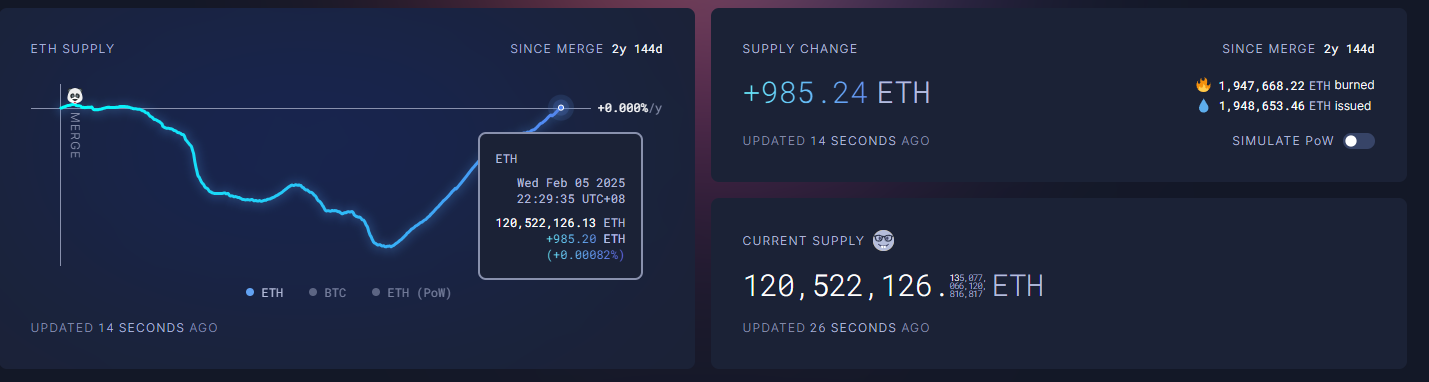
Nevertheless, even so, POS-based inflation remains significantly lower overall compared to the former POW issuance model. Additionally, Ethereum’s current inflation rate is also lower than that of BTC.
Overall, Ethereum’s recent market turbulence stems not only from external macro triggers but also from internal weaknesses—persistently rising open interest, escalating leveraged bets, and lackluster on-chain performance—all contributing to prolonged weakness. The end result was a clear reduction in both long and short open positions. After the February 3 plunge, prices quickly rebounded above $2,900. Meanwhile, U.S. spot ETF flows remained generally positive, highlighting a divergence between spot and futures markets.
Looking ahead, the biggest catalyst for a true market recovery may ultimately depend on whether Ethereum’s ecosystem activity metrics can achieve genuine growth. Otherwise, near-term price action will remain unpredictable, making both bottom-fishing and shorting extremely risky for leveraged and derivatives-focused investors.
Join TechFlow official community to stay tuned
Telegram:https://t.me/TechFlowDaily
X (Twitter):https://x.com/TechFlowPost
X (Twitter) EN:https://x.com/BlockFlow_News


